
Technology
URBAN ONE, INC. REPORTS SECOND QUARTER 2026 RESULTS

Published
3 months agoon
By

SILVER SPRING, Md., Aug. 4, 2026 /PRNewswire/ — Urban One, Inc. (NASDAQ: UONEK and UONE, referred to as, “Urban One,” the “Company”, “we”, “our” and/or “us”) today reported its results for the three months ended June 30, 2026. For the three months ended June 30, 2026, net revenue was approximately $85.8 million, a decrease of 6.4% from the same period in 2025. The Company reported operating loss of approximately $11.2 million for the three months ended June 30, 2026, compared to operating loss of approximately $120.7 million for the three months ended June 30, 2025. Broadcast and digital operating income(1) was approximately $22.2 million for the three months ended June 30, 2026, a decrease of $3.5 million from the same period in 2025. Net loss was approximately $7.1 million or $(1.58) per share (basic) for the three months ended June 30, 2026, compared to net loss of $77.9 million or $(17.41)(a) per share (basic) for the same period in 2025. Adjusted EBITDA(2) was approximately $11.7 million for the three months ended June 30, 2026, compared to approximately $14.0 million for the same period in 2025.
Alfred C. Liggins, III, Urban One’s CEO and President stated, “We saw some sequential improvement in the second quarter compared to the first quarter, with lower rates of revenue decline. Cable Television was down 7.4%, Digital was down 8.4%, Radio was down 3.9%, and Reach Media dropped by 10.6%. In Radio, our Miller Kaplan local Radio revenues were down 10.1% year-over-year vs. the market down 7.8%; and national was down 1.5% vs. the market down 4.6%. Including local digital, second quarter Radio revenue was down 4.9%. We did approximately $1.4 million in gross political advertising in the second quarter. Radio third quarter is pacing down 2.8%. We remain in a turnaround situation at Reach Media, where we continue to be impacted by a weak marketplace, key client attrition and sales team re-building. We continue to closely manage cash flows from operations, with concerted efforts to collect receivables and manage discretionary vendor spend. During the three months ended June 30, 2026, the Company repurchased approximately $23.5 million of its 2031 Second Lien Notes at a weighted average price of approximately 42.0% of par. Year-to-date, that is a total reduction in long-term debt of $60.2 million for an annual interest savings of $4.6 million and an increase in short-term debt of $10.0 million. During the quarter we completed the disposition of WLNK and WMXG in Charlotte. Our revised Adjusted EBITDA(2) guide for 2026 is now in the mid-fifty-million dollar range, given the realities of the current marketplace.”
Three Months Ended June 30,
Six Months Ended June 30,
2026
2025
2026
2025
(Unaudited)
(Unaudited)
CONSOLIDATED STATEMENTS OF
OPERATIONS
(In thousands, except share data)
(In thousands, except share data)
NET REVENUE
$ 85,757
$ 91,631
$ 163,408
$ 183,866
OPERATING EXPENSES
Programming and technical, excluding stock-based
compensation
29,774
28,647
59,779
59,245
Selling, general and administrative, excluding stock-
based compensation
45,201
49,493
88,684
99,598
Stock-based compensation
1,680
574
1,881
1,250
Depreciation and amortization
6,184
3,523
12,361
5,838
Impairment of goodwill, intangible assets and long-
lived assets
14,157
130,078
14,157
136,521
Total operating expenses
96,996
212,315
176,862
302,452
Operating loss
(11,239)
(120,684)
(13,454)
(118,586)
INTEREST AND INVESTMENT INCOME
—
616
8
1,582
INTEREST EXPENSE
(2,070)
(9,704)
(6,477)
(20,628)
GAIN ON SALE OF BUSINESS
4,671
—
4,671
—
GAIN ON RETIREMENT OF DEBT
—
30,297
2,080
41,884
OTHER (EXPENSE) INCOME, NET
(43)
124
(51)
316
Loss before benefit from income taxes
(8,681)
(99,351)
(13,223)
(95,432)
BENEFIT FROM INCOME TAXES
1,703
21,382
3,144
5,724
NET LOSS
(6,978)
(77,969)
(10,079)
(89,708)
NET INCOME (LOSS) ATTRIBUTABLE TO NON-
CONTROLLING INTERESTS
95
(67)
73
(64)
NET LOSS ATTRIBUTABLE TO COMMON
STOCKHOLDERS
$ (7,073)
$ (77,902)
$ (10,152)
$ (89,644)
Weighted-average shares outstanding – basic(3, a)
4,470,542
4,473,831
4,460,275
4,476,828
Weighted-average shares outstanding – diluted(4, a)
4,470,542
4,473,831
4,460,275
4,476,828
(a) Weighted-average shares outstanding used in the computation of basic and diluted net loss to common stockholders per share have been retroactively adjusted to reflect the 1-for-10 Reverse Stock Split that occurred on January 22, 2026.
Detailed segment data for the three and six months ended June 30, 2026 and 2025 is presented in the following tables:
Three Months Ended
June 30, 2026
(In thousands, unaudited)
Consolidated
Radio
Broadcasting
Reach Media
Digital
Cable
Television
Corporate/
Eliminations/
Other
NET REVENUE
$ 85,757
$ 35,276
$ 4,754
$ 9,397
$ 37,121
$ (791)
Less/(add):
Programming and technical
29,774
10,910
3,203
3,127
12,704
(170)
Sales and marketing
24,982
11,641
1,905
5,858
5,913
(335)
General and administrative
20,219
6,724
673
514
4,299
8,009
Add back:
Severance-related costs
85
51
—
10
—
24
Other costs
856
236
—
—
—
620
Adjusted EBITDA(2)
$ 11,723
$ 6,288
$ (1,027)
$ (92)
$ 14,205
$ (7,651)
Three Months Ended
June 30, 2025
(In thousands, unaudited)
Consolidated
Radio
Broadcasting
Reach Media
Digital
Cable
Television
Corporate/
Eliminations/
Other
NET REVENUE
$ 91,631
$ 36,693
$ 5,315
$ 10,254
$ 40,070
$ (701)
Less/(add):
Programming and technical
28,647
9,993
3,178
3,267
12,372
(163)
Sales and marketing
28,310
13,389
3,053
6,572
5,831
(535)
General and administrative
21,183
6,373
735
561
3,811
9,703
Add back:
Other costs
469
—
—
—
—
469
Adjusted EBITDA(2)
$ 13,960
$ 6,938
$ (1,651)
$ (146)
$ 18,056
$ (9,237)
Six Months Ended
June 30, 2026
(In thousands, unaudited)
Consolidated
Radio
Broadcasting
Reach Media
Digital
Cable
Television
Corporate/
Eliminations/
Other
NET REVENUE
$ 163,408
$ 65,811
$ 9,614
$ 16,185
$ 73,154
$ (1,356)
Less/(add):
Programming and technical
59,779
22,516
6,286
6,168
25,150
(341)
Sales and marketing
48,798
22,159
3,546
10,486
13,317
(710)
General and administrative
39,886
13,365
1,409
1,001
7,538
16,573
Add back:
Severance-related costs
219
99
72
16
—
32
Other costs
1,215
237
—
—
—
978
Adjusted EBITDA(2)
$ 16,379
$ 8,107
$ (1,555)
$ (1,454)
$ 27,149
$ (15,868)
Six Months Ended
June 30, 2025
(In thousands, unaudited)
Consolidated
Radio
Broadcasting
Reach Media
Digital
Cable
Television
Corporate/
Eliminations/
Other
NET REVENUE
$ 183,866
$ 69,303
$ 11,168
$ 20,466
$ 84,263
$ (1,334)
Less/(add):
Programming and technical
59,245
21,286
6,546
6,454
25,281
(322)
Sales and marketing
57,386
24,935
5,178
13,359
14,927
(1,013)
General and administrative
42,212
13,423
1,761
745
7,406
18,877
Add back/(deduct):
Severance-related costs
219
77
114
3
(1)
26
Other costs
1,575
50
1
1
—
1,523
Adjusted EBITDA(2)
$ 26,817
$ 9,786
$ (2,202)
$ (88)
$ 36,648
$ (17,327)
Three Months Ended June 30,
Six Months Ended June 30,
2026
2025
2026
2025
(Unaudited)
(Unaudited)
PER SHARE DATA – basic and diluted:
(In thousands, except per share
data)
(In thousands, except per share
data)
Net loss attributable to common stockholders (basic)(a)
$ (1.58)
$ (17.41)
$ (2.28)
$ (20.02)
Net loss attributable to common stockholders (diluted)(a)
$ (1.58)
$ (17.41)
$ (2.28)
$ (20.02)
Broadcast and digital operating income(1)
$ 22,152
$ 25,664
$ 37,016
$ 48,680
Broadcast and digital operating income(1) reconciliation:
Net loss attributable to common stockholders
$ (7,073)
$ (77,902)
$ (10,152)
$ (89,644)
Add back/(deduct) certain non-broadcast and digital
operating income items included in net loss:
Interest and investment income
—
(616)
(8)
(1,582)
Interest expense
2,070
9,704
6,477
20,628
Benefit from income taxes
(1,703)
(21,382)
(3,144)
(5,724)
Corporate selling, general and administrative
expenses(b)
11,370
12,173
22,071
23,657
Stock-based compensation
1,680
574
1,881
1,250
Gain on sale of business
(4,671)
—
(4,671)
—
Gain on retirement of debt
—
(30,297)
(2,080)
(41,884)
Other expense (income), net
43
(124)
51
(316)
Depreciation and amortization
6,184
3,523
12,361
5,838
Net income (loss) attributable to non-controlling
interests
95
(67)
73
(64)
Impairment of goodwill, intangible assets and long-
lived assets
14,157
130,078
14,157
136,521
Broadcast and digital operating income(1)
$ 22,152
$ 25,664
$ 37,016
$ 48,680
Adjusted EBITDA(2)
$ 11,723
$ 13,960
$ 16,379
$ 26,817
Adjusted EBITDA(2) reconciliation:
Net loss attributable to common stockholders
$ (7,073)
$ (77,902)
$ (10,152)
$ (89,644)
Interest and investment income
—
(616)
(8)
(1,582)
Interest expense
2,070
9,704
6,477
20,628
Benefit from income taxes
(1,703)
(21,382)
(3,144)
(5,724)
Depreciation and amortization
6,184
3,523
12,361
5,838
EBITDA(2)
(522)
(86,673)
5,534
(70,484)
Stock-based compensation
1,680
574
1,881
1,250
Gain on sale of business
(4,671)
—
(4,671)
—
Gain on retirement of debt
—
(30,297)
(2,080)
(41,884)
Other expense (income), net
43
(124)
51
(316)
Net income (loss) attributable to non-controlling
interests
95
(67)
73
(64)
Corporate costs(c)
856
362
1,215
1,109
Severance-related costs
85
—
219
219
Impairment of goodwill, intangible assets and long-
lived assets
14,157
130,078
14,157
136,521
Loss from ceased non-core businesses initiatives
—
107
—
466
Adjusted EBITDA(2)
$ 11,723
$ 13,960
$ 16,379
$ 26,817
(a)
Weighted-average shares outstanding used in the computation of basic and diluted net loss to common stockholders per share have been retroactively adjusted to reflect the 1-for-10 Reverse Stock Split that occurred on January 22, 2026.
(b)
Corporate selling, general and administrative expenses consist of expenses associated with our corporate headquarters and facilities, including personnel as well as other corporate overhead functions.
(c)
Corporate costs primarily include professional fees related to the material weakness remediation efforts as well as legal costs related to acquisition activities.
As of June 30, 2026
As of December 31, 2025
(In thousands)
SELECTED CONSOLIDATED BALANCE SHEET DATA:
Cash and cash equivalents and restricted cash
$ 16,202
$ 26,358
Intangible assets, net(a)
257,116
279,653
Total assets
551,512
592,994
Total long-term debt, net
399,298
429,742
Short-term borrowings under the asset-backed facility
20,000
10,000
Total liabilities
532,284
565,760
Total stockholders’ equity
16,313
24,603
Redeemable non-controlling interests(b)
—
2,631
Non-controlling interests(c)
2,915
—
(a)
Intangible assets, net include Goodwill, net, Radio Broadcasting Licenses, net, Other Intangible Assets, net, and Current Portion of Launch Assets, net.
(b)
On February 25, 2026, Reach Media closed on the Put Interest increasing the Company’s interest in Reach Media to 100.0%. Reach Media paid the last of the non-controlling interest shareholders approximately $1.3 million for the 5.4% interest.
(c)
Non-controlling interests represent the legal ownership of a radio station operated under a Local Programming and Marketing Agreement and Option Agreement under the variable interest entity guidance effective April 1, 2026.
As of June 30, 2026
As of December 31, 2025
(In thousands)
SELECTED LEVERAGE DATA:
10.500% First Lien Senior Secured Notes due 2030(a, c)
$ 60,600
$ 60,600
7.625% Second Lien Secured Notes due 2031(a, c)
235,113
291,020
7.375% senior secured notes due February 2028(b)
7,516
11,816
Total principal outstanding on long-term debt
303,229
363,436
Less: Unamortized debt issuance costs
(2,479)
(2,868)
Add: Premium(c)
98,548
69,174
Long-term debt, net
$ 399,298
$ 429,742
Short-term borrowings under the asset-backed facility
$ 20,000
$ 10,000
(a)
The 2030 First Lien Notes and 2031 Second Lien Notes pay interest semiannually on April 1 and October 1 of each year in arrears.
(b)
Subsequent to the effectiveness of the supplemental indenture on December 18, 2025, these notes are no longer secured. While these notes are styled as senior secured notes they are no longer secured by collateral. The 2028 Notes pay interest semiannually on February 1 and August 1 of each year in arrears.
(c)
The 2030 First Lien Notes and 2031 Second Lien Notes are accounted for under Accounting Standards Codification No. 470-60, Troubled Debt Restructurings by Debtors.
During the three months ended June 30, 2026, the Company repurchased approximately $23.5 million of its 2031 Second Lien Notes at a weighted average price of approximately 42.0% of par. As the 2031 Second Lien Notes are accounted under Accounting Standards Codification No. 470-60, Troubled Debt Restructurings by Debtors, no gain was recorded. Instead, the Company recorded an additional premium of $13.6 million, which is included in long-term debt, net on the Company’s consolidated balance sheets.
The Company made two additional draws of $5.0 million each for a total of $10.0 million in the second quarter of 2026, payable at an interest rate of approximately 6.75% and 6.01%. After giving effect to the outstanding $20.0 million drawdown and adjustments to account for the Borrowing Base, the Company’s borrowing capacity was approximately $26.1 million as of June 30, 2026.
The Company further made an additional draw of $7.0 million in the third quarter of 2026, payable at an interest rate of approximately 6.12%. The Company repaid the May 2026 draw of $5.0 million on August 2, 2026. After giving effect to the additional draw of $7.0 million, the $5.0 million repayment, and adjustments to account for the Borrowing Base, the Company’s borrowing capacity was approximately $24.1 million.
Dispositions and Acquisitions
In March 2026, the Company entered into agreements to sell its WMXG and WLNK-FM radio broadcasting licenses in Charlotte, North Carolina along with the associated station assets from the Radio Broadcasting segment to unrelated third parties for approximately $0.7 million and $4.2 million, respectively. FCC approval was obtained on May 13, 2026 for the WMXG station and on May 12, 2026 for the WLNK-FM station. The Company completed both sales on June 1, 2026 and recognized a gain of $4.7 million, which is included in Gain On Sale Of Business in the unaudited consolidated statement of operations for the three and six months ended June 30, 2026.
On April 28, 2026, the Company entered into an agreement to acquire Service Broadcasting Group, LLC, including radio stations KKDA and KRNB in Dallas, Texas for $22.0 million. At the same time, the Company also entered into an agreement to sell radio station KZMJ from the Radio Broadcasting segment to Fuzion Dallas, LLC for $6.0 million.
FCC approval was obtained on June 23, 2026 and the Company completed the sale of KZMJ on July 6, 2026. The Company recognized a gain of $3.2 million on the KZMJ disposition in the third quarter of 2026. FCC approval was obtained on June 26, 2026 for the Service Broadcasting Group, LLC acquisition and the acquisition was completed on July 17, 2026.
Cautionary Note Regarding Forward-Looking Statements
This press release includes forward-looking statements within the meaning of Section 27A of the Securities Act of 1933 and Section 21E of the Securities Exchange Act of 1934. Forward-looking statements represent management’s current expectations and are based upon information available to Urban One at the time of this release. These forward-looking statements involve known and unknown risks, uncertainties, and other factors, some of which are beyond Urban One’s control, which may cause the actual results to differ materially from any future results, performance or achievements expressed or implied by such forward-looking statements. Important factors that could cause actual results to differ materially are described in Urban One’s reports on Forms 10-K, 10-Q, 8-K and other filings with the Securities and Exchange Commission (the “SEC”). Urban One does not undertake any duty to update any forward-looking statements.
For the three months ended June 30, 2026, we recognized approximately $85.8 million in net revenue compared to approximately $91.6 million during the three months ended June 30, 2025. These amounts are net of agency commissions. We recognized approximately $35.3 million of revenue from our Radio Broadcasting segment during the three months ended June 30, 2026, compared to approximately $36.7 million for the three months ended June 30, 2025, a decrease of approximately $1.4 million. This decrease was primarily driven by weaker overall market demand from the national and local advertisers. We recognized approximately $4.8 million of revenue from our Reach Media segment during the three months ended June 30, 2026, compared to approximately $5.3 million for the three months ended June 30, 2025, a decrease of approximately $0.5 million. This decrease was primarily driven by a decrease in syndicated revenue. We recognized approximately $9.4 million of revenue from our Digital segment during the three months ended June 30, 2026, compared to approximately $10.3 million during the three months ended June 30, 2025, a decrease of approximately $0.9 million. The decrease was primarily driven by the decrease in direct revenue streams, reflecting reduced advertising spend from diversity, equity and inclusion-focused campaigns. We recognized approximately $37.1 million of revenue from our Cable Television segment during the three months ended June 30, 2026, compared to approximately $40.1 million during the three months ended June 30, 2025, a decrease of approximately $3.0 million. The decrease was primarily driven by the churn of subscribers and lower advertising sales.
The following charts indicate the sources of our net revenues for the three and six months ended June 30, 2026:
Three Months Ended June 30,
2026
2025
$ Change
% Change
(In thousands, unaudited)
Net revenue:
Radio advertising
$ 34,732
$ 38,627
$ (3,895)
(10.1) %
Political advertising
1,243
254
989
*NM
Digital advertising
9,386
10,241
(855)
(8.3) %
Cable Television advertising
20,773
22,977
(2,204)
(9.6) %
Cable Television affiliate fees
16,286
17,061
(775)
(4.5) %
Event revenues & other
3,337
2,471
866
35.0 %
Net revenue
$ 85,757
$ 91,631
$ (5,874)
(6.4) %
*NM – Not meaningful
Six Months Ended June 30,
2026
2025
$ Change
% Change
(In thousands, unaudited)
Net revenue:
Radio advertising
$ 66,856
$ 74,844
$ (7,988)
(10.7) %
Political advertising
2,143
404
1,739
*NM
Digital advertising
16,170
20,452
(4,282)
(20.9) %
Cable Television advertising
39,868
48,402
(8,534)
(17.6) %
Cable Television affiliate fees
33,163
35,778
(2,615)
(7.3) %
Event revenues & other
5,208
3,986
1,222
30.7 %
Net revenue
$ 163,408
$ 183,866
$ (20,458)
(11.1) %
*NM – Not meaningful.
Operating expenses, excluding depreciation and amortization, stock-based compensation, and impairment of goodwill, intangible assets and long-lived assets, were approximately $75.0 million for the three months ended June 30, 2026, compared to approximately $78.1 million for the comparable period in 2025. Operating expenses were down by approximately 4.1%, driven mainly by revenue-related variable expenses such as media monitoring, traffic acquisition costs, bad debt reserve, as well as third-party professional fees.
Impairment of goodwill, intangible assets and long-lived assets was approximately $14.2 million for three months ended June 30, 2026, compared to $130.1 million for the three months ended June 30, 2025. The impairment loss of $14.2 million during the three months ended June 30, 2026 represents approximately $13.9 million goodwill impairment charge related to the Reach Media reporting unit and approximately $0.3 million impairment charge related to the long-lived asset of Reach Media.
Depreciation and amortization expense was approximately $6.2 million for the three months ended June 30, 2026, compared to approximately $3.5 million for the three months ended June 30, 2025, an increase of approximately $2.7 million. This increase is primarily driven by the Radio Broadcasting licenses amortization, which the Company started to amortize effective June 1, 2025.
Interest expense was approximately $2.1 million for the three months ended June 30, 2026, compared to approximately $9.7 million for the three months ended June 30, 2025, a decrease of approximately $7.6 million. This decrease was due to lower overall debt balances outstanding and lower effective interest rates. The Company recognizes interest expense using an effective interest rate of approximately 5.32% on the 2030 First Lien Notes, 0.15% on the 2031 Second Lien Notes, and 7.71% on the 2028 Notes for the three months ended June 30, 2026. The effective interest rates on the 2030 First Lien Notes and 2031 Second Lien Notes differ from the contractual interest payment primarily as a result of the accounting for these debt instruments under Accounting Standards Codification No. 470-60, Troubled Debt Restructurings by Debtors.
For the three months ended June 30, 2026, we recorded a benefit from income taxes of approximately $1.7 million on the pre-tax loss of approximately $8.7 million resulting in an actual effective tax rate of 19.6%. For the three months ended June 30, 2025, we recorded a benefit from income taxes of approximately $21.4 million on pre-tax loss of approximately $99.4 million resulting in an actual effective tax rate of 21.5%, which includes $6.4 million of discrete tax expense related to the change of accounting estimate for radio broadcasting licenses that impacted our valuation allowance.
Other pertinent financial information includes capital expenditures of approximately $1.7 million and $1.2 million for the three months ended June 30, 2026 and 2025, respectively. The increase in capital expenditure is driven by the build-out of a studio in the Indianapolis radio market.
Supplemental Financial Information:
For comparative purposes, the following more detailed statements of operations for the three and six months ended June 30, 2026 are included.
Three Months Ended June 30, 2026
(In thousands, unaudited)
Consolidated
Radio
Broadcasting
Reach
Media
Digital
Cable
Television
All Other –
Corporate/
Eliminations
NET REVENUE
$ 85,757
$ 35,276
$ 4,754
$ 9,397
$ 37,121
$ (791)
OPERATING EXPENSES:
Programming and technical
29,774
10,910
3,203
3,127
12,704
(170)
Selling, general and
administrative
45,201
18,365
2,578
6,372
10,213
7,673
Stock-based compensation
1,680
44
13
25
781
817
Depreciation and amortization
6,184
4,919
23
379
674
189
Impairment of goodwill,
intangible assets and long-lived
assets
14,157
—
14,157
—
—
—
Total operating expenses
96,996
34,238
19,974
9,903
24,372
8,509
Operating (loss) income
(11,239)
1,038
(15,220)
(506)
12,749
(9,300)
INTEREST EXPENSE
(2,070)
(2)
—
—
—
(2,068)
GAIN ON SALE OF
BUSINESS
4,671
4,671
—
—
—
—
OTHER EXPENSE, NET
(43)
(43)
—
—
—
—
(Loss) income before benefit
from (provision for) income
taxes
(8,681)
5,664
(15,220)
(506)
12,749
(11,368)
BENEFIT FROM (PROVISION
FOR) INCOME TAXES
1,703
(1,513)
515
115
(2,790)
5,376
NET (LOSS) INCOME
(6,978)
4,151
(14,705)
(391)
9,959
(5,992)
NET INCOME
ATTRIBUTABLE TO NON-
CONTROLLING INTERESTS
95
95
—
—
—
—
NET (LOSS) INCOME
ATTRIBUTABLE TO
COMMON STOCKHOLDERS
(7,073)
4,056
(14,705)
(391)
9,959
(5,992)
Adjusted EBITDA(2)
$ 11,723
$ 6,288
$ (1,027)
$ (92)
$ 14,205
$ (7,651)
Three Months Ended June 30, 2025
(In thousands, unaudited)
Consolidated
Radio
Broadcasting
Reach
Media
Digital
Cable
Television
All Other –
Corporate/
Eliminations
NET REVENUE
$ 91,631
$ 36,693
$ 5,315
$ 10,254
$ 40,070
$ (701)
OPERATING EXPENSES:
Programming and technical
28,647
9,993
3,178
3,267
12,372
(163)
Selling, general and
administrative
49,493
19,762
3,788
7,133
9,642
9,168
Stock-based compensation
574
133
23
73
201
144
Depreciation and amortization
3,523
2,278
33
393
675
144
Impairment of goodwill and
intangible assets
130,078
125,187
—
4,891
—
—
Total operating expenses
212,315
157,353
7,022
15,757
22,890
9,293
Operating (loss) income
(120,684)
(120,660)
(1,707)
(5,503)
17,180
(9,994)
INTEREST AND INVESTMENT
INCOME
616
—
—
—
—
616
INTEREST EXPENSE
(9,704)
(2)
(145)
—
—
(9,557)
GAIN ON RETIREMENT OF
DEBT
30,297
—
—
—
—
30,297
OTHER INCOME, NET
124
108
—
—
—
16
(Loss) income before benefit
from (provision for) income taxes
(99,351)
(120,554)
(1,852)
(5,503)
17,180
11,378
BENEFIT FROM (PROVISION
FOR) INCOME TAXES
21,382
28,579
13
1,792
(3,693)
(5,309)
NET (LOSS) INCOME
(77,969)
(91,975)
(1,839)
(3,711)
13,487
6,069
NET LOSS ATTRIBUTABLE
TO NON-CONTROLLING
INTERESTS
(67)
—
(67)
—
—
—
NET (LOSS) INCOME
ATTRIBUTABLE TO
COMMON STOCKHOLDERS
(77,902)
(91,975)
(1,772)
(3,711)
13,487
6,069
Adjusted EBITDA(2)
$ 13,960
$ 6,938
$ (1,651)
$ (146)
$ 18,056
$ (9,237)
Six Months Ended June 30, 2026
(In thousands, unaudited)
Consolidated
Radio
Broadcasting
Reach
Media
Digital
Cable
Television
All Other –
Corporate/
Eliminations
NET REVENUE
$ 163,408
$ 65,811
$ 9,614
$ 16,185
$ 73,153
$ (1,355)
OPERATING EXPENSES:
Programming and technical
59,779
22,516
6,286
6,168
25,150
(341)
Selling, general and
administrative
88,684
35,524
4,957
11,486
20,854
15,863
Stock-based compensation
1,881
87
25
50
781
938
Depreciation and amortization
12,361
9,799
56
775
1,348
383
Impairment of goodwill,
intangible assets and long-lived
assets
14,157
—
14,157
—
—
—
Total operating expenses
176,862
67,926
25,481
18,479
48,133
16,843
Operating (loss) income
(13,454)
(2,115)
(15,867)
(2,294)
25,020
(18,198)
INTEREST AND
INVESTMENT INCOME
8
—
—
—
—
8
INTEREST EXPENSE
(6,477)
(4)
—
—
—
(6,473)
GAIN ON SALE OF
BUSINESS
4,671
4,671
—
—
—
—
GAIN ON RETIREMENT OF
DEBT
2,080
—
—
—
—
2,080
OTHER (EXPENSE) INCOME,
NET
(51)
(46)
—
(15)
—
10
(Loss) income before benefit
from (provision for) income
taxes
(13,223)
2,506
(15,867)
(2,309)
25,020
(22,573)
BENEFIT FROM (PROVISION
FOR) INCOME TAXES
3,144
(737)
657
503
(5,467)
8,188
NET (LOSS) INCOME
(10,079)
1,769
(15,210)
(1,806)
19,553
(14,385)
NET INCOME (LOSS)
ATTRIBUTABLE TO NON-
CONTROLLING INTERESTS
73
95
(22)
—
—
—
NET (LOSS) INCOME
ATTRIBUTABLE TO
COMMON STOCKHOLDERS
(10,152)
1,674
(15,188)
(1,806)
19,553
(14,385)
Adjusted EBITDA(2)
$ 16,379
$ 8,107
$ (1,555)
$ (1,454)
$ 27,149
$ (15,868)
Six Months Ended June 30, 2025
(In thousands, unaudited)
Consolidated
Radio
Broadcasting
Reach
Media
Digital
Cable
Television
All Other –
Corporate/
Eliminations
NET REVENUE
$ 183,866
$ 69,303
$ 11,168
$ 20,466
$ 84,263
$ (1,334)
OPERATING EXPENSES:
Programming and technical
59,245
21,286
6,546
6,454
25,281
(322)
Selling, general and
administrative
99,598
38,358
6,939
14,104
22,333
17,864
Stock-based compensation
1,250
241
46
158
489
316
Depreciation and amortization
5,838
3,274
67
779
1,390
328
Impairment of goodwill and
intangible assets
136,521
131,630
—
4,891
—
—
Total operating expenses
302,452
194,789
13,598
26,386
49,493
18,186
Operating (loss) income
(118,586)
(125,486)
(2,430)
(5,920)
34,770
(19,520)
INTEREST AND
INVESTMENT INCOME
1,582
—
—
—
—
1,582
INTEREST EXPENSE
(20,628)
(4)
(145)
—
—
(20,479)
GAIN ON RETIREMENT OF
DEBT
41,884
—
—
—
—
41,884
OTHER INCOME, NET
316
108
—
—
—
208
(Loss) income before benefit
from (provision for) income
taxes
(95,432)
(125,382)
(2,575)
(5,920)
34,770
3,675
BENEFIT FROM (PROVISION
FOR) INCOME TAXES
5,724
29,669
(3)
2,184
(7,575)
(18,551)
NET (LOSS) INCOME
(89,708)
(95,713)
(2,578)
(3,736)
27,195
(14,876)
NET LOSS ATTRIBUTABLE
TO NON-CONTROLLING
INTERESTS
(64)
—
(64)
—
—
—
NET (LOSS) INCOME
ATTRIBUTABLE TO COMMON
STOCKHOLDERS
(89,644)
(95,713)
(2,514)
(3,736)
27,195
(14,876)
Adjusted EBITDA(2)
$ 26,817
$ 9,786
$ (2,202)
$ (88)
$ 36,648
$ (17,327)
Urban One, Inc. will hold a conference call to discuss its results for the second fiscal quarter of 2026. The conference call is scheduled for Tuesday, August 4, 2026 at 10:00 a.m. EDT. To participate on this call, U.S. callers may dial toll-free (+1) 800-715-9871; international callers may dial direct (+1) 646-307-1963. The Access Code is 3701023.
A replay of the conference call will be available from 2:00 p.m. EDT August 4, 2026 until 11:59 p.m. EDT August 11, 2026. Callers may access the replay by calling (+1) 800-770-2030; international callers may dial direct (+1) 609-800-9909. The replay Access Code is 3701023.
Access to live audio and a replay of the conference call will also be available on Urban One’s corporate website at www.urban1.com. The replay will be made available on the website for seven days after the call.
Urban One Inc. (urban1.com), together with its subsidiaries, is the largest diversified media company that primarily targets Black Americans and urban consumers in the United States. The Company owns TV One, LLC (tvone.tv), a television network serving more than 30 million households, offering a broad range of original programming, classic series and movies designed to entertain, inform, and inspire a diverse audience of adult Black viewers. As of July 31, 2026, following the Service Broadcasting Group, LLC acquisition, the Company owned and/or operated 76 independently formatted, revenue producing broadcast stations (including 59 FM or AM stations, 15 HD stations, and the 2 low power television stations the Company operates), located in 13 of the most populous African-American markets in the United States. Through Reach Media, Inc. (blackamericaweb.com), the Company also operates syndicated programming including the Rickey Smiley Morning Show, and the DL Hughley Show. In addition to its radio and television broadcast assets, Urban One owns iOne Digital (ionedigital.com), our wholly owned digital platform serving the African American community through social content, news, information, and entertainment websites, including its Cassius, Bossip, HipHopWired and MadameNoire digital platforms and brands. Through our national multi-media operations, we provide advertisers with a unique and powerful delivery mechanism to the African American and urban audiences.
Notes:
1
“Broadcast and digital operating income”: The radio broadcasting industry commonly refers to “station operating income” which consists of net loss before depreciation and amortization, income taxes, interest expense, interest and investment income, non-controlling interests in income of subsidiaries, other income, net, loss from unconsolidated joint venture, corporate selling, general and administrative expenses, stock-based compensation, impairment of goodwill and intangible assets, and (gain) loss on retirement of debt. However, given the diverse nature of our business, station operating income is not truly reflective of our multi-media operation and, therefore, we use the term “broadcast and digital operating income.” Broadcast and digital operating income is not a measure of financial performance under GAAP. Nevertheless, broadcast and digital operating income is a significant measure used by our management to evaluate the operating performance of our core operating segments. Broadcast and digital operating income provides helpful information about our results of operations, apart from expenses associated with our fixed assets and goodwill and intangible assets, income taxes, investments, impairment charges, debt financings and retirements, corporate overhead and stock-based compensation. Our measure of broadcast and digital operating income is similar to industry use of station operating income; however, it reflects our more diverse business and therefore is not completely analogous to “station operating income” or other similarly titled measures as used by other companies. Broadcast and digital operating income does not represent operating income or loss, or cash flow from operating activities, as those terms are defined under GAAP, and should not be considered as an alternative to those measurements as an indicator of our performance.
2
“Adjusted EBITDA”: Adjusted EBITDA consists of net (loss) income plus (1) depreciation and amortization, income taxes, interest expense, net income attributable to non-controlling interests, impairment of goodwill, intangible assets and long lived assets, stock-based compensation, gain on sale of business, (gain) loss on retirement of debt, corporate costs, non-recurring litigation settlement costs, non-recurring debt refinancing costs, severance-related costs, investment income, loss from ceased non-core business initiatives less (2) other income, net and interest and investment income. Net (loss) income before interest income, interest expense, income taxes, depreciation and amortization is commonly referred to in our business as “EBITDA.” Adjusted EBITDA and EBITDA are not measures of financial performance under GAAP. We believe Adjusted EBITDA is often a useful measure of a company’s operating performance and is a significant measure used by our management to evaluate the operating performance of our business. Accordingly, based on the previous description of Adjusted EBITDA, we believe that it provides useful information about the operating performance of our business, apart from the expenses associated with our fixed assets and goodwill and intangible assets, or capital structure. Adjusted EBITDA is frequently used as one of the measures for comparing businesses in the broadcasting industry, although our measure of Adjusted EBITDA may not be comparable to similarly titled measures of other companies, including, but not limited to the fact that our definition includes the results of all four of our operating segments (Radio Broadcasting, Reach Media, Digital, and Cable Television). Business activities unrelated to these four segments are included in an “all other” category which the Company refers to as “All other – corporate/eliminations.” Adjusted EBITDA and EBITDA do not purport to represent operating income or cash flow from operating activities, as those terms are defined under GAAP, and should not be considered as alternatives to those measurements as an indicator of our performance.
3
For the three months ended June 30, 2026 and 2025, Urban One had 4,470,542 and 4,473,831 shares of common stock outstanding on a weighted average basis (basic), respectively. For the six months ended June 30, 2026 and 2025 Urban One had 4,460,275 and 4,476,828 shares of common stock outstanding on a weighted average basis (basic), respectively.
4
For the three months ended June 30, 2026 and 2025, Urban One had 4,470,542 and 4,473,831 shares of common stock outstanding on a weighted average basis (fully diluted for outstanding stock awards), respectively. For the six months ended June 30, 2026 and 2025 Urban One had 4,460,275 and 4,476,828 shares of common stock outstanding on a weighted average basis (basic), respectively.
View original content to download multimedia:https://www.prnewswire.com/news-releases/urban-one-inc-reports-second-quarter-2026-results-302841724.html
SOURCE Urban One, Inc.

You may like
Technology
Atomic Object Selected as Finalist for 2026 NC TECH Awards
Published
18 minutes agoon
November 9, 2026By

RALEIGH, N.C., Nov. 9, 2026 /PRNewswire/ — Atomic Object has been selected as a finalist for the NC Tech Awards Software Solutions award. The NC TECH Awards is North Carolina’s only statewide technology awards program that recognizes innovation, growth and leadership in the tech sector and is presented by the NC TECH (North Carolina Technology Association). Winners will be announced November 16 at the Sheraton in Durham.
Since entering the Raleigh market in 2022, Atomic Object has been recognized as one of the area’s top software development partners. The finalist nod reflects the trust the Raleigh team has built with Triangle startups and enterprise clients. That momentum led the office to move from a coworking space into a 6,000-square-foot suite in downtown Raleigh in 2025.
The majority female Raleigh office is led by Managing Partners, Taylor Vanden Hoek and Ryan Abel. Vanden Hoek and Abel have partnered with the Downtown Raleigh Alliance, Digital Health Institute for Transformation, and Duke University’s Pratt School of Engineering.
“For over 20 years, NC TECH has celebrated companies, organizations and individuals for outstanding achievement at the NC TECH Awards. As a finalist this year, Atomic Object has distinguished itself as one of the state’s innovative and emergent leaders,” stated Michelle Calton, NC TECH’s Interim CEO.
“When we opened our Raleigh office in 2022, we knew earning a place in this community would take time. Being named an NC TECH Awards finalist tells us Atomic Object has put down real roots in the Triangle, and we’re proud of the team and the clients who helped us get here,” said Taylor Vanden Hoek, Managing Partner of Atomic Object Raleigh.
About NC TECH
NC TECH is a not-for-profit, membership-driven trade association and the primary voice of the technology industry in North Carolina. NC TECH’s membership includes more than 600 member companies, organizations and institutions employing more than 250,000 workers in North Carolina. Visit nctech.org.
About Atomic Object
Atomic Object is an employee-owned custom software design and development consultancy founded in 2001. Its teams of designers, developers and delivery leads build web, mobile, desktop, IoT, cloud and AI-powered software for clients in healthcare, financial services, education, and insurance. The Raleigh office is located in the heart of downtown on Fayetteville Street. Visit atomicobject.com.
View original content:https://www.prnewswire.com/news-releases/atomic-object-selected-as-finalist-for-2026-nc-tech-awards-302932797.html
SOURCE Atomic Object
Technology
Ceva, Inc. Announces Third Quarter 2026 Financial Results
Published
18 minutes agoon
November 9, 2026By
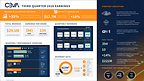
18% sequential royalty revenue growth and record AI licensing revenues, with multi-year smartphone modem ramp ahead
ROCKVILLE, Md., Nov. 9, 2026 /PRNewswire/ — Ceva, Inc. (NASDAQ: CEVA), the leading licensor of silicon and software IP for the Smart Edge, today announced its financial results for the third quarter ended September 30, 2026.
Third Quarter Highlights: *
Total revenues of $29.1 million, up 2% YoY.Licensing and related revenues of $16.3 million, up 2% YoY.Record AI licensing revenues, accounting for more than 35% of total licensing and related revenues.Royalty revenues of $12.7 million, up 3% YoY and 18% sequentially.623 million Ceva-powered devices shipped by customers, matching all-time quarterly record, including record cellular IoT and Wi-Fi 6 shipments.
*Unless otherwise stated, all comparisons are to the third quarter 2025.
Amir Panush, Chief Executive Officer of Ceva, commented, “We continued to grow our business in the third quarter, with 18% sequential royalty revenue growth and Ceva-powered device shipments matching our all-time quarterly record. In licensing, we achieved our highest-ever AI licensing revenues and expanded our relationships with three of our highest-volume connectivity customers, building a broader base of potential future royalty-generating products.
“The continued ramp of internally developed modems at a major U.S. customer is creating a multi-year smartphone royalty growth opportunity through 2027 and beyond. We are also extending our AI business into infrastructure applications and moving closer to initial NPU royalties. Together, we believe these developments reinforce the long-term growth potential of our Connect, Sense and Infer portfolio.”
Business and Market Highlights
During the quarter, Ceva signed 10 IP licensing agreements, including three with first-time customers. Six were for AI technologies, including one with a new customer targeting AI infrastructure, and Edge AI agreements targeting consumer, automotive and industrial markets.
In wireless connectivity, three of Ceva’s highest-volume customers extended their agreements for multiple years and added more Ceva IP, including one adding Wi-Fi 6 and Wi-Fi 7 to its existing Bluetooth and DSP deployments. In sensing, Ceva expanded its presence in smart TVs with a customer targeting advanced motion-based interaction.
Other Third Quarter Financial Data: *
GAAP gross margin was 85%, as compared to GAAP gross margin of 88%GAAP operating loss was $3.5 million, as compared to a GAAP operating loss of $2.1 millionGAAP net loss was $2.3 million, as compared to a GAAP net loss of $2.5 millionGAAP diluted loss per share was $0.08, as compared to GAAP diluted loss per share of $0.10Non-GAAP gross margin was 86%, as compared to non-GAAP gross margin of 89%Non-GAAP operating income was $2.5 million, as compared to non-GAAP operating income of $3.1 millionNon-GAAP net income and non-GAAP diluted earnings per share were $3.8 million and $0.13, respectively, as compared to non-GAAP net income and non-GAAP diluted earnings per share of $2.7 million and $0.11, respectively
*Unless otherwise stated, all comparisons are to the third quarter 2025.
Yaniv Arieli, Chief Financial Officer of Ceva, added, “Royalty revenues grew 18% sequentially, led by the ramp of internally developed modems at a major U.S. customer and continued strength in broad-based IoT and connectivity, partially offset by memory-related softness in compute-intensive consumer devices. A significant multi-year connectivity agreement we expected in the third quarter was signed early in the fourth quarter. With a robust licensing pipeline and a step-up in smartphone royalties, we expect a strong fourth quarter on both the top and bottom lines.”
Ceva Conference Call
On November 9, 2026, Ceva management will conduct a conference call at 8:30 a.m. Eastern Time to discuss the operating performance for the quarter.
The conference call will be available via the following dial-in numbers:
U.S. Participants: Dial +1 844-435-0316 (Access Code: Ceva)International Participants: Dial +1 412-317-6365 (Access Code: Ceva)
The conference call will also be available live via webcast at the following link: https://app.webinar.net/oKLP6DwbXyv. Please go to the website at least fifteen minutes prior to the call to register.
For those who cannot access the live broadcast, a replay will be available by dialing +1 855-669-9658 or +1 412-317-0088 (access code: 7028120) from one hour after the end of the call until 9:00 a.m. (Eastern Time) on November 16, 2026. The replay will also be available at Ceva’s website at www.ceva-ip.com.
Forward-Looking Statements
This press release contains forward-looking statements that involve risks and uncertainties, as well as assumptions that, if they materialize or prove incorrect, could cause the results of Ceva to differ materially from those expressed or implied by such forward-looking statements and assumptions. Forward-looking statements include statements about Ceva’s positioning for future growth and to serve as a foundational technology provider for intelligent, connected devices, licensing agreement wins, future industry demand, our market position for the future and future growth in the demand for our products, our forecast of financial measures for the following quarter and 2026, our long-term targets and underlying assumptions, our future investments, expectations about future markets, the success of our strategies and agreements, visibility into future revenue streams, and Ceva’s focus on expense management and profitability improvement. The risks, uncertainties and assumptions that could cause differing Ceva results include: the effect of intense industry competition; the ability of Ceva’s technologies and products incorporating Ceva’s technologies to achieve market acceptance; Ceva’s ability to meet changing needs of end-users and evolving market demands; the lengthy sales cycle for IP and related solutions; Ceva’s ability to diversify royalty streams and license revenues; geopolitical risks and instability, including the impact of tariffs and other trade measures and potential disruptions related to ongoing conflicts in the Middle East; and general market conditions and other risks relating to Ceva’s business and industry, including, but not limited to, those that are described from time to time in our SEC filings. Ceva assumes no obligation to update any forward-looking statements or information, which speak as of their respective dates.
About Ceva, Inc.
Ceva powers the Smart Edge, bridging the digital and physical worlds to bring AI-driven products to life. Our Ceva AI fabric portfolio of silicon and software IP enables devices to Connect, Sense, and Infer – the essential capabilities for the intelligent edge. From 5G, cellular IoT, Bluetooth, Wi-Fi, and UWB connectivity to scalable Edge AI NPUs, AI DSPs, sensor fusion processors and embedded software, Ceva provides the foundational IP for devices that connect, understand their environment, and act in real time.
With more than 23 billion devices shipped and trusted by 400+ customers worldwide, Ceva is the backbone of today’s most advanced smart edge products—from AI-infused wearables and IoT devices to autonomous vehicles and 5G infrastructure. Our differentiated solutions deliver seamless integration into existing design flows, total flexibility to combine solutions based on design needs and ultra‑low‑power performance in a minimal silicon footprint, helping customers accelerate development, reduce risk, and bring innovative products to market faster. As technology evolves toward Physical AI, Ceva’s IP portfolio lays the foundation for systems that are always connected, contextually aware, and capable of intelligent, real-time decision-making.
Visit us at www.ceva-ip.com and follow us on LinkedIn, X, YouTube, Facebook, and Instagram.
For more information, contact:
Yaniv Arieli
Ceva, Inc.
CFO
+972.9.961.3770
Richard Kingston
Ceva, Inc.
VP Market Intelligence, Investor & Public Relations
+1.650.220.1948
CEVA, INC. AND ITS SUBSIDIARIES
INTERIM CONDENSED CONSOLIDATED STATEMENTS OF LOSS – U.S. GAAP
U.S. dollars in thousands, except per share data
Three months ended
Nine months ended
September 30,
September 30,
2026
2025
2026
2025
Unaudited
Unaudited
Unaudited
Unaudited
Revenues:
Licensing and related revenues
$ 16,338
$ 16,028
$ 52,379
$ 46,092
Royalties
12,725
12,356
32,741
32,215
Total revenues
29,063
28,384
85,120
78,307
Cost of revenues
4,252
3,392
11,627
10,428
Gross profit
24,811
24,992
73,493
67,879
Operating expenses:
Research and development, net
18,128
19,532
57,297
55,899
Sales and marketing
3,935
3,012
10,980
9,783
General and administrative
6,154
4,383
15,557
12,697
Amortization of intangible assets
110
149
336
448
Total operating expenses
28,327
27,076
84,170
78,827
Operating loss
(3,516)
(2,084)
(10,677)
(10,948)
Financial income, net
2,301
1,245
5,156
5,466
Remeasurement of marketable equity securities
(16)
1
72
(261)
Loss before taxes on income
(1,231)
(838)
(5,449)
(5,743)
Income tax expense
1,070
1,671
4,221
3,797
Net loss
$ (2,301)
$ (2,509)
$ (9,670)
$ (9,540)
Basic and diluted net loss per share
$ (0.08)
$ (0.10)
$ (0.35)
$ (0.40)
Weighted-average shares used to compute net loss
per share (in thousands):
Basic and diluted
28,323
23,942
28,001
23,869
Unaudited Reconciliation of GAAP to Non-GAAP Financial Measures
U.S. dollars in thousands, except per share data
Three months ended
Nine months ended
September 30,
September 30,
2026
2025
2026
2025
Unaudited
Unaudited
Unaudited
Unaudited
GAAP net loss
$
(2,301)
$
(2,509)
$
(9,670)
$
(9,540)
Equity-based compensation expense included in cost of
revenues
173
168
533
493
Equity-based compensation expense included in research
and development expenses
2,130
2,639
7,651
7,778
Equity-based compensation expense included in sales
and marketing expenses
880
571
2,310
1,735
Equity-based compensation expense included in general
and administrative expenses
1,809
1,495
5,041
4,092
Amortization of intangible assets related to acquisition of
businesses
168
208
302
625
Acquisition and deal-related costs
893
145
1,014
433
Loss (income) associated with the remeasurement of
marketable equity securities
16
(1)
(72)
261
Non-GAAP net income
$
3,768
$
2,716
$
7,109
$
5,877
GAAP weighted-average number of Common Stock used
in computation of diluted net loss per share (in
thousands)
28,323
23,942
28,001
23,869
Weighted-average number of shares related to
outstanding stock-based awards (in thousands)
1,579
1,763
1,733
1,714
Non-GAAP weighted-average number of
Common Stock used in computation of diluted earnings
per share (in thousands)
29,902
25,705
29,734
25,583
GAAP diluted loss per share
$
(0.08)
$
(0.10)
$
(0.35)
$
(0.40)
Equity-based compensation expense
$ 0.18
$ 0.19
$ 0.54
$ 0.57
Amortization of intangible assets related to acquisition of
businesses
$ 0.00
$ 0.01
$ 0.01
$ 0.03
Acquisition and deal-related costs
$ 0.03
$ 0.01
$ 0.04
$ 0.02
Loss (income) associated with the remeasurement of
marketable equity securities
$ 0.00
$ 0.00
$ 0.00
$ 0.01
Non-GAAP diluted earnings per share
$ 0.13
$ 0.11
$ 0.24
$ 0.23
Three months ended
Nine months ended
September 30,
September 30,
2026
2025
2026
2025
Unaudited
Unaudited
Unaudited
Unaudited
GAAP operating loss
$ (3,516)
$ (2,084)
$ (10,677)
$ (10,948)
Equity-based compensation expense included in cost of
revenues
173
168
533
493
Equity-based compensation expense included in research
and development expenses
2,130
2,639
7,651
7,778
Equity-based compensation expense included in sales
and marketing expenses
880
571
2,310
1,735
Equity-based compensation expense included in general
and administrative expenses
1,809
1,495
5,041
4,092
Amortization of intangible assets related to acquisition of
businesses
168
208
302
625
Acquisition and deal-related costs
893
145
1,014
433
Total non-GAAP operating income
$ 2,537
$ 3,142
$ 6,174
$ 4,208
Three months ended
Nine months ended
September 30,
September 30,
2026
2025
2026
2025
Unaudited
Unaudited
Unaudited
Unaudited
GAAP gross profit
$ 24,811
$ 24,992
$ 73,493
$ 67,879
GAAP gross margin
85 %
88 %
86 %
87 %
Equity-based compensation expense included in cost of
revenues
173
168
533
493
Amortization of intangible assets related to acquisition of
businesses
58
59
(34)
177
Total non-GAAP gross profit
$ 25,042
$ 25,219
$ 73,992
$ 68,549
Non-GAAP gross margin
86 %
89 %
87 %
88 %
Three months ended
Nine months ended
September 30,
September 30,
2026
2025
2026
2025
Unaudited
Unaudited
Unaudited
Unaudited
GAAP operating expenses
$ 28,327
$27,076
$84,170
$ 78,827
Equity-based compensation expense included in
research and development expenses
(2,130)
(2,639)
(7,651)
(7,778)
Equity-based compensation expense included in sales
and marketing expenses
(880)
(571)
(2,310)
(1,735)
Equity-based compensation expense included in
general and administrative expenses
(1,809)
(1,495)
(5,041)
(4,092)
Amortization of intangible assets related to acquisition
of businesses
(110)
(149)
(336)
(448)
Acquisition and deal-related costs
(893)
(145)
(1,014)
(433)
Total non-GAAP operating expenses
$ 22,505
$ 22,077
$ 67,818
$ 64,341
CEVA, INC. AND ITS SUBSIDIARIES
INTERIM CONDENSED CONSOLIDATED BALANCE SHEETS
(U.S. dollars in thousands)
September 30,
December 31,
2026
2025 (*)
Unaudited
ASSETS
Current assets:
Cash and cash equivalents
$ 29,608
$ 40,586
Marketable securities and short-term bank deposits
191,072
181,397
Trade receivables, net
17,806
19,495
Unbilled receivables
28,683
29,860
Prepaid expenses and other current assets
14,235
13,498
Total current assets
281,404
284,836
Long-term assets:
Severance pay fund
6,901
7,530
Deferred tax assets, net
303
257
Property and equipment, net
9,161
7,054
Operating lease right-of-use assets
16,727
17,486
Investment in marketable equity securities
127
55
Goodwill
58,308
58,308
Intangible assets, net
532
1,044
Other long-term assets
17,148
11,686
Total assets
$ 390,611
$ 388,256
LIABILITIES AND STOCKHOLDERS’ EQUITY
Current liabilities:
Trade payables
$ 1,243
$ 2,418
Deferred revenues
3,444
3,496
Accrued expenses and other payables
18,378
21,026
Operating lease liabilities
2,797
1,743
Total current liabilities
25,862
28,683
Long-term liabilities:
Accrued severance pay
7,113
7,690
Operating lease liabilities
14,040
14,388
Other accrued liabilities
1,224
1,037
Total liabilities
48,239
51,798
Stockholders’ equity:
Common stock
29
28
Additional paid-in capital
354,941
337,966
Treasury stock
0
(1,591)
Accumulated other comprehensive income (loss)
(2,904)
79
Accumulated deficit
(9,694)
(24)
Total stockholders’ equity
342,372
336,458
Total liabilities and stockholders’ equity
$ 390,611
$ 388,256
(*) Derived from audited financial statements.
The Company believes that the presentation of non-GAAP measures in the press release is useful to investors in analyzing the results for the quarters ended September 30, 2026, and 2025 because the exclusion of the applicable expenses may provide a meaningful analysis of the Company’s core operating results and comparison of quarterly results. Further, the Company believes it is useful for investors to understand how the expenses associated with the application of FASB ASC No. 718 are reflected in its statements of loss. The reconciliation of financial measures should be reviewed in addition to and in conjunction with results presented in accordance with GAAP and is intended to provide additional insight into the Company’s operations that, when viewed with its GAAP results and the accompanying reconciliation, offers a more complete understanding of factors and trends affecting the Company’s business. The reconciliation of financial measures should not be viewed as a substitute for the Company’s reported GAAP results.
A reconciliation of non-GAAP guidance to the corresponding GAAP measures is not available on a forward-looking basis without unreasonable effort due to the uncertainty of expenses that may be incurred in the future, although it is important to note that these factors could be material to the Company’s results computed in accordance with GAAP.
View original content to download multimedia:https://www.prnewswire.com/news-releases/ceva-inc-announces-third-quarter-2026-financial-results-302932918.html
SOURCE Ceva, Inc.
Technology
Quest Global acquires Tests Assured to strengthen advanced wearables engineering and testing capabilities
Published
18 minutes agoon
November 9, 2026By

The acquisition aims to expand Quest Global’s engineering capabilities for wearable products in the high-tech consumer space
BANGALORE, India and WINDSOR, Conn., Nov. 9, 2026 /CNW/ — Quest Global Engineering Services Limited today announced the acquisition of Tests Assured, a US-based company specializing in quality assurance and technology-enabled testing for immersive products, smart devices, wearables, and related hardware and software platforms. With this acquisition, Quest Global aims to strengthen its ability to deliver engineering solutions for wearable products in the high-tech consumer space. Tests Assured brings established expertise in quality assurance and technology-enabled testing and a strong presence among global wearable-device companies, further reinforcing Quest Global’s position as a trusted engineering partner in the wearables industry.
“Wearable technology is becoming more sophisticated by the day, bringing together complex hardware, software, AI and human interaction. Tests Assured brings deep expertise in validating these experiences. It complements our engineering capabilities and strengthens our ability to support customers across the product lifecycle. This acquisition marks an important step in our goal to expand our capabilities and deepens the expertise we bring to customers across the wearable’s ecosystem,” said Ajit Prabhu, Co-Founder and CEO, Quest Global.
“Joining Quest Global represents an exciting new chapter for Tests Assured. We have built our success on technical excellence, strong client relationships, and the dedication of our talented team. By bringing together our expertise in quality assurance and emerging technologies with Quest Global’s global engineering capabilities, we aim to expand our reach, accelerate innovation, and create new opportunities for our employees and customers. I am incredibly proud of what we have accomplished and excited about what we can achieve together,” said Imad Abdelgawad, Founder and CEO, Tests Assured.
Founded in 2018, Tests Assured is headquartered in San Jose, California. Its domain expertise spans AR/VR/XR and smart-glasses testing, biometric validation, human-interaction modeling, computer-vision data collection, consumer software, and AI-enabled devices. Together, Quest Global and Tests Assured will aim to build on their combined strengths to expand solutions for existing customers and pursue new opportunities in the hi-tech and semiconductor industry.
About Quest Global
Quest Global is a global engineering services company that supports customers across a range of industries, including Aerospace & Defense, Automotive, Energy, Hi-Tech, MedTech & Healthcare, Rail and Semiconductor. The company operates in more than 22 countries with 96 delivery centers and more than 23,000 employees worldwide.
For more information, visit https://www.questglobal.com/.
About Tests Assured
Tests Assured is a specialized provider of quality assurance talent and technology-enabled testing services for immersive products, smart devices, wearables, and related hardware and software platforms. Founded in 2018 by Imadeddin “Imad” Abdelgawad, the company is headquartered in San Jose, California and operates from a 23,500 sq. ft. facility supporting QA operations, XR and wearable testing, TA Studios, training, and management. Its delivery footprint includes on-site teams in Burlingame, California, Redmond, Washington, and New York, together with remote delivery from San Jose.
View original content to download multimedia:https://www.prnewswire.com/news-releases/quest-global-acquires-tests-assured-to-strengthen-advanced-wearables-engineering-and-testing-capabilities-302933015.html
SOURCE Quest Global

Atomic Object Selected as Finalist for 2026 NC TECH Awards

Ceva, Inc. Announces Third Quarter 2026 Financial Results

Quest Global acquires Tests Assured to strengthen advanced wearables engineering and testing capabilities

Send Rakhi to UK swiftly with UK Gifts Portal

Whiteboard Series with NEAR | Ep: 45 Joel Thorstensson from ceramic.network

Nullmax and Renesas Forge Strategic Partnership to Deliver Competitive ADAS Solutions for the Global Market

Why You Should Build on #NEAR – Co-founder Illia Polosukhin at CV Labs
Whiteboard Series with NEAR | Ep: 45 Joel Thorstensson from ceramic.network

NEAR End of Year Town Hall 2021: The Open Web World, MetaBUILD 2 Hackathon and 2021 recap
Trending
-

 Technology3 days ago
Diamond Foundry Announces First-Ever D200mm Single-Crystal Diamond
-

 Near Videos4 days ago
Where AI money lands in crypto
-

 Coin Market3 days ago
Crypto exchanges tout cold storage ratios after Binance attack
-

 Technology4 days ago
Finshape launches Agentic DBOS: agentic AI already supporting digital banking projects
-

 Technology4 days ago
OpenAssets and Digital Asset Partner to Modernize Capital Markets Infrastructure
-

 Technology3 days ago
2026 World Internet Conference Wuzhen Summit Opens
-

 Technology4 days ago
When Trade Reaches New Markets, Money Has to Keep Pace
-

 Technology3 days ago
ASTRI Establishes Advisory Board for Smart Mobility Technology Alliance