
Technology
ELBIT SYSTEMS REPORTS SECOND QUARTER 2026 RESULTS

Published
3 months agoon
By

Order backlog at $32.0 billion; Revenues of $2.3 billion; GAAP net income of $173.6 million; Non-GAAP net income of $199.1 million; GAAP net EPS of $3.61; Non-GAAP net EPS of $4.14
HAIFA, Israel, Aug. 11, 2026 /PRNewswire/ — Elbit Systems Ltd. (NASDAQ: ESLT) (TASE: ESLT) (“Elbit Systems” or the “Company”), the international high technology defense company, reported today its consolidated results for the second quarter ended June 30, 2026.
In this release, the Company is providing US-GAAP results as well as Non-GAAP financial data, which are intended to provide investors with a more comprehensive view of the Company’s business results and trends. For a description of the Company’s Non-GAAP definitions see page 11 below, “Non-GAAP financial data”. Unless otherwise stated, all financial data presented is US-GAAP financial data.
Management Comment:
Bezhalel (Butzi) Machlis, President and CEO of Elbit Systems, stated:
“The strong momentum in the second quarter was sustained, delivering double-digit growth in sales, backlog and earnings per share, improved profitability, and strong cash flow generation. Our backlog reached a new record of $32 billion, providing long-term visibility and demonstrating the continued confidence of customers worldwide in Elbit Systems’ technologies and capabilities.
Elbit Systems continues to invest in R&D to secure our future growth. Our increased capital investments in production infrastructure reflect a disciplined approach to scaling the business, enhancing execution, increasing capacity, and supporting our ability to deliver at scale, while converting backlog into sustainable revenue and earnings growth.
Elbit Systems is leading the development of next-generation high power laser and directed energy capabilities. Most recently, we unveiled our airborne high-power laser system, currently under development for helicopters and fighter aircraft. This new capability builds on decades of technological and operational experience and will further expand Elbit Systems’ broad portfolio of systems, supporting customers and helping protect nations and critical assets around the world.”
Second quarter 2026 results:
Revenues in the second quarter of 2026 were $2,287.1 million, as compared to $1,972.7 million in the second quarter of 2025.
C4I and Cyber revenues increased by 11% in the second quarter of 2026, as compared to the second quarter of 2025, mainly due to the increase in radio systems and command and control systems sales in Europe. ISTAR and EW revenues increased by 22% in the second quarter of 2026, as compared to the second quarter of 2025, mainly due to increased sales of airborne and land High Power Laser, Electronic Warfare and Maritime systems in Asia-Pacific. Land revenues increased by 32% in the second quarter of 2026, as compared to the second quarter of 2025, mainly due to ammunition and munition sales in Israel. Elbit systems of America revenues increased by 17% in the second quarter of 2026, as compared to the second quarter of 2025, mainly due to a one-time favorable project mix and the increase in sales of Night-Vision Systems, Maritime systems and Electronic systems. Aerospace revenues decreased by 8% in the second quarter of 2026, as compared to the second quarter of 2025, mainly due to a one-time unfavorable project mix and decreased sales of training and simulation systems in Europe partially offset by the increase in UAV sales in Israel.
For distribution of revenues by segments and geographic regions see the tables on page 10.
GAAP gross profit in the second quarter of 2026 was $579.0 million (25.3% of revenues), as compared to $472.9 million (24.0% of revenues) in the second quarter of 2025. Non-GAAP(*) gross profit amounted to $586.5 million (25.6% of revenues) in the second quarter of 2026, as compared to $480.4 million (24.4% of revenues) in the second quarter of 2025.
Research and development expenses, net were $159.1 million (7.0% of revenues) in the second quarter of 2026, as compared to $129.7 million (6.6% of revenues) in the second quarter of 2025.
Marketing and selling expenses, net were $103.2 million (4.5% of revenues) in the second quarter of 2026, as compared to $91.5 million (4.6% of revenues) in the second quarter of 2025.
General and administrative expenses, net were $97.9 million (4.3% of revenues) in the second quarter of 2026, as compared to $93.9 million (4.8% of revenues) in the second quarter of 2025.
GAAP operating income in the second quarter of 2026 was $218.8 million (9.6% of revenues), as compared to $157.8 million (8.0% of revenues) in the second quarter of 2025. Non-GAAP(*) operating income was $237.5 million (10.4% of revenues) in the second quarter of 2026, as compared to $175.1 million (8.9% of revenues) in the second quarter of 2025.
Financial expenses, net were $22.0 million in the second quarter of 2026, as compared to $31.2 million in the second quarter of 2025. The decrease in financial expenses, net in the second quarter of 2026 was mainly due to a reduction in the average debt.
Taxes on income were $32.7 million (effective tax rate of 16.4%) in the second quarter of 2026, as compared to $7.1 million (effective tax rate of 5.6%) in the second quarter of 2025. The higher tax expense in the second quarter of 2026 was mainly driven by the implementation of the OECD Pillar II global minimum tax rules.
* see page 11
GAAP net income attributable to the Company’s shareholders in the second quarter of 2026 was $173.6 million (7.6% of revenues), as compared to $125.7 million (6.4% of revenues) in the second quarter of 2025. The increase in net income attributable to the Company’s shareholders in the second quarter of 2026 was in line with the increase in the Company’s activity. Non-GAAP(*) net income attributable to the Company’s shareholders in the second quarter of 2026 was $199.1 million (8.7% of revenues), as compared to $151.0 million (7.7% of revenues) in the second quarter of 2025.
GAAP diluted earnings per share attributable to the Company’s shareholders in the second quarter of 2026 were $3.61, as compared to $2.69 in the second quarter of 2025. Non-GAAP(*) diluted net earnings per share attributable to the Company’s shareholders were $4.14 for the second quarter of 2026, as compared to $3.23 for the second quarter of 2025.
The Company’s order backlog as of June 30, 2026 totaled $32.0 billion. The increase in backlog during the quarter came mainly from Europe. Approximately 73% of the current backlog is attributable to orders outside of Israel. Approximately 42% of the order backlog is scheduled to be performed during the remainder of 2026 and 2027.
Cash flow provided by operating activities in the six months ended June 30, 2026 was $517.8 million, as compared to cash flow provided by operating activities of $304.0 million in the six months ended June 30, of 2025. The cash flow in the second quarter of 2026 was affected mainly by the strong increase in net income and an increase in contract liabilities.
* see page 11
Impact of the recent conflicts in the Middle East on the Company:
The war which began on October 7, 2023, continued throughout most of 2025, with ceasefires agreed to between Israel and Lebanon involving the conflict with Hezbollah in November 2024, and, after an intensified period of conflict that lasted 12 days, a ceasefire was declared with Iran in June 2025. A ceasefire with Hamas was agreed to in January 2025, and a subsequent ceasefire with Hamas was agreed to in October 2025. On February 28, 2026, the U.S. and Israel launched a joint attack on Iran named “Operation Epic Fury” by the U.S., and “Operation Roaring Lion” by Israel, targeting key Iranian officials and targets. Iran launched attacks against Israel and at U.S. military bases across the region, including strikes in Bahrain, Qatar, Saudi Arabia, the United Arab Emirates, Kuwait and Jordan. On March 2, 2026 Hezbollah launched an attack on Israel. After an intensified period of conflict that lasted 40 days, a two-week ceasefire between the United States and Iran, which was subsequently extended, took effect on April 8, 2026, and a separate ten–day cessation of hostilities between Israel and Lebanon, which was subsequently extended, began on April 16, 2026. On June 18, 2026, the U.S. and Iran signed a Memorandum of Understanding at Versailles providing for, among other things, the reopening of the Strait of Hormuz and a 60-day period for further negotiations. On June 26, 2026, a trilateral ceasefire agreement was signed between Israel, the U.S. and Lebanon. In early July 2026, the U.S.-Iran MOU collapsed following Iranian attacks on merchant ships attempting to transit the Strait of Hormuz and subsequent U.S. strikes on Iranian targets; as of the date of this filing, hostilities between the U.S. and Iran have resumed. The current situation remains uncertain, including in light of violations of the ceasefire arrangements since they began.
Since the commencement of the war and the escalation of conflicts in the Middle East, Elbit Systems has experienced a continued material increase in the demand for its products and solutions from the Israel Ministry of Defense (IMOD) compared to the demand levels prior to the war. Such increased demand may continue and could generate material additional orders to the Company.
As a result of the war and the other conflicts in the Middle East, some of Elbit Systems’ operations have experienced disruptions due to supply chain and operational constraints, including among others increases in transportation costs and delays due to factors such as the Houthi movement attacks on shipping in the Red Sea, material and component shortages and elevated prices, employee call-ups for reserve duty, limitations imposed by some countries on engagement with Israel and attacks on some of Elbit Systems’ global facilities by anti-Israeli organizations.
Elbit Systems has taken various steps to protect its employees worldwide, to support increased production, to increase raw material and component inventories, to mitigate supply chain disruptions and to maintain business continuity. Following the ceasefire agreements described above, these operational effects on the Company have been reduced, however, such effects on the Company’s performance could increase again, depending on future developments that are difficult to predict at this time, including the duration and scope of these conflicts and the continuity and stability of the ceasefire arrangements.
The Law for the Encouragement and Incentivization of Research and Development:
On March 31, 2026, the Knesset enacted the Law for the Encouragement and Incentivization of Research and Development 5786-2026 (the “R&D Law”). The R&D Law applies to qualifying R&D expenditures incurred at the beginning of the tax year starting January 1, 2026. The Company implemented the new R&D Law for the first time and recognized a cumulative year-to-date impact of approximately $40 million.
Recent Events:
On May 28, 2026, the Company announced that it was awarded a contract valued at approximately $350 million from an international customer to deliver upgrades for Main Battle Tanks (MBTs). The program includes the integration of advanced Fire Control Systems, Electric Gun & Turret Drive Systems, Communication and Situational Awareness solutions, as well as Mid Life Upgrade package. The contract will be performed over a period of four years.
On July 20, 2026, the Company announced that its U.S. subsidiary, Elbit Systems of America, LLC, has received multiple awards from U.S. Customs and Border Protection totaling over $370 million to enhance U.S. national security, with work to be performed through May 2029.
On August 6, 2026, the Company announced that at its Annual General Meeting of Shareholders held on August 5, 2026 at the Company’s offices in Haifa, the proposed resolutions described in the Proxy Statement to the Shareholders dated July 1, 2026 were approved by the required majority.
Dividend:
The Board of Directors declared a dividend of $1.00 per share. The dividend’s record date is October 13, 2026. The dividend will be paid on October 26, 2026, after deduction of withholding tax, at the rate of 16.8%.
Conference Call:
The Company will be hosting a conference call today, Tuesday, August 11, 2026, at 9:00 a.m. Eastern Time. On the call, management will review and discuss the results and will be available to answer questions.
To participate, please call one of the teleconferencing numbers that follow. If you are unable to connect using the toll-free numbers, please try the international dial-in number.
US Dial-in Number: 1-866-744-5399
Canada Dial-in Number: 1-866-485-2399
Israel Dial-in Number: 03-918-0644
International Dial-in Number: 972-3-918-0644
at 9:00 am Eastern Time; 6:00 am Pacific Time; 4:00 pm Israel Time
The conference call will also be broadcast live on Elbit Systems’ website at https://www.elbitsystems.com. An online replay will be available from 24 hours after the call ends.
Alternatively, for two days following the call, investors will be able to dial a replay number to listen to the call. The dial-in numbers are: 1-888-782-4291 (US and Canada) or +972-3-925-5900 (Israel and International).
About Elbit Systems:
Elbit Systems is a leading global defense technology company, delivering advanced solutions for a secure and safer world. Elbit Systems develops, manufactures, integrates and sustains a range of next-generation solutions across multiple domains.
Driven by its agile, collaborative culture, and leveraging Israel’s technology ecosystem, Elbit Systems enables customers to address rapidly evolving battlefield challenges and overcome threats.
Elbit Systems employs over 21,000 people in dozens of countries across five continents. The Company reported $2,287.1 million in revenues for the three months ended June 30, 2026 and an order backlog of $32.0 billion as of such date.
For additional information, visit: https://elbitsystems.com/, follow us on X or visit our official Facebook, Youtube and LinkedIn channels.
Attachments:
Consolidated balance sheets
Consolidated statements of income
Consolidated statements of cash flows
Consolidated revenue distribution by geographical regions and by segments
Company Contact:
Dr. Yaacov (Kobi) Kagan, EVP & Chief Financial Officer
Tel: +972-77-2946663
Daniella Finn, VP, Investor Relations
Tel: +972-77-2948984
daniella.finn@elbitsystems.com
Dalia Bodinger, VP, Communications & Brand
Tel: +972-77-2947602
This press release may contain forward–looking statements (within the meaning of Section 27A of the Securities Act of 1933, as amended, Section 21E of the Securities Exchange Act of 1934, as amended, and the Israeli Securities Law, 1968) regarding Elbit Systems Ltd. and/or its subsidiaries (collectively the Company), to the extent such statements do not relate to historical or current facts. Forward-looking statements are based on management’s current expectations, estimates, projections and assumptions about future events. Forward–looking statements are made pursuant to the safe harbor provisions of the Private Securities Litigation Reform Act of 1995, as amended. These statements are not guarantees of future performance and involve certain risks, uncertainties and assumptions about the Company, which are difficult to predict, including projections of the Company’s future financial results, its anticipated growth strategies and anticipated trends in its business. Therefore, actual future results, performance and trends may differ materially from these forward–looking statements due to a variety of factors, including, without limitation: scope and length of customer contracts; governmental regulations and approvals; changes in governmental budgeting priorities; general market, political and economic conditions in the countries in which the Company operates or sells, including Israel and the United States among others; including the duration and scope of the war in Israel, and the potential impact on our operations; changes in global health and macro-economic conditions; differences in anticipated and actual program performance, including the ability to perform under long-term fixed-price contracts; changes in the competitive environment; and the outcome of legal and/or regulatory proceedings. The factors listed above are not all-inclusive, and further information is contained in Elbit Systems Ltd.’s latest annual report on Form 20-F, which is on file with the U.S. Securities and Exchange Commission. All forward–looking statements speak only as of the date of this press release.
Although the Company believes the expectations reflected in the forward-looking statements contained herein are reasonable, it cannot guarantee future results, level of activity, performance or achievements. Moreover, neither the Company nor any other person assumes responsibility for the accuracy and completeness of any of these forward-looking statements. The Company does not undertake to update its forward-looking statements.
Elbit Systems Ltd., its logo, brand, product, service and process names appearing in this press release are the trademarks or service marks of Elbit Systems Ltd. or its affiliated companies. All other brand, product, service and process names appearing are the trademarks of their respective holders. Reference to or use of a product, service or process other than those of Elbit Systems Ltd. does not imply recommendation, approval, affiliation or sponsorship of that product, service or process by Elbit Systems Ltd. Nothing contained herein shall be construed as conferring by implication, estoppel or otherwise any license or right under any patent, copyright, trademark or other intellectual property right of Elbit Systems Ltd. or any third party, except as expressly granted herein.
(FINANCIAL TABLES TO FOLLOW)
ELBIT SYSTEMS LTD.
CONSOLIDATED BALANCE SHEETS
(US Dollars in thousands)
As of
June 30, 2026
As of
December 31, 2025
Assets
Cash and cash equivalents
$ 255,336
$ 635,141
Short-term bank deposits
707,599
180,604
Trade and unbilled receivables and contract assets, net
4,166,677
3,332,249
Other receivables and prepaid expenses
498,916
457,385
Inventories, net
3,236,994
3,129,756
Total current assets
8,865,522
7,735,135
Investments in affiliated companies and other companies
134,226
126,900
Long-term trade and unbilled receivables and contract assets
562,316
719,078
Long-term bank deposits and other receivables
144,861
51,601
Deferred income taxes, net
92,512
86,679
Severance pay fund
237,093
222,555
Total
1,171,008
1,206,813
Operating lease right of use assets
500,534
515,620
Property, plant and equipment, net
1,461,412
1,382,120
Goodwill and other intangible assets, net
1,860,172
1,821,830
Total assets
$ 13,858,648
$ 12,661,518
Liabilities and Equity
Short-term bank credit and loans
$ —
$ 50,532
Current maturities of long-term loans and Series B, C and D Notes
87,534
83,452
Operating lease liabilities
96,959
98,464
Trade payables
1,688,040
1,511,671
Other payables and accrued expenses
1,690,200
1,549,139
Contract liabilities
2,793,121
2,683,180
Total current liabilities
6,355,854
5,976,438
Long-term loans, net of current maturities
4,592
18,000
Series B, C and D Notes, net of current maturities
175,384
237,625
Employee benefit liabilities
513,699
487,760
Deferred income taxes and tax liabilities, net
150,648
137,662
Contract liabilities
1,523,198
934,256
Operating lease liabilities
487,768
476,737
Other long-term liabilities
237,487
263,067
Total long-term liabilities
3,092,776
2,555,107
Elbit Systems Ltd.’s equity
4,409,667
4,129,598
Non-controlling interests
351
375
Total equity
4,410,018
4,129,973
Total liabilities and equity
$ 13,858,648
$ 12,661,518
ELBIT SYSTEMS LTD.
CONSOLIDATED STATEMENTS OF INCOME
(US Dollars in thousands, except for share and per share amounts)
Six months
ended June 30,
2026
Six months
ended June 30,
2025
Three months
ended June 30,
2026
Three months
ended June 30,
2025
Year ended
December 31,
2025
Revenues
$ 4,475,904
$ 3,868,460
$ 2,287,058
$ 1,972,659
$ 7,938,627
Cost of revenues
3,344,838
2,941,240
1,708,051
1,499,748
6,003,374
Gross profit
1,131,066
927,220
579,007
472,911
1,935,253
Operating expenses:
Research and development, net
309,510
243,937
159,124
129,668
517,142
Marketing and selling, net
204,062
192,410
103,202
91,528
399,437
General and administrative, net
193,570
183,347
97,887
93,898
347,250
Total operating expenses
707,142
619,694
360,213
315,094
1,263,829
Operating income
423,924
307,526
218,794
157,817
671,424
Financial expenses, net
(54,234)
(70,128)
(22,046)
(31,171)
(138,618)
Other income (expenses), net
3,963
3,603
2,245
(1,343)
29,109
Income before income taxes
373,653
241,001
198,993
125,303
561,915
Taxes on income
(55,473)
(23,118)
(32,708)
(7,057)
(55,539)
318,180
217,883
166,285
118,246
506,376
Equity in net earnings of affiliated companies
16,200
15,509
7,240
7,776
29,243
Net income
$ 334,380
$ 233,392
$ 173,525
$ 126,022
$ 535,619
Less: net expense (income) attributable
to non-controlling interests
44
(608)
108
(323)
(1,280)
Net income attributable to Elbit Systems Ltd.’s shareholders
$ 334,424
$ 232,784
$ 173,633
$ 125,699
$ 534,339
Earnings per share attributable to Elbit Systems Ltd.’s shareholders:
Basic net earnings per share
$ 7.17
$ 5.17
$ 3.71
$ 2.76
$ 11.69
Diluted net earnings per share
$ 6.95
$ 5.05
$ 3.61
$ 2.69
$ 11.39
Weighted average number of shares used in computation of:
Basic earnings per share (in thousands)
46,622
45,052
46,766
45,513
45,710
Diluted earnings per share (in thousands)
48,124
46,122
48,124
46,697
46,918
ELBIT SYSTEMS LTD.
CONSOLIDATED STATEMENTS OF CASH FLOW
(US Dollars in thousands)
Six months
ended June
30, 2026
Six months
ended June
30, 2025
Year ended
December
31, 2025
CASH FLOWS FROM OPERATING ACTIVITIES
Net income
$ 334,380
$ 233,392
$ 535,619
Adjustments to reconcile net income to net cash provided by operating activities:
Depreciation and amortization
93,532
85,255
171,434
Stock-based compensation
14,567
11,496
26,391
Amortization of Series B, C and D related issuance costs, net
173
393
394
Deferred income taxes and reserve, net
(1,856)
(14,751)
(14,687)
Loss on sale of property, plant and equipment
1,354
1,727
2,893
Loss (gain) on sale of investment, remeasurement of investment held under fair value
method
—
6,954
(4,518)
Equity in net earnings of affiliated companies, net of dividend received(*)
(6,570)
(6,608)
(10,190)
Changes in operating assets and liabilities, net of amounts acquired:
Increase in trade and unbilled receivables and prepaid expenses
(813,298)
(358,217)
(659,951)
Increase in inventories, net
(107,042)
(171,708)
(357,926)
Increase in trade payables, other payables and accrued expenses
312,916
348,910
463,913
Severance, pension and termination indemnities, net
(9,170)
(9,598)
(26,328)
Increase in contract liabilities
698,796
176,725
651,334
Net cash provided by operating activities
517,782
303,970
778,378
CASH FLOWS FROM INVESTING ACTIVITIES
Purchase of property, plant and equipment and other assets, net of investment grants and
evacuation grants
(157,557)
(72,474)
(225,568)
Acquisition of subsidiaries, net of cash assumed
(33,738)
—
—
Investments in affiliated companies and other companies, net
(1,917)
(100)
(2,288)
Proceeds from sale of property, plant and equipment
1,288
458
1,133
Proceeds from sale of investments
2,100
—
15,000
Proceeds from sale of (investment in) long-term deposits, net
941
159
(31)
Investment in short-term deposits, net
(502,601)
(738,401)
(178,962)
Net cash used in investing activities
(691,484)
(810,358)
(390,716)
CASH FLOWS FROM FINANCING ACTIVITIES
Proceeds from issuance of shares and exercise of options
136
573,000
573,064
Repayment of commercial paper
(48,409)
(95,036)
(301,591)
Repayment of long-term bank loans
(12,905)
(11,355)
(11,423)
Proceeds from non-controlling interests, net
15,749
—
—
Repayment of Series B, C and D Notes
(74,967)
(67,738)
(67,496)
Dividends paid
(81,771)
(49,103)
(111,693)
Change in short-term bank credit and loans and other, net
(3,936)
381
(98,733)
Net cash provided by (used in) financing activities
(206,103)
350,149
(17,872)
Net increase (decrease) in cash and cash equivalents
(379,805)
(156,239)
369,790
CASH AND CASH EQUIVALENTS AT THE BEGINNING OF THE PERIOD
$ 635,141
$ 265,351
$ 265,351
CASH AND CASH EQUIVALENTS AT THE END OF THE PERIOD
$ 255,336
$ 109,112
$ 635,141
(*) Dividend received from affiliated companies
$ 9,630
$ 8,901
$ 19,053
ELBIT SYSTEMS LTD.
DISTRIBUTION OF REVENUES
(US Dollars in millions)
Consolidated revenues by geographical regions:
Six months
ended June
30, 2026
%
Six months
ended June
30, 2025
%
Three
months
ended June
30, 2026
%
Three
months
ended June
30, 2025
%
Year ended
December
31, 2025
%
Israel
$ 1,672.9
37.4
$ 1,279.6
33.1
$ 855.0
37.4
$ 670.5
34.0
$ 2,556.4
32.2
North America
898.4
20.1
797.8
20.6
464.7
20.3
404.6
20.5
1,659.3
20.9
Europe
1,075.6
24.0
1,020.6
26.4
563.3
24.6
563.8
28.6
2,139.5
27.0
Asia-Pacific
661.7
14.8
605.1
15.6
319.9
14.0
261.9
13.3
1,243.7
15.7
Latin America
70.2
1.6
50.7
1.3
37.2
1.6
22.6
1.1
99.0
1.2
Other countries
97.1
2.1
114.7
3.0
47.0
2.1
49.3
2.5
240.7
3.0
Total revenue
$ 4,475.9
100.0
$ 3,868.5
100.0
$ 2,287.1
100.0
$ 1,972.7
100.0
$ 7,938.6
100.0
Consolidated revenues by segments:
Six months
ended June 30,
2026
Six months
ended June 30,
2025
Three months
ended June 30,
2026
Three months
ended June 30,
2025
Year ended
December 31,
2025
Aerospace
External customers
$ 877.5
$ 922.2
$ 422.7
$ 474.2
$ 1,820.9
Intersegment revenue
134.1
118.9
72.3
62.6
246.1
Total
1,011.6
1,041.1
495.0
536.8
2,067.0
C4I and Cyber
External customers
483.2
417.2
241.1
213.0
866.2
Intersegment revenue
26.4
29.6
11.8
13.8
64.7
Total
509.6
446.8
252.9
226.8
930.9
ISTAR and EW
External customers
773.9
614.6
$ 402.1
311.1
1,323.5
Intersegment revenue
96.9
113.9
45.7
56.4
202.3
Total
870.8
728.5
447.8
367.5
1,525.8
Land
External customers
1,448.5
1,106.0
749.5
566.8
2,250.3
Intersegment revenue
36.4
37.9
20.7
16.3
68.4
Total
1,484.9
1,143.9
770.2
583.1
2,318.7
ESA
External customers
892.8
808.5
471.7
407.6
1,677.7
Intersegment revenue
7.9
4.9
5.1
1.6
16.4
Total
900.7
813.4
476.8
409.2
1,694.1
Revenues
Total revenues (external
customers and intersegment) for
reportable segments
4,777.6
4,173.7
2,442.7
2,123.4
8,536.5
Less – intersegment revenue
(301.7)
(305.2)
(155.6)
(150.7)
(597.9)
Total revenues
$ 4,475.9
$ 3,868.5
$ 2,287.1
$ 1,972.7
$ 7,938.6
Non-GAAP financial data:
The following Non-GAAP financial data, including Non-GAAP gross profit, Non-GAAP operating income, Non-GAAP net income attributable to the Company’s shareholders, and Adjusted diluted earnings per share, is presented to enable investors to have additional information on our business performance as well as a further basis for periodical comparisons and trends relating to our financial results. We believe such data provides useful information to investors and analysts by facilitating more meaningful comparisons of our financial results over time. The Non-GAAP adjustments exclude amortization expenses of intangible assets related to acquisitions that occurred mainly in prior periods, capital gains related primarily to the sale of investments, restructuring activities, Non-identified costs in respect to special circumstances, non-cash stock based compensation expenses, revaluations of investments in affiliated companies, non-operating foreign exchange gains or losses, one-time tax expenses, and the effect of tax on each of these items. We present these Non-GAAP financial measures because management believes they supplement and/or enhance management’s, analysts’ and investors’ overall understanding of the Company’s underlying financial performance and trends and facilitate comparisons among current, past, and future periods.
Specifically, management uses Non-GAAP gross profit, Non-GAAP operating income, and Non-GAAP net income attributable to the Company’s shareholders to measure the ongoing gross profit, operating profit and net income performance of the Company because the measure adjusts for more significant non-recurring items, amortization expenses of intangible assets relating to prior acquisitions, and non-cash expense which can fluctuate year to year.
We believe Non-GAAP gross profit, Non-GAAP operating income, and Non-GAAP net income attributable to the Company’s shareholders are useful to existing shareholders, potential shareholders and other users of our financial information because they provide measures of the Company’s ongoing performance that enable these users to perform trend analysis using comparable data.
Management uses Non-GAAP diluted net earnings per share attributed to Company’s shareholders to evaluate further adjusted net income attributable to the Company’s shareholders while considering changes in the number of diluted shares over comparable periods.
We believe Non-GAAP diluted net earnings per share attributable to Company’s shareholders is useful to existing shareholders, potential shareholders and other users of our financial information because it also enables these users to evaluate adjusted net income attributable to Company’s shareholders on a per-share basis.
The Non-GAAP measures used by the Company are not based on any comprehensive set of accounting rules or principles. We believe that Non-GAAP measures have limitations in that they do not reflect all of the amounts associated with our results of operations, as determined in accordance with GAAP, and that these measures should only be used to evaluate our results of operations in conjunction with the corresponding GAAP measures.
Investors are cautioned that, unlike financial measures prepared in accordance with GAAP, Non-GAAP measures may not be comparable with the calculation of similar measures for other companies. They should consider Non-GAAP financial measures in addition to, and not as replacements for or superior to, measures of financial performance prepared in accordance with GAAP.
Reconciliation of GAAP to Non-GAAP Supplemental Financial Data:
(US Dollars in millions, except for per share amounts)
Six months
ended June
30, 2026
Six months
ended June
30, 2025
Three
months
ended
June 30,
2026
Three
months
ended
June 30,
2025
Year ended
December
31, 2025
GAAP gross profit
$ 1,131.1
$ 927.2
$ 579.0
$ 472.9
$ 1,935.3
Adjustments:
Amortization of purchased intangible assets(*)
7.8
8.0
3.9
4.0
16.2
Stock based compensation
2.2
1.7
1.2
0.9
4.0
Non-identified costs in respect to special
circumstances
4.1
4.0
2.4
2.6
6.3
Non-GAAP gross profit
$ 1,145.2
$ 940.9
$ 586.5
$ 480.4
$ 1,961.8
Percent of revenues
25.6 %
24.3 %
25.6 %
24.4 %
24.7 %
GAAP operating income
$ 423.9
$ 307.5
$ 218.8
$ 157.8
$ 671.4
Adjustments:
Amortization of purchased intangible assets(*)
15.1
15.5
7.6
7.7
31.0
Stock based compensation
14.6
11.5
7.7
5.8
26.4
Non-identified costs in respect to special
circumstances
5.9
5.8
3.4
3.8
9.0
Non-GAAP operating income
$ 459.5
$ 340.3
$ 237.5
$ 175.1
$ 737.8
Percent of revenues
10.3 %
8.8 %
10.4 %
8.9 %
9.3 %
GAAP net income attributable to Elbit Systems’
shareholders
334.4
232.8
173.6
125.7
534.3
Adjustments:
Amortization of purchased intangible assets(*)
15.1
15.5
7.6
7.7
31.0
Stock based compensation
14.6
11.5
7.7
5.8
26.4
Non-identified costs in respect to special
circumstances
5.9
5.8
3.4
3.8
9.0
Capital gain
—
—
—
—
(13.7)
Revaluation of investment measured under fair
value option
—
6.8
—
6.8
(4.5)
Non-operating foreign exchange (gains) losses
7.4
(1.5)
(1.3)
2.6
18.5
Tax effect and other tax items, net
8.2
(2.7)
8.1
(1.4)
(3.0)
Non-GAAP net income attributable to Elbit
Systems’ shareholders
$ 385.6
$ 268.2
$ 199.1
$ 151.0
$ 598.0
Percent of revenues
8.6 %
6.9 %
8.7 %
7.7 %
7.5 %
GAAP diluted net EPS attributable to Elbit
Systems’ shareholders
$ 6.95
$ 5.05
$ 3.61
$ 2.69
$ 11.39
Adjustments, net
1.06
0.76
0.53
0.54
1.36
Non-GAAP diluted net EPS attributable to Elbit
Systems’ shareholders
$ 8.01
$ 5.81
$ 4.14
$ 3.23
$ 12.75
(*) While amortization of acquired intangible assets is excluded from the measures, the revenue of the acquired companies is reflected in the measures and the acquired assets contribute to revenue generation.
View original content to download multimedia:https://www.prnewswire.com/news-releases/elbit-systems-reports-second-quarter-2026-results-302848083.html
SOURCE Elbit Systems Ltd.

You may like
Technology
DentScribe Launches Perio Charting Benchmark and Reports 100% Across All Eight Levels
Published
44 minutes agoon
November 10, 2026By
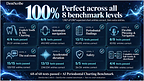
DentScribe 2.165.0 passed 68 of 68 tests with 1,967 of 1,967 expected entries correct and zero extra entries in the company’s text-to-chart evaluation.
SUNNYVALE, Calif., Nov. 10, 2026 /PRNewswire/ — DentScribe today announced its AI Periodontal Charting Benchmark 1.0 and accompanying performance report, giving dental practices and dental service organizations a practical framework for evaluating AI perio charting. Developed by DentScribe working with teams of dentists, dental hygienists, and dental assistants, the benchmark combines a written charting standard, 68 test scripts, expected charts, and a score card.
In its November 2026 results report, DentScribe reported that it passed all 68 tests across eight levels and handled all 24 tested dictation styles perfectly. All 1,967 expected chart entries were correct, with no extra entries. The results evaluate how the engine converts supplied text into chart entries.
“A hygienist should be able to concentrate on the patient and the probe, not on remembering how a computer wants the findings dictated. We worked with dental teams to make those expectations testable, down to the tooth, site, and reading,” said Dr. Vinni K. Singh, DDS, AFAAID, Founder and CEO of DentScribe.
A Standard for the Chart and a Benchmark for the Software
The charting standard defines the expected interpretation: Universal tooth numbering, six sites per tooth, reading order as the probe travels around the mouth, and rules for missing teeth, corrections, findings, and scope. The benchmark then tests whether software follows those rules. An entry counts as correct only when the value or finding belongs to the right tooth and site. A test passes only when every expected entry is correct and nothing extra appears.
The eight levels progress from individual readings to complete examinations:
Explicit Tooth & Site Charting — Correct placement of named readings, including two-digit pocket depths.Automatic Navigation — Numbers-only dictation, midline direction changes, arch transitions, and missing teeth.Periodontal Findings — Bleeding, suppuration, recession, mucogingival junction measurements, and mobility.Flexible Phrasing & Navigation — Different word orders, findings during probing, jumps, and restatements.The Real Room — Filler words, patient conversation, corrections, and returning to or resuming probing.Accelerated Dictation — Shorthand, scope words, tooth lists, and ranges.Safety — Missing teeth receive no readings, incomplete readings stay incomplete, and findings do not spread to unmentioned sites.Complete Exams: Full Words & Shorthand — Two complete examinations, each expressed both ways, must produce matching charts.
Performance Beyond the Clean Scripts
DentScribe also passed all 13 additional noisy-room text versions, with 471 of 471 expected entries correct and zero extra entries. These scripts contain simulated speech-recognition mishearings; they are not a live suction-noise or microphone study. Across all 81 clean and noisy scripts, eight runs per script produced identical charts.
Both full-word and shorthand versions of each complete exam produced the same expected chart. For the second exam, shorthand reduced the script from 397 words to 210, about 47% fewer words. This measures script length, not demonstrated chairside time savings.
“Accurate transcription is only the beginning. Perio charting must preserve location and context while the clinician changes direction, corrects a reading, or adds a finding on another tooth. Publishing the scripts and expected charts lets customers inspect those behaviors themselves,” said Dr. Ratinder Paul Singh Ahuja, Ph.D., Board Chair of DentScribe.
The benchmark suite reflects styles supported by DentScribe
Evaluate the Charting System in Your Practice
The kit provides read-aloud scripts, expected charts, and a score card. Practices can use the same reader, room, and microphone, score the first attempt, and count extra entries separately. The kit and performance report are available from DentScribe.
Book a benchmark demonstration: https://www.dentscribe.ai/book-a-demo
About DentScribe
DentScribe is an AI platform for dental documentation and practice intelligence. Founded by practicing dentist Dr. Vinni K. Singh, it combines dental SOAP notes and voice perio charting with DentScribe CoPilot, DentScribe GPS (Guided Production System), after-care summaries, specialist reports, and treatment coordinator notes. Its practice management integrations include Dentrix, Open Dental, and Eaglesoft. DentScribe helps teams complete documentation and act on information already present in the clinical record.
Media Contact
DentScribe Communications
hello@dentscribe.ai | +1 650 446 6161
710 Lakeway Drive, Suite 200, Sunnyvale, CA 94085
View original content to download multimedia:https://www.prnewswire.com/news-releases/dentscribe-launches-perio-charting-benchmark-and-reports-100-across-all-eight-levels-302934348.html
SOURCE DentScribe
Technology
CURE International completes electronic medical records rollout across its eight children’s hospitals with Thoughtworks
Published
44 minutes agoon
November 10, 2026By

BENGALURU, India, Nov. 10, 2026 /PRNewswire/ — Thoughtworks, a global technology consultancy integrating design, engineering and AI to drive digital innovation, worked with CURE International (CURE), a global non-profit, to move clinical records at all their pediatric hospitals from paper to a modern electronic medical records (EMR) system. CURE provides surgical care at no cost to children with treatable disabilities and their hospitals, seven across Africa and one in the Philippines, now run on Bahmni, an open-source hospital management system incubated by Thoughtworks for low-resource settings.
Much of the clinical work in CURE’s hospitals used to run on paper, with notes written by hand, carried between departments and re-entered later. Each hospital also has its own specialties, infrastructure and staffing.
Thoughtworks worked with the non-profit to modernize and standardize their systems to digitally document all their patient clinical care journeys. The partners customized and deployed Bahmni across CURE’s network.
The latest rollout builds on a partnership that began in 2023, when CURE first engaged Thoughtworks to digitize care in its children’s hospitals. Thoughtworks’ Managed Services team continues to run deployments and day-to-day operations across the network.
“Taking eight hospitals from paper to digital without interrupting care is a monumental challenge,” said Kevin de Smidt, Chief Technology Officer at CURE International. “The Thoughtworks team learned how our clinicians actually work, allowing us to roll out a system that lets our teams spend less time chasing paperwork and more time focused on providing world-class surgical care to the children we serve. Because we built this on Bahmni, these EMR enhancements are going back into the open-source project, ensuring the next low-resource hospital starts further ahead than we did.”
To give clinicians reliable digital tools in every hospital, the work focused on four priority areas:
Safer clinical care: Adding high-visibility alerts for allergies and the need for blood crossmatching, supervisor approval for changes to medication records, dosing guidance linked to each child’s weight and a new variable dose protocol.Less administrative work on the ward: Introducing electronic drug charts, automated nursing tasks and ward-level inpatient dashboards. A routine medication round now takes three clicks instead of seven.Better use of operating theaters: Tracking each patient’s surgical readiness in real time and suggesting a replacement patient when a scheduled surgery can’t go ahead.Reliable operations without disrupting care: Upgrading the platform that helped deployments reach each site 60% faster and causing 45% less disruption to patient services.
“Executing a multi-region clinical rollout across eight global hospitals demands absolute operational resilience,” said Steve Obana, Senior Vice President – Life Sciences & MedTech at Thoughtworks. “Healthcare platforms operating in these environments cannot afford downtime or instability. Our team approached this with rigorous engineering discipline and we are proud to provide the managed services backbone and technical stability that allows CURE’s medical teams to scale their life-changing work with absolute confidence in their systems.”
CURE has extended its managed services support with Thoughtworks for a further year, covering platform upgrades, stability and operations across all eight hospitals.
Features built for CURE, including inpatient care and monitoring and a digital medication administration record, are being contributed back to the core Bahmni project. This makes them available to other hospitals deploying the platform in low-resource settings.
By combining its experience building Bahmni with managed services operations, Thoughtworks is helping CURE International deliver technology that works where it matters most: giving clinicians reliable tools and information to provide safe, effective care for every child.
Supporting resources:
Read the CURE International client story.Learn more about Bahmni.Explore Thoughtworks’ work in healthcare and managed services.Follow Thoughtworks on X, LinkedIn, and YouTube.
About CURE International
CURE International is a Christian nonprofit organization operating a global network of eight children’s hospitals that offer no-cost surgical interventions for children living with treatable disabilities. CURE hospitals provide life-changing care for children suffering from conditions such as cleft lip/palate, neglected clubfoot, bowed legs, burn contractures, spina bifida, brain tumors, and hydrocephalus. In addition to world-class clinical service, CURE ministers to the emotional and spiritual needs of patients and their communities. Since its first hospital opened in 1998, CURE has completed more than 5.7 million patient visits and over 400,000 life-changing surgeries.
For more information, visit https://cure.org
About Thoughtworks
Thoughtworks is a global technology consultancy that integrates design, engineering and AI to drive digital innovation. We are over 10,000 people strong across 47 offices in 18 countries. For 30-plus years, we’ve delivered extraordinary impact together with our clients by helping them solve complex business problems with technology and culture as the differentiator.
Media contacts:
For CURE International
Gary Weyel
Marketing Director
gary.weyel@cureinternational.org
For Thoughtworks:
Michelle Surendran
Head of Public Relations for APAC and India
michels@thoughtworks.com
View original content to download multimedia:https://www.prnewswire.com/news-releases/cure-international-completes-electronic-medical-records-rollout-across-its-eight-childrens-hospitals-with-thoughtworks-302933263.html
SOURCE Thoughtworks
Technology
Hong Kong Web3 Festival 2027 Announces “OnChain Finance” Theme, Introduces Institutional Arena
Published
44 minutes agoon
November 10, 2026By

Hong Kong Web3 Festival 2027 will focus on “OnChain Finance” and introduce its inaugural Institutional Arena, an invitation-only, closed-door program bringing together senior executives and decision-makers from global financial institutions and the digital asset industry to explore developments in on-chain finance and opportunities for institutional collaboration.
HONG KONG, Nov. 10, 2026 /PRNewswire/ — The fifth edition of Hong Kong Web3 Festival, co-hosted by Wanxiang Blockchain Labs and HashKey Group and organized by W3ME, will take place from April 19 to 21, 2027, at the Hong Kong Convention and Exhibition Centre (HKCEC). Under the theme “OnChain Finance”, this year’s Festival will introduce its inaugural Institutional Arena, a fully closed-door, invitation-only program bringing together senior executives and key decision-makers from global banks, securities firms, asset managers, payment providers, insurance companies, family offices, and the digital asset industry to examine opportunities and future developments in on-chain finance.
As asset tokenization moves toward real-world adoption, stablecoin payments and on-chain settlement are expanding into a broader range of financial applications. Blockchain technology is becoming increasingly integrated into core financial market activities, including asset issuance, trading, payments, and settlement. Meanwhile, banks, asset managers, and payment companies worldwide are accelerating their engagement with digital assets, bringing greater attention to the integration of on-chain and traditional financial systems, cross-market collaboration, and regulatory compliance. From financial product innovation to the evolution of market mechanisms and infrastructure, OnChain Finance is driving deeper integration between blockchain technology and traditional finance.
Since its inaugural edition in 2023, Hong Kong Web3 Festival has witnessed the digital asset industry’s shift from infrastructure exploration toward practical applications, alongside growing engagement between traditional financial institutions and the digital asset sector. Previous editions have featured Cathie Wood, CEO and CIO of ARK Invest, sharing perspectives on digital assets and investment trends, as well as representatives from Hong Kong Exchanges and Clearing (HKEX), WeBank, and Ant International discussing financial technology innovation and real-world applications. Financial institutions including BlackRock, HSBC, China International Capital Corporation (CICC), and China Asset Management (Hong Kong) have also participated in industry discussions, reflecting the Festival’s continued engagement across banking, securities, asset management, investment, and financial technology.
Entering its fifth year, Hong Kong Web3 Festival 2027 will build on its longstanding focus on blockchain innovation and next-generation financial infrastructure, with OnChain Finance as its annual theme. The Festival will explore key topics including asset tokenization, stablecoins and global payments, on-chain capital markets, institutional digital asset services, regulatory compliance, quantum computing and cryptography, AI and financial security, as well as open hardware and privacy protection. Bringing together financial institutions, technology companies, and digital asset industry representatives from around the world, the Festival will examine practical applications, market opportunities, and future developments in on-chain finance.
Institutional Arena to Bring Global Financial Leaders Together for Closed-Door Discussions
A major new addition to the 2027 Festival, the Institutional Arena will be held during the three-day event from April 19 to 21. Operating on a fully closed-door, invitation-only basis, it will bring together senior executives and key decision-makers from global banks, asset management firms, payment companies, institutional investors, and digital asset businesses. The program is designed to provide a more focused and specialized setting for institutional engagement, while offering dedicated venues for leading financial institutions to host their own closed-door events.
As a key addition to this year’s program, the Institutional Arena will feature a dedicated networking area for institutional participants. Through keynote presentations, closed-door roundtables, and thematic discussions, it will address issues of particular interest to financial institutions, examining business practices across different markets and opportunities for collaboration. The program will also create a more targeted environment for direct engagement among financial institutions and between these institutions and innovative companies across the industry.
Complementing the Festival’s broader industry discussions, the Institutional Arena will provide a dedicated setting for deeper dialogue on practical business priorities, facilitating cross-institutional collaboration and business connections between global financial institutions and the digital asset sector.
Four Editions of Global Industry Engagement
Since its launch in 2023, Hong Kong Web3 Festival has grown into an international platform connecting participants across digital assets, finance, and technology. Across its first four editions, the festival has attracted more than 150,000 attendees, featured over 1,600 speakers, hosted more than 500 exhibitors, and supported over 600 side events.
Building on four editions of engagement spanning technological innovation and financial applications, Hong Kong Web3 Festival 2027 will place OnChain Finance at the center of its program. With the introduction of the Institutional Arena, the Festival aims to strengthen connections between global financial institutions and the digital asset industry, bringing together forward-looking perspectives and practical developments in financial innovation.
Further details on the Festival agenda, speakers, and Institutional Arena arrangements will be announced in due course. Follow the Wanxiang Blockchain Labs official WeChat account and Hong Kong Web3 Festival’s official X account (@festival_web3) for the latest updates.
Partnership and Participation Opportunities
Sponsorship Opportunities: https://hongkong.web3festival.org/2027sponsorshipApply to Speak: https://hongkong.web3festival.org/2027speakerapplicationMedia & Community Partnerships: https://hongkong.web3festival.org/2027partnerSide Event Applications: https://hongkong.web3festival.org/2027sideeventContact: w3@blockchainlabs.org
About Wanxiang Blockchain Labs
Founded in 2015, Wanxiang Blockchain Labs (the “Labs”) is a non-profit research institution dedicated to blockchain technology research and development. It brings together experts from around the world to advance research, foster dialogue, and explore the development, applications, and strategic implications of blockchain technology. Through its research and initiatives, the Labs seeks to provide insights and guidance for entrepreneurs, inform regulatory discussions, and support the broader development of blockchain technology and its potential contributions to society and the economy.
Since its establishment, the Labs has built an international presence through initiatives including the annual Shanghai Blockchain Global Summit and Hong Kong Web3 Festival, as well as hackathons, developer programs, incubation initiatives, blockchain publications, research projects, lectures, and academic collaborations.
About HashKey Group (3887.HK)
HashKey Group (3887.HK) is a leading digital asset financial services group in Asia with a global footprint. Founded in 2018, we are building the next-generation global financial infrastructure to serve institutions, retail investors and blockchain ecosystem partners. We enable traditional institutions and blockchain projects to efficiently access global resources and achieve compliant expansion and growth for their products and businesses. The Group operates across four core pillars: Transaction Facilitation, On-Chain Services, Asset Management and RWA Tokenisation.
HashKey Group is committed to driving the large-scale adoption of blockchain technology and delivering dependable and accessible digital asset services to one billion users worldwide.
View original content:https://www.prnewswire.com/apac/news-releases/hong-kong-web3-festival-2027-announces-onchain-finance-theme-introduces-institutional-arena-302934392.html
SOURCE Hong Kong Web3 Festival


DentScribe Launches Perio Charting Benchmark and Reports 100% Across All Eight Levels

CURE International completes electronic medical records rollout across its eight children’s hospitals with Thoughtworks
Hong Kong Web3 Festival 2027 Announces “OnChain Finance” Theme, Introduces Institutional Arena

Send Rakhi to UK swiftly with UK Gifts Portal

Whiteboard Series with NEAR | Ep: 45 Joel Thorstensson from ceramic.network

Nullmax and Renesas Forge Strategic Partnership to Deliver Competitive ADAS Solutions for the Global Market

Why You Should Build on #NEAR – Co-founder Illia Polosukhin at CV Labs
Whiteboard Series with NEAR | Ep: 45 Joel Thorstensson from ceramic.network

NEAR End of Year Town Hall 2021: The Open Web World, MetaBUILD 2 Hackathon and 2021 recap
Trending
-

 Technology4 days ago
Diamond Foundry Announces First-Ever D200mm Single-Crystal Diamond
-

 Coin Market4 days ago
Crypto exchanges tout cold storage ratios after Binance attack
-

 Near Videos5 days ago
Where AI money lands in crypto
-

 Technology5 days ago
OpenAssets and Digital Asset Partner to Modernize Capital Markets Infrastructure
-

 Technology4 days ago
2026 World Internet Conference Wuzhen Summit Opens
-

 Technology4 days ago
ASTRI Establishes Advisory Board for Smart Mobility Technology Alliance
-

 Technology5 days ago
Finshape launches Agentic DBOS: agentic AI already supporting digital banking projects
-

 Coin Market4 days ago
Bitcoin, Ether ETFs post $530M outflows as election gains evaporate