
Technology
Baidu Announces Second Quarter 2026 Results

Published
3 months agoon
By

BEIJING, Aug. 18, 2026 /PRNewswire/ — Baidu, Inc. (NASDAQ: BIDU and HKEX: 9888 (HKD Counter) and 89888 (RMB Counter)), (“Baidu” or the “Company”), a leading AI company with strong Internet foundation, today announced its unaudited financial results for the second quarter ended June 30, 2026.
“With AI-powered Business now firmly established as the core of Baidu, we are strengthening the foundations for our next phase of AI-driven growth. AI Cloud Infra sustained strong momentum this quarter, with GPU Cloud[1] growth accelerating further off an already high base. Our AI Applications portfolio also continued to flourish, with stronger capabilities and increasingly diverse use cases. Apollo Go made steady progress with its global expansion, while further strengthening its safety and operational capabilities and enhancing the rider experience,” said Robin Li, Co-founder and CEO of Baidu. “While our online marketing business remains under pressure, the growing momentum in our core AI-powered Business reaffirms Baidu’s transition from an internet-centric company to an AI-first company, and strengthens our confidence in our long-term growth potential.”
“The quarter was marked by several highlights. First, revenue from Baidu Core AI-powered Business[2] reached RMB 12.5 billion and continued to account for half of Baidu General Business revenue. Second, operating cash flow for Baidu remained positive for the fourth consecutive quarter, reaching RMB 3.4 billion in the second quarter. Third, we are moving forward with our conversion to a dual-primary listing in Hong Kong and expect it to become effective within this year.” said Haijian He, CFO of Baidu. “Going forward, we remain firmly committed to investing in AI as the core driver of Baidu’s long-term growth.”
Operational Highlights[2]
Corporate
In July 2026, following the Board’s approval of a motion to pursue a voluntary conversion to a dual-primary listing (the “Primary Conversion”), Baidu submitted its application for the Primary Conversion and received the Hong Kong Stock Exchange’s acknowledgement of the application. The Company will convene an extraordinary general meeting of shareholders on August 26, 2026 prior to the Primary Conversion to seek shareholder approval for related matters. The Primary Conversion is expected to become effective within this year, subject to the shareholder approval and the approval of the Hong Kong Stock Exchange.At the 2026 AI for Good Global Summit, three Baidu AI use cases—Apollo Go, Miaoda & MeDo, and PaddlePaddle—were recognized as winning cases and featured in the Innovate for Impact Report.According to MSCI’s March 2026 ESG rating update, Baidu maintained its “AA” rating and continued to demonstrate industry-leading ESG performance.Baidu has returned US$259 million to shareholders since the beginning of Q1 2026 through repurchases of its shares under the current share repurchase program.
Baidu Core AI-powered Business
AI Cloud Infra
Revenue from AI Cloud Infra was RMB 7.3 billion in the second quarter of 2026, up 50% year over year.Within AI Cloud Infra, revenue from GPU Cloud[3] increased by 283% year over year in the second quarter of 2026, further accelerating from 184% growth in the previous quarter.
AI Applications
Revenue from AI Applications was RMB 2.5 billion in the second quarter of 2026, up 3% year over year.Baidu launched an enterprise edition of DuMate, its general-purpose agent for everyday productivity, in June 2026.Baidu Wenku and Baidu Drive continued to strengthen their AI-powered features, expanding new capabilities and enhancing existing ones, including through upgrades to GenFlow. In June 2026, AI DAU penetration across Baidu Wenku and Baidu Drive increased by 27.4% year over year, reflecting broader adoption of their AI-powered features.
Robotaxi
Apollo Go continued to advance its global expansion. In London, Apollo Go began open-road testing in partnership with Uber and Lyft. In Dubai, Apollo Go launched fully driverless commercial operations, with rides also available through the Uber app, in addition to its own app. In Hong Kong, Apollo Go received the city’s first permits for fully driverless testing and commenced testing on Airport Island, becoming the first autonomous ride-hailing service provider globally to conduct fully driverless testing in a right-hand-drive, left-hand traffic robotaxi market. In Switzerland, Apollo Go conducted open-road testing in partnership with PostBus. Apollo Go also signed a Memorandum of Understanding with Kazakhstan’s Turlov Private Holding Ltd. to jointly explore autonomous ride-hailing services in the country.To date, Apollo Go’s global footprint has reached 28 cities, and its fleets have accumulated over 350 million autonomous kilometers, including over 240 million fully driverless autonomous kilometers, with an outstanding safety record.
AI-native Marketing Services
Revenue from AI-native marketing services reached RMB 2.6 billion in the second quarter of 2026, approximately flat year over year.Baidu App’s MAUs reached 644 million in June 2026.
The following table sets forth selected revenue highlights for our Baidu Core AI-powered Business for the periods indicated:
Baidu General Business
Q2
Q1
Q2
(In billions)
2025
2026
2026
YoY
QoQ
RMB
RMB
RMB
Baidu Core AI-powered Business[2]
10.0
13.6
12.5
25 %
(8 %)
– AI Cloud Infra
4.9
8.8
7.3
50 %
(17 %)
– AI Applications
2.5
2.5
2.5
3 %
3 %
– AI-native Marketing Services
2.6
2.3
2.6
0 %
11 %
% of Baidu General Business
38 %
52 %
50 %
Legacy Business[2]
13.6
10.2
10.4
(23 %)
3 %
Others[2]
2.7
2.2
2.3
(15 %)
2 %
Baidu General Business
26.3
26.0
25.2
(4 %)
(3 %)
[1] Revenue from GPU Cloud was previously referred to as subscription-based revenue from AI accelerator infrastructure. The growth in GPU Cloud Revenue reflected mounting demand for public cloud-based AI computing.
[2] The revenue and operational data presented are derived from the Company’s internal management accounts and records, which have not been audited.
Second Quarter 2026 Financial Results for Baidu[3],[4]
Financial highlights
The following table sets forth revenue highlights for Baidu General Business:
Q2
Q1
Q2
(In billions, unaudited)
2025
2026
2026
YoY
QoQ
RMB
RMB
RMB
Online Marketing Services
16.2
12.6
13.1
(19 %)
4 %
Online Marketing Services % of Baidu
General Business
62 %
48 %
52 %
Others
10.0
13.4
12.1
21 %
(10 %)
Others % of Baidu General Business
38 %
52 %
48 %
Baidu General Business
26.3
26.0
25.2
(4 %)
(3 %)
Revenue was RMB31.3 billion ($4.62 billion), decreasing 2% quarter over quarter and 4% year over year. Revenue from Baidu General Business was RMB25.2 billion ($3.71 billion), decreasing 3% quarter over quarter and 4% year over year. Revenue from iQIYI was RMB6.3 billion ($927 million), increasing 1% quarter over quarter and decreasing 5% year over year.
Cost of revenue was RMB19.1 billion ($2.82 billion), decreasing 3% quarter over quarter, primarily due to a decrease in costs related to AI Cloud business, partially offset by an increase in traffic acquisition costs, and increasing 4% year over year, primarily due to increases in costs related to AI Cloud business.
Selling, general and administrative expenses were RMB4.6 billion ($677 million), decreasing 6% quarter over quarter and 23% year over year. The year over year decrease was primarily due to decreases in expected credit losses and channel spending expenses.
Research and development expenses were RMB4.6 billion ($679 million), increasing 5% quarter over quarter and decreasing 10% year over year, both of which were primarily due to fluctuations in personnel-related expenses.
Operating income was RMB3.0 billion ($446 million) and operating margin was 10%. Non-GAAP operating income was RMB3.8 billion ($558 million) and non-GAAP operating margin was 12%.
Total other income, net was RMB184 million ($27 million), compared to RMB626 million last quarter and RMB4.9 billion for the same period last year. The year over year decrease was primarily due to a decrease in fair value gain from long-term investments and an increase in net foreign exchange loss arising from exchange rate fluctuation between Renminbi and U.S. dollar.
Income tax expense was RMB1.0 billion ($147 million), compared to RMB528 million last quarter and RMB881 million for the same period last year.
Net income attributable to Baidu was RMB2.3 billion ($342 million), net margin for Baidu was 7% and diluted earnings per ADS was RMB5.74 ($0.85). Non-GAAP net income attributable to Baidu was RMB2.6 billion ($379 million), non-GAAP net margin for Baidu was 8% and non-GAAP diluted earnings per ADS was RMB7.22 ($1.06).
Adjusted EBITDA was RMB6.2 billion ($906 million) and adjusted EBITDA margin was 20%.
We define total cash and investments as cash, cash equivalents, restricted cash, short-term investments, net, long-term time deposits and held-to-maturity investments, and adjusted long-term investments. As of June 30, 2026, total cash and investments were RMB283.1 billion ($41.72 billion). Operating cash flow was RMB3.4 billion ($506 million).
For detailed financial information of Baidu General Business and iQIYI, please see the appended financial tables.
[3] Non-GAAP measures are defined in the Non-GAAP Financial Measures section (see also “Reconciliations of Non-GAAP Financial Measures to the Nearest Comparable GAAP Measures” for more details).
[4] Unless otherwise noted, RMB to USD was converted at an exchange rate of RMB6.7851 as of June 30, 2026, as set forth in the H.10 statistical release of the Board of Governors of the Federal Reserve System. Translations are provided solely for the convenience of the reader.
Changes in the Composition of Board Committees
In connection with the Primary Conversion, the board of directors of the Company (the “Board”) has approved the following changes to the composition of the committees of the Board, with effect from the date on which the Primary Conversion becomes effective:
Mr. Yuanqing Yang, an independent director of the Company, will be appointed as an additional member of the audit committee of the Board. Following such appointment, the audit committee will comprise Ms. Xiaodan Liu (chairperson), Mr. Jixun Foo and Mr. Yuanqing Yang.
Ms. Xiaodan Liu, an independent director of the Company, will be appointed as an additional member of the corporate governance and nominating committee of the Board. Following such appointment, the corporate governance and nominating committee will comprise Mr. Jixun Foo (chairperson), Mr. Yuanqing Yang and Ms. Xiaodan Liu.
Conference Call Information
Baidu’s management will hold an earnings conference call at 8:00 AM on Aug 18, 2026, U.S. Eastern Time (8:00 PM on Aug 18, 2026, Beijing Time).
Please register in advance of the conference call using the link provided below. It will automatically direct you to the registration page of “Baidu Inc. Q2 2026 Earnings Conference Call”. Please follow the steps to enter your registration details, then click “Register”. Upon registering, you will then be provided with the dial-in number, the passcode, and your unique access PIN. This information will also be emailed to you as a calendar invite.
For pre-registration, please click:
https://s1.c-conf.com/diamondpass/10056174-8o7ckp.html
In the 10 minutes prior to the call start time, you may use the conference access information (including dial-in number(s), the passcode and unique access PIN) provided in the calendar invite that you have received following your pre-registration.
Additionally, a live and archived webcast of this conference call will be available at https://ir.baidu.com.
About Baidu
Founded in 2000, Baidu’s mission is to make the complicated world simpler through technology. Baidu is a leading AI company with strong Internet foundation, trading on NASDAQ under “BIDU” and HKEX under “9888”. One Baidu ADS represents eight Class A ordinary shares.
Safe Harbor Statement
This announcement contains forward-looking statements. These statements are made under the “safe harbor” provisions of the U.S. Private Securities Litigation Reform Act of 1995. These forward-looking statements can be identified by terminology such as “will,” “expects,” “anticipates,” “future,” “intends,” “plans,” “believes,” “estimates,” “confident” and similar statements. Among other things, Baidu’s and other parties’ strategic and operational plans, contain forward-looking statements. Baidu may also make written or oral forward-looking statements in its periodic reports to the U.S. Securities and Exchange Commission, in announcements made on the website of The Stock Exchange of Hong Kong Limited (the “Hong Kong Stock Exchange”), in its annual report to shareholders, in press releases and other written materials and in oral statements made by its officers, directors or employees to third parties. Statements that are not historical facts, including but not limited to statements about Baidu’s beliefs and expectations, are forward-looking statements. Forward-looking statements involve inherent risks and uncertainties. A number of factors could cause actual results to differ materially from those contained in any forward-looking statement, including but not limited to the following: Baidu’s growth strategies; its future business development, including development of new products and services; its ability to attract and retain users and customers; competition in the Chinese Internet search and newsfeed market; competition for online marketing customers; changes in the Company’s revenues and certain cost or expense items as a percentage of its revenues; the outcome of ongoing, or any future, litigation or arbitration, including those relating to intellectual property rights; the expected growth of the Chinese-language Internet search and newsfeed market and the number of Internet and broadband users in China; Chinese governmental policies relating to the Internet and Internet search providers, and general economic conditions in China and elsewhere. Further information regarding these and other risks is included in the Company’s annual report on Form 20-F and other documents filed with the Securities and Exchange Commission, and announcements on the website of the Hong Kong Stock Exchange. Baidu does not undertake any obligation to update any forward-looking statement, except as required under applicable law. All information provided in this press release and in the attachments is as of the date of the press release, and Baidu undertakes no duty to update such information, except as required under applicable law.
Non-GAAP Financial Measures
To supplement Baidu’s consolidated financial results presented in accordance with GAAP, Baidu uses the following non-GAAP financial measures: non-GAAP operating income, non-GAAP operating margin, non-GAAP net income attributable to Baidu, non-GAAP net margin, non-GAAP diluted earnings per ADS, adjusted EBITDA, adjusted EBITDA margin, adjusted long-term investments and free cash flow. The presentation of these non-GAAP financial measures is not intended to be considered in isolation or as a substitute for the financial information prepared and presented in accordance with GAAP.
Baidu believes that these non-GAAP financial measures provide meaningful supplemental information regarding its performance and liquidity by excluding certain items that may not be indicative of its recurring core business operating results, such as operating performance excluding non-cash charges or non-operating in nature. The Company believes that both management and investors benefit from referring to these non-GAAP financial measures in assessing its performance and when planning and forecasting future periods. These non-GAAP financial measures also facilitate management’s internal comparisons to Baidu’s historical performance and liquidity. The Company believes these non-GAAP financial measures are useful to investors in allowing for greater transparency with respect to supplemental information used by management in its financial and operational decision making. A limitation of using these non-GAAP financial measures is that these non-GAAP measures exclude certain items that have been and will continue to be for the foreseeable future a significant component in the Company’s results of operations. These non-GAAP financial measures presented here may not be comparable to similarly titled measures presented by other companies. Other companies may calculate similarly titled measures differently, limiting their usefulness as comparative measures to the Company’s data.
Non-GAAP operating income represents operating income excluding share-based compensation expenses, and amortization and impairment of intangible assets resulting from business combinations.
Non-GAAP net income attributable to Baidu represents net income attributable to Baidu excluding share-based compensation expenses, amortization and impairment of intangible assets resulting from business combinations, disposal gain or loss, impairment of long-term investments, and fair value gain or loss of long-term investments and exchangeable bonds, adjusted for related income tax effects. Baidu’s share of equity method investments for these non-GAAP reconciling items, amortization and impairment of intangible assets not on the investees’ books, accretion of their redeemable non-controlling interests, and the gain or loss associated with the issuance of shares by the investees at a price higher or lower than the carrying value per share, adjusted for related income tax effects, are also excluded.
Non-GAAP diluted earnings per ADS represents diluted earnings per ADS calculated by dividing non-GAAP net income attributable to Baidu, by the weighted average number of ordinary shares expressed in ADS. Adjusted EBITDA represents non-GAAP operating income excluding depreciation of fixed assets, and amortization of intangible assets excluding those resulting from business combinations. Adjusted long-term investments represent long-term investments, net, with publicly listed equity method investments adjusted to fair value based on quoted market prices.
For more information on non-GAAP financial measures, please see the tables captioned “Reconciliations of non-GAAP financial measures to the nearest comparable GAAP measure.”
Baidu, Inc.
Condensed Consolidated Statements of Income
(In millions except for per share (or ADS) information, unaudited)
Three Months Ended
Six Months Ended
June 30,
March 31,
June 30,
June 30,
June 30,
June 30,
June 30,
2025
2026
2026
2026
2025
2026
2026
RMB
RMB
RMB
US$(2)
RMB
RMB
US$(2)
Revenue
32,713
32,075
31,325
4,617
65,165
63,400
9,344
Costs and expenses:
Cost of revenue(1)
18,357
19,589
19,098
2,815
35,844
38,687
5,702
Selling, general and administrative(1)
5,960
4,912
4,596
677
11,873
9,508
1,401
Research and development(1)
5,119
4,381
4,607
679
9,663
8,988
1,325
Total costs and expenses
29,436
28,882
28,301
4,171
57,380
57,183
8,428
Operating income
3,277
3,193
3,024
446
7,785
6,217
916
Other income:
Interest income
1,957
1,963
1,685
248
4,621
3,648
538
Interest expense
(701)
(636)
(608)
(90)
(1,502)
(1,244)
(183)
Foreign exchange loss, net
(621)
(989)
(1,160)
(171)
(831)
(2,149)
(317)
Share of earnings from equity method investments
694
536
357
53
1,268
893
132
Others, net
3,534
(248)
(90)
(13)
5,794
(338)
(50)
Total other income, net
4,863
626
184
27
9,350
810
120
Income before income taxes
8,140
3,819
3,208
473
17,135
7,027
1,036
Income tax expense
881
528
1,000
147
2,058
1,528
225
Net income
7,259
3,291
2,208
326
15,077
5,499
811
Net income (loss) attributable to noncontrolling interests
(63)
(154)
(111)
(16)
38
(265)
(39)
Net income attributable to Baidu
7,322
3,445
2,319
342
15,039
5,764
850
Earnings per ADS (1 ADS representing 8 Class A ordinary shares):
-Basic
20.90
9.38
6.08
0.90
42.76
15.46
2.28
-Diluted
20.35
8.76
5.74
0.85
41.95
14.50
2.14
Earnings per share for Class A and Class B ordinary shares:
-Basic
2.61
1.17
0.76
0.11
5.35
1.93
0.28
-Diluted
2.54
1.10
0.72
0.11
5.24
1.81
0.27
Weighted average number of Class A and Class B ordinary shares outstanding (in millions):
-Basic
2,720
2,721
2,716
2,716
2,735
2,719
2,719
-Diluted
2,730
2,764
2,755
2,755
2,746
2,760
2,760
(1) Includes share-based compensation expenses as follows:
Cost of revenue
120
82
91
13
197
173
25
Selling, general and administrative
276
190
220
33
589
410
60
Research and development
685
291
398
58
1,046
689
102
Total share-based compensation expenses
1,081
563
709
104
1,832
1,272
187
(2) All translations from RMB to U.S. dollars are made at a rate of RMB6.7851 to US$1.00, the exchange rate in effect as of June 30, 2026 as set forth in the H.10 statistical release
of The Board of Governors of the Federal Reserve System.
Baidu, Inc.
Condensed Consolidated Balance Sheets
(In millions, unaudited)
December 31,
June 30,
June 30,
2025
2026
2026
RMB
RMB
US$
ASSETS
Current assets:
Cash and cash equivalents
24,606
24,524
3,614
Restricted cash
225
170
25
Short-term investments, net
90,661
141,727
20,888
Accounts receivable, net
12,972
13,493
1,989
Amounts due from related parties
761
721
106
Other current assets, net
22,745
26,729
3,940
Total current assets
151,970
207,364
30,562
Non-current assets:
Fixed assets, net
26,281
28,484
4,198
Licensed copyrights, net
5,963
6,068
894
Produced content, net
14,575
13,903
2,049
Intangible assets, net
3,891
4,997
736
Goodwill
36,783
36,783
5,421
Long-term investments, net
44,918
42,855
6,316
Long-term time deposits and held-to-maturity investments
123,862
74,311
10,952
Amounts due from related parties
167
144
21
Deferred tax assets, net
4,582
4,480
660
Lease right-of-use assets
9,287
18,574
2,737
Other non-current assets
26,878
31,969
4,713
Total non-current assets
297,187
262,568
38,697
Total assets
449,157
469,932
69,259
LIABILITIES, REDEEMABLE NONCONTROLLING INTERESTS AND EQUITY
Current liabilities:
Short-term loans
7,626
26,311
3,878
Accounts payable and accrued liabilities
38,846
40,040
5,901
Customer deposits and deferred revenue
13,051
12,819
1,889
Deferred income
531
431
64
Long-term loans, current portion
14,765
2,027
299
Convertible senior notes, current portion
1,459
1
–
Notes payable, current portion
4,560
2,038
300
Amounts due to related parties
1,988
1,818
268
Lease liabilities
3,502
3,631
535
Total current liabilities
86,328
89,116
13,134
Non-current liabilities:
Deferred income
198
152
22
Deferred revenue
723
775
114
Amounts due to related parties
36
25
4
Long-term loans
3,369
20,779
3,062
Notes payable
51,021
46,089
6,793
Convertible senior notes
6,712
6,615
975
Deferred tax liabilities
4,985
5,426
800
Lease liabilities
4,885
5,406
797
Other non-current liabilities
1,174
452
66
Total non-current liabilities
73,103
85,719
12,633
Total liabilities
159,431
174,835
25,767
Redeemable noncontrolling interests
13,166
13,685
2,017
Equity
Total Baidu shareholders’ equity
266,330
271,752
40,051
Noncontrolling interests
10,230
9,660
1,424
Total equity
276,560
281,412
41,475
Total liabilities, redeemable noncontrolling interests,
and equity
449,157
469,932
69,259
Baidu, Inc.
Selected Information
(In millions, unaudited)
Three months ended
Three months ended
Three months ended
Three months ended
June 30, 2025 (RMB)
March 31, 2026 (RMB)
June 30, 2026 (RMB)
June 30, 2026 (US$)
Baidu
General
Business
iQIYI
Elim &
adj(2)
Baidu, Inc.
Baidu
General
Business
iQIYI
Elim &
adj(2)
Baidu, Inc.
Baidu
General
Business
iQIYI
Elim &
adj(2)
Baidu, Inc.
Baidu
General
Business
iQIYI
Elim &
adj(2)
Baidu, Inc.
Revenue
26,251
6,628
(166)
32,713
26,001
6,226
(152)
32,075
25,183
6,287
(145)
31,325
3,712
927
(22)
4,617
Costs and expenses:
Cost of revenue(1)
13,214
5,292
(149)
18,357
14,498
5,233
(142)
19,589
13,982
5,250
(134)
19,098
2,062
774
(21)
2,815
Selling, general and administrative(1)
5,018
960
(18)
5,960
4,109
817
(14)
4,912
3,861
744
(9)
4,596
569
110
(2)
677
Research and development(1)
4,697
422
–
5,119
3,978
404
(1)
4,381
4,209
398
–
4,607
620
59
–
679
Total costs and expenses
22,929
6,674
(167)
29,436
22,585
6,454
(157)
28,882
22,052
6,392
(143)
28,301
3,251
943
(23)
4,171
Operating income (loss)
3,322
(46)
1
3,277
3,416
(228)
5
3,193
3,131
(105)
(2)
3,024
461
(16)
1
446
Operating margin
13 %
(1 %)
10 %
13 %
(4 %)
10 %
12 %
(2 %)
10 %
Add: total other income (loss), net
4,925
(62)
–
4,863
654
(28)
–
626
189
(5)
–
184
28
(1)
–
27
Less: income tax expense
854
27
–
881
491
37
–
528
780
220
–
1,000
115
32
–
147
Less: net income (loss) attributable to NCI
11
(1)
(73)[3]
(63)
6
1
(161)[3]
(154)
87
(43)
(155)[3]
(111)
12
(6)
(22)[3]
(16)
Net income (loss) attributable to Baidu
7,382
(134)
74
7,322
3,573
(294)
166
3,445
2,453
(287)
153
2,319
362
(43)
23
342
Net margin
28 %
(2 %)
22 %
14 %
(5 %)
11 %
10 %
(5 %)
7 %
Non-GAAP financial measures:
Operating income (loss) (non-GAAP)
4,385
59
4,445
3,950
(148)
3,807
3,818
(31)
3,785
563
(6)
558
Operating margin (non-GAAP)
17 %
1 %
14 %
15 %
(2 %)
12 %
15 %
(0 %)
12 %
Net income (loss) attributable to Baidu (non-GAAP)
4,792
15
4,795
4,433
(233)
4,332
2,672
(210)
2,573
394
(32)
379
Net margin (non-GAAP)
18 %
0 %
15 %
17 %
(4 %)
14 %
11 %
(3 %)
8 %
Adjusted EBITDA
6,397
94
6,492
6,050
(101)
5,954
6,141
11
6,150
905
–
906
Adjusted EBITDA margin
24 %
1 %
20 %
23 %
(2 %)
19 %
24 %
0 %
20 %
(1) Includes share-based compensation as follows:
Cost of revenue
88
32
120
59
23
82
68
23
91
10
3
13
Selling, general and administrative
238
38
276
161
29
190
194
26
220
29
4
33
Research and development
652
33
685
265
26
291
375
23
398
55
3
58
Total share-based compensation
978
103
1,081
485
78
563
637
72
709
94
10
104
(2) Relates to intersegment eliminations and adjustments
(3) Relates to the net income attributable to iQIYI noncontrolling interests
Baidu, Inc.
Condensed Consolidated Statements of Cash Flows
(In millions,unaudited)
Three months ended
Three months ended
Three months ended
Three months ended
June 30, 2025 (RMB)
March 31, 2026 (RMB)
June 30, 2026 (RMB)
June 30, 2026 (US$)
Baidu
excl.
iQIYI
iQIYI
Baidu,
Inc.
Baidu
excl.
iQIYI
iQIYI
Baidu,
Inc.
Baidu
excl.
iQIYI
iQIYI
Baidu,
Inc.
Baidu
excl.
iQIYI
iQIYI
Baidu,
Inc.
Net cash provided by (used in) operating
activities
(864)
(13)
(877)
2,484
186
2,670
3,096
340
3,436
456
50
506
Net cash provided by (used in) investing activities
(8,428)
(113)
(8,541)
5,217
(275)
4,942
(26,217)
(246)
(26,463)
(3,864)
(36)
(3,900)
Net cash provided by (used in) financing activities
(8,688)
(465)
(9,153)
(702)
(933)
(1,635)
17,606
(201)
17,405
2,595
(30)
2,565
Effect of exchange rate changes on cash, cash
equivalents and restricted cash
(210)
(28)
(238)
(241)
(35)
(276)
(208)
(8)
(216)
(30)
(1)
(31)
Net increase (decrease) in cash, cash
equivalents and restricted cash
(18,190)
(619)
(18,809)
6,758
(1,057)
5,701
(5,723)
(115)
(5,838)
(843)
(17)
(860)
Cash, cash equivalents and restricted cash
At beginning of period
45,118
4,758
49,876
20,453
4,378
24,831
27,211
3,321
30,532
4,010
489
4,499
At end of period
26,928
4,139
31,067
27,211
3,321
30,532
21,488
3,206
24,694
3,167
472
3,639
Net cash provided by (used in) operating
activities
(864)
(13)
(877)
2,484
186
2,670
3,096
340
3,436
456
50
506
Less: Capital expenditures
(3,779)
(21)
(3,800)
(5,839)
(77)
(5,916)
(11,370)
(20)
(11,390)
(1,676)
(3)
(1,679)
Free cash flow
(4,643)
(34)
(4,677)
(3,355)
109
(3,246)
(8,274)
320
(7,954)
(1,220)
47
(1,173)
Note: Baidu excl. iQIYI represents Baidu, Inc. minus iQIYI’s consolidated cash flows.
Baidu, Inc.
Reconciliations of Non-GAAP Financial Measures to the Nearest Comparable GAAP Measures
(In millions except for per ADS information, unaudited)
Three months ended
Three months ended
Three months ended
Three months ended
June 30, 2025 (RMB)
March 31, 2026 (RMB)
June 30, 2026 (RMB)
June 30, 2026 (US$)
Baidu
General
Business
iQIYI
Baidu,
Inc.
Baidu
General
Business
iQIYI
Baidu,
Inc.
Baidu
General
Business
iQIYI
Baidu,
Inc.
Baidu
General
Business
iQIYI
Baidu,
Inc.
Operating income (loss)
3,322
(46)
3,277
3,416
(228)
3,193
3,131
(105)
3,024
461
(16)
446
Add: Share-based compensation expenses
978
103
1,081
485
78
563
637
72
709
94
10
104
Add: Amortization and impairment of intangible assets resulting from business combinations
85
2
87
49
2
51
50
2
52
8
–
8
Operating income (loss) (non-GAAP)
4,385
59
4,445
3,950
(148)
3,807
3,818
(31)
3,785
563
(6)
558
Add: Depreciation of fixed assets and amortization of intangible assets(1)
2,012
35
2,047
2,100
47
2,147
2,323
42
2,365
342
6
348
Adjusted EBITDA
6,397
94
6,492
6,050
(101)
5,954
6,141
11
6,150
905
–
906
Net income (loss) attributable to Baidu
7,382
(134)
7,322
3,573
(294)
3,445
2,453
(287)
2,319
362
(43)
342
Add: Share-based compensation expenses
977
103
1,024
484
78
519
636
72
669
94
11
99
Add: Amortization and impairment of intangible assets resulting from business combinations
83
2
84
47
2
48
48
2
49
7
–
7
Add: Disposal gain
(262)
–
(267)
(2)
–
(2)
(26)
–
(26)
(4)
–
(4)
Add: Impairment of long-term investments
101
26
113
79
9
83
464
–
464
68
–
68
Add: Fair value loss (gain) of long-term investments and exchangeable bonds
(3,317)
18
(3,309)
378
(28)
365
(1,073)
3
(1,072)
(158)
–
(158)
Add: Reconciling items on equity method investments(2)
(121)
–
(121)
(44)
–
(44)
82
–
82
12
–
12
Add: Tax effects on non-GAAP adjustments(3)
(51)
–
(51)
(82)
–
(82)
88
–
88
13
–
13
Net income (loss) attributable to Baidu (non-GAAP)
4,792
15
4,795
4,433
(233)
4,332
2,672
(210)
2,573
394
(32)
379
Diluted earnings per ADS
20.35
8.76
5.74
0.85
Add: Accretion of the redeemable noncontrolling interests
0.64
0.74
0.74
0.11
Add: Non-GAAP adjustments to earnings per ADS
(7.41)
2.56
0.74
0.10
Diluted earnings per ADS (non-GAAP)
13.58
12.06
7.22
1.06
(1) This represents amortization of intangible assets excluding those resulting from business combinations.
(2) This represents Baidu’s share of equity method investments for other non-GAAP reconciling items, amortization and impairment of intangible assets not on the investee’s books, accretion of their redeemable noncontrolling interests,
and the gain or loss associated with the issuance of shares by the investees at a price higher or lower than the carrying value per share.
(3) This represents tax impact of all non-GAAP adjustments.
View original content:https://www.prnewswire.com/news-releases/baidu-announces-second-quarter-2026-results-302853860.html
SOURCE Baidu, Inc.

You may like
Technology
Fibocom LTE Cat.1 bis Modules: Starlink DTC Field Test Report
Published
1 hour agoon
November 8, 2026By
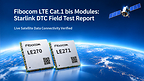
AUCKLAND, New Zealand, Nov. 8, 2026 /PRNewswire/ — Fibocom’s LE270-EU and LE271-GL LTE Cat.1 bis modules have successfully connected to the SpaceX Direct to Cell (DTC) satellite network during live-network testing in New Zealand. Using standard firmware and without adding satellite-specific hardware modifications, both modules successfully registered on the network, established IP data sessions, and transmitted data over the satellite link. Testing across outdoor, in-vehicle, and indoor environments also provided insights into real-world connectivity performance under different conditions.
Extending LTE Beyond Terrestrial Coverage
For asset trackers, environmental monitoring devices, and other IoT equipment deployed in remote agricultural areas, mountainous regions, or locations with limited cellular coverage, satellite connectivity offers an additional way to keep devices connected.
Traditionally, adding satellite capabilities can introduce additional hardware requirements, power consumption, and development costs. This raises an important question for IoT device manufacturers: Can existing LTE designs be extended to support satellite connectivity without adding dedicated satellite communication hardware?
LTE Cat.1 bis offers a practical balance of data performance, mobility, power consumption, and cost for a broad range of IoT applications. SpaceX Direct to Cell extends the reach of cellular technology by deploying LTE base station capabilities on low Earth orbit (LEO) satellites and operating through partnerships with mobile network operators.
For compatible LTE devices that meet the relevant network access requirements, satellites can provide an additional connectivity option beyond terrestrial cell towers.
This creates opportunities for OEMs to explore satellite-enabled IoT applications while retaining their existing LTE hardware architecture, potentially reducing the complexity of introducing satellite connectivity into established device designs.
Real-World Performance Across Two Environments
Establishing a satellite connection is only part of the equation. For IoT applications, reliable data transfer and the ability to operate under varying coverage conditions are equally important.
Under open-sky conditions, both modules successfully established satellite data connections and demonstrated practical data throughput.
During outdoor and in-vehicle testing with good sky visibility, the LE270-EU achieved approximately 2.2 Mbps downlink throughput, while the LE271-GL reached approximately 2.0 Mbps. Both modules delivered around 0.3 Mbps uplink throughput, with network registration taking approximately 1–30 seconds and ping response rates ranging from 80% to 90%.
The modules were also able to register and exchange data under weak-signal conditions, demonstrating the feasibility of standard LTE connectivity over a live satellite network.
In indoor environments with obstructed sky visibility, connectivity performance varied more significantly.
When tested inside a hotel room, downlink throughput dropped to approximately 0.5 Mbps in some test scenarios, while ping response rates were around 65%–70%. Some data requests also experienced noticeably longer response times.
These findings highlight both the potential and the practical considerations of satellite-enabled IoT connectivity.
For applications such as asset tracking and agricultural monitoring, which typically transmit small amounts of data at regular intervals, the priority is not necessarily to match terrestrial LTE speeds. Instead, satellite connectivity can provide an additional path for transmitting location updates, device status, and sensor readings when terrestrial coverage is unavailable.
Designed for Practical IoT Deployment
Extending connectivity beyond terrestrial networks is valuable, but IoT devices must still meet fundamental requirements for size, power efficiency, and development cost, particularly in battery-powered applications designed to operate unattended for extended periods.
Fibocom’s LE270 and LE271 series LTE Cat.1 bis modules feature a compact 17.7 × 15.8 × 2.4 mm form factor and Power Saving Mode (PSM) current as low as 2.5 μA. With OpenCPU development capabilities and a range of peripheral interfaces, the modules offer flexibility for compact device designs, integrated applications, and power-sensitive IoT deployments.
Satellite connectivity also introduces different considerations for power management.
In the field tests, uploading the same file over the satellite connection required approximately 1.5–1.8 times the energy consumed over a terrestrial cellular connection. The increase was primarily associated with longer transmission times, higher transmit current, and data retransmissions. Meanwhile, the modules maintained their low PSM sleep current.
For battery-powered IoT devices, combining low-power hardware with an appropriate data reporting strategy is essential. Adjusting reporting intervals, buffering data during temporary connectivity interruptions, and retrying transmissions when the link becomes available can help devices operate more effectively under variable satellite network conditions.
The testing has also provided Fibocom with practical engineering insights into satellite network access, data transmission, and connectivity performance across different environments.
Building on these results, Fibocom is continuing to optimize DTC firmware compatibility for the LE270 and LE271 series, with a focus on improving network registration efficiency and connection resilience. These efforts will further support device manufacturers exploring satellite connectivity for asset tracking, remote monitoring, and other IoT applications.
About Fibocom
Fibocom, founded in 1999, is China’s first wireless communication module company listed on both the A-share and H-share markets. Fibocom leverages wireless communication and artificial intelligence as its core technologies to provide integrated hardware and software solutions that empower industry applications. These solutions accelerate the transformation from “Connect Everything” to “Intelligent Connectivity” across diverse industries.
Fibocom’s one-stop solutions encompass cellular communication, AI, automotive, and GNSS modules, as well as AI toolchains, supporting industry-side and mainstream large model integration, and providing AI Agent, global connectivity, and cloud services, driving the digital intelligence upgrades in industries such as robotics, consumer electronics, low-altitude economy, intelligent transportation, smart retail, and smart energy.
View original content to download multimedia:https://www.prnewswire.com/news-releases/fibocom-lte-cat1-bis-modules-starlink-dtc-field-test-report-302930788.html
SOURCE Fibocom Wireless Inc.
Technology
Budget 2026: Masters of our Destiny – Minister Miller announces the rollout of $600 million targeted support to Canada’s audio and audiovisual sectors
Published
2 hours agoon
November 8, 2026By
As announced in Budget 2026, the Government of Canada is providing important measures to support the audio and audiovisual sectors, and to protect access to public service media, productions from official language minority communities, Indigenous content, accessible programming, and local news.
GATINEAU, QC, Nov. 8, 2026 /CNW/ — In an increasingly turbulent world, Canada is determining its future. The federal Budget 2026 aims to make Canadians masters of their own destiny. The Canadian audio and audiovisual sectors are a major source of economic activity and jobs as well as a cornerstone of our country’s cultural sovereignty.
Budget 2026 confirmed a $600 Million dollar investment in the audio and audiovisual sectors for this fiscal year. Today, the Honourable Marc Miller, Minister of Canadian Identity and Culture and Minister responsible for Official Languages, announced the funding rollout of these significant funds that will provide stability and direct support to the sectors while longer-term policy, regulatory and market conditions evolve.
The Government will focus on stabilizing Canada’s audio, audiovisual and news sectors while keeping Canadian culture accessible and affordable. To ensure rapid and effective delivery, the funding will be delivered through the following six existing programs and institutions that have proven efficiency and have trusted industry funding tools:
Canada Media Fund,Indigenous Screen Office,Canada Music Fund,Northern Aboriginal Broadcasting,Canada History Fund, andTelefilm Canada.
This new direct funding allocation will support Canada’s creativity, arts and culture by ensuring that:
Canada’s audio and audiovisual sectors become more competitive and resilient;Canadians can continue to consume homegrown content on multiple platforms;A broad range of Canadian music is consumed in Canada and abroad;More Indigenous people work on audiovisual content production and lead such projects and, so that the overall representation of Indigenous peoples in audiovisual media is improved; andCanadians across the country can experience stories that bring Canada’s history to life.
The funding rollout details as well as its administration and implementation are listed in the attached backgrounder.
Partnering organizations and programs will provide more details on their specific funding components as soon as possible.
Quotes
“Strengthening our audio and audiovisual sectors is at the core of protecting Canada’s sovereignty, our culture and our languages. With this crucial support, we will provide direct funding and much-needed stability so that our country’s artists, storytellers, creative entrepreneurs and cultural organizations can continue creating Canadian content that reflects who we are and helps us remain masters of our destiny.”
–Marc Miller, Minister of Canadian Identity and Culture and Minister responsible for Official Languages
Quick Facts
In June, the government announced it would update the directions to the CRTC on regulating online streaming services, with a focus on affordability, and that it would invest $600 million to provide stability and support to Canada’s audio and audiovisual sectors.Canadian culture, including the music, audio and audiovisual sectors, are strategic assets and key economic drivers that directly contributed $69.1 billion to the GDP in 2025 and employed 687,824 people as of March 31, 2026.
Related Products
Budget 2026: Masters of our destiny – Backgrounder: Administration and implementation of $600 Million targeted support for Canada’s audio and audiovisual sectorsGovernment of Canada announces immediate support to strengthen Canadian culture and ensure Canadian content remains affordable
Associated Links
Budget 2026: Masters of our destiny Canada Media Fund Indigenous Screen Office program Canada Music Fund Northern Aboriginal Broadcasting Canada History Fund Telefilm Canada
Budget 2026: Masters of our destiny – Backgrounder: Administration and implementation of $600 Million targeted support for Canada’s audio and audiovisual sectors
Following the announcement of Budget 2026, the Honourable Marc Miller, Minister of Canadian Identity and Culture and Minister responsible for Official Languages, today announced the funding rollout of the $600 Million investment that will provide stability and direct support to Canada’s audio and audiovisual sectors while longer-term policy, regulatory and market conditions evolve.
The Government will focus on stabilizing Canada’s audio, audiovisual and news sectors while keeping Canadian culture accessible and affordable. It will help sustain public-interest programming, local and community media, official language minority community production, the production and promotion of Canadian and Indigenous content, and the continued operation of services of exceptional importance.
This list provides details of the funding administration and implementation.
This list provides details of the funding administration and implementation.
List of organizations and funding mechanisms that will distribute the funding support
Recipient
Funding allocation description
Funded
amount
Canada Media Fund Corporation
Certified Independent Production Funds, the Broadcasting Accessibility Fund, the Independent Local News Fund and Commercial Radio News Fund, the Community Radio Fund, the Broadcasting Participation Fund and Public Service Media
Canada Media Fund Corporation:
This funding will help sustain Canadian content creation and mitigate the impact of declining private-sector contributions from cable and satellite companies, as well as expected contributions from international streaming platforms. The Canada Media Fund Corporation will rapidly deploy the new funding through enhancements to existing programs and the introduction of new initiatives that will support the entire value chain of the industry: from training, to creation, to production, to promotion, to sector and business development. Priority areas will also include francophone programming, children and youth content, interactive digital media (IDM), distribution and export initiatives. As an independent not-for-profit, the Canada Media Fund Corporation will allocate these funds through its programs based on industry needs.
Various independents funds:
Delivered by the Department of Canadian Heritage, this funding will include:
Certified Independent Production Funds such as the Black Screen Office, Canadian Independent Screen Fund, Broadcasting Accessibility Fund, Bell Fund, Independent Production Fund, TELUS Fund, Quebecor Fund, Shaw Rocket Fund, Vox Fund and M.É.D.I.A Fund. These will support diverse, accessible and inclusive content and official languages minorities communities;
The Independent Local News Fund and Commercial Radio News Fund will sustain independent local television and commercial radio news, through the Canadian Association of Broadcasters; the Community Radio Fund will strengthen community radio through operational support and sector development;
Together, these investments will extend supported activities beyond content production to address priorities across the broader broadcasting ecosystem, including diversity and accessibility, local news, community radio and public participation in the broadcasting system; The Public Service Media component will be used to deliver additional support to Services of Exceptional Importance, such as the Canadian Public Affairs Channel, Aboriginal Peoples Television Network and TV5 Québec Canada. Funding will ensure the continued operation of these services through support for technology modernization, infrastructure renewal, digital transformation, programming, production, discoverability, accessibility and preservation. This funding would serve as a bridge toward the implementation of a Services of Exceptional Importance Fund.
Certified Independent Production Funds: $44M
Independent Local News Fund: $80M
Commercial Radio News Fund: $11.5M
Community Radio Fund: $7.5M
Services of exceptional importance: $42.1M
$213.4 million
$185.1 million
Indigenous Screen Office
The Indigenous Screen Office will support the Indigenous audiovisual sector and for the production, promotion and discoverability of Indigenous audiovisual content in Canada and abroad. The funding will help grow Indigenous content creation, support the development of this sector and increase international collaborations between Indigenous creators from Canada and abroad. The Indigenous Screen Office corporation, as an Indigenous-led and independent third party, will allocate funding through its programs based on industry needs.
$51 million
Canada Music Fund
Canadian Heritage’s Canada Music Fund will provide support for the production and promotion of Canadian and Indigenous music. This funding will be further distributed by the Canada Music Fund’s two current initial recipients, the Foundation Assisting Canadian Talent on Recordings (FACTOR) and Fondation Musicaction (Musicaction) and three new initial recipients: the Canadian Starmaker Fund, Fonds RadioStar, and the Indigenous Music Office (IMO).
FACTOR: $31.5M
Musicaction: $21.0M
Canadian Starmaker Fund: $5.7M
Fonds RadioStar : $3.8M
IMO : $5.0M
$67 million
Northern Aboriginal Broadcasting
Canadian Heritage will fund culturally relevant Indigenous radio and television content through its Northern Aboriginal Broadcasting program. The funding will benefit Indigenous broadcasters to continue preserving, promoting and revitalizing Indigenous languages and provide platforms for Indigenous audiences to discuss issues important to their communities.
$10 million
Canada History Fund
Through the Canada History Fund, Canadian Heritage will provide funding to support audiovisual programming and related costs.
Up to $5 million
Telefilm Canada
Telefilm Canada will allocate its funding to support the sustainability and growth of the audiovisual industry, as well as the competitiveness and international reach of Canadian and Indigenous feature films, with an audience-driven approach. As a Crown corporation, Telefilm Canada will receive funding through parliamentary appropriations.
$68.5 million
Total targeted support to Canada’s audio and audiovisual sectors in 2026-2027
$600 million
Note: In June, the government announced it would update the directions to the CRTC on regulating online streaming services, with a focus on affordability.
SOURCE Canadian Heritage
Technology
KeyStone Solutions Wins 2026 MSP 501 Vanguard Award for Innovation
Published
5 hours agoon
November 8, 2026By

KeyStone Solutions, a managed IT and cybersecurity provider based in Cleveland, Tennessee, has won the 2026 MSP 501 Vanguard Award from Channel Partners and MSP Summit. The award recognizes managed service providers at the forefront of technology and service innovation.
CLEVELAND, Nov. 8, 2026 /PRNewswire-PRWeb/ — KeyStone Solutions, LLC has won the 2026 MSP 501 Vanguard Award from Channel Partners and MSP Summit. The award was presented Sept. 30 at the MSP 501 Gala during the MSP Summit in Orlando, Fla.
“Our team has done tremendous work over the last year to modernize and automate our service delivery.” Preston West, CEO, KeyStone Solutions
The MSP 501 Special Awards are application-based. A panel of industry leaders, including top global MSPs, analysts and past award recipients, judges each entry.
The Vanguard Award goes to a company at the forefront of technology and service innovation in the managed services channel, including AI, cybersecurity and cloud. Winners use original thinking to meet clients’ needs and to drive their own financial success.
“We are honored to be recognized. Our team has done tremendous work over the last year to modernize and automate our service delivery. I couldn’t be prouder of their hard work and their focus on the customer experience,” said Preston West, CEO of KeyStone Solutions.
“To qualify for the Vanguard award, companies had to document what they have done in terms of innovative and original thinking in meeting clients’ needs and how this has contributed to the company’s overall financial success,” said Dave Raffo, MSP 501 editor who oversees the awards process. “These are among the most innovative MSPs in the world.”
“The MSP 501 Special Awards represent the pinnacle of achievement in the managed services industry, recognizing organizations and individuals who have demonstrated extraordinary leadership, innovation, and impact,” said Robert DeMarzo, VP Content, Informa Channels, which conducts the MSP 501 survey each year.
About KeyStone Solutions, LLC
KeyStone Solutions is a managed IT and cybersecurity company based in Cleveland, Tennessee. Since 2006, KeyStone has worked as the IT department for hundreds of small and mid-sized businesses, with customers headquartered in 15 states. Its ITTaaS® (IT Team as a Service) offering delivers help desk support and cybersecurity, with optional vCISO and GRC services, and the company now provides AI services. KeyStone holds a SOC 2 Type II report and is a Microsoft 365 Solutions Partner. Learn more at keystone.solutions.
About Channel Partners, MSP Summit and the MSP 501
Channel Partners Conference & Expo and MSP Summit serve the global community of technology advisors, managed service providers, channel partners and technology suppliers, and run the MSP 501, which honors the world’s top-performing managed service providers. Learn more at themspsummit.com.
Media Contact
Richard King, KeyStone Solutions, 1 4234646424, rking@keystone.solutions, www.keystone.solutions
Dave Raffo, Informa, david.raffo@informa.com, informa.com
View original content:https://www.prweb.com/releases/keystone-solutions-wins-2026-msp-501-vanguard-award-for-innovation-302932350.html
SOURCE KeyStone Solutions


Fibocom LTE Cat.1 bis Modules: Starlink DTC Field Test Report
Budget 2026: Masters of our Destiny – Minister Miller announces the rollout of $600 million targeted support to Canada’s audio and audiovisual sectors

Illia Polosukhin: Why People Want Control Back From AI Labs | Token2049

Send Rakhi to UK swiftly with UK Gifts Portal

Whiteboard Series with NEAR | Ep: 45 Joel Thorstensson from ceramic.network

Nullmax and Renesas Forge Strategic Partnership to Deliver Competitive ADAS Solutions for the Global Market

Why You Should Build on #NEAR – Co-founder Illia Polosukhin at CV Labs
Whiteboard Series with NEAR | Ep: 45 Joel Thorstensson from ceramic.network

NEAR End of Year Town Hall 2021: The Open Web World, MetaBUILD 2 Hackathon and 2021 recap
Trending
-

 Technology2 days ago
Diamond Foundry Announces First-Ever D200mm Single-Crystal Diamond
-

 Near Videos4 days ago
Where AI money lands in crypto
-

 Technology4 days ago
Finshape launches Agentic DBOS: agentic AI already supporting digital banking projects
-

 Technology3 days ago
OpenAssets and Digital Asset Partner to Modernize Capital Markets Infrastructure
-

 Technology4 days ago
When Trade Reaches New Markets, Money Has to Keep Pace
-

 Coin Market3 days ago
Crypto exchanges tout cold storage ratios after Binance attack
-

 Technology3 days ago
2026 World Internet Conference Wuzhen Summit Opens
-

 Technology3 days ago
ASTRI Establishes Advisory Board for Smart Mobility Technology Alliance