Technology
Crush Security Launches Crush Dollar Exposure, Turning Cyber Risk Into Dollars and Showing Which Security Investments Reduce It Most
Published
5 hours agoon
By
New financial risk intelligence capability uses FAIR-informed modeling, Monte Carlo analysis and security data to help CISOs and CFOs quantify cyber exposure, prioritize remediation and communicate financial risk to executive leadership.
SCOTTSDALE, Ariz., Oct. 21, 2026 /PRNewswire/ — Crush Security today announced the launch of Crush Dollar Exposure, a new capability within its cybersecurity intelligence platform that translates cyber risk into financial exposure and helps organizations identify which security improvements can deliver the greatest reduction in potential financial loss.
For years, cybersecurity teams have measured their environments through vulnerabilities, risk scores, compliance percentages and control gaps. While valuable to security operations, those measurements often fail to answer the fundamental questions that executives and boards need answered:
How much could our cybersecurity weaknesses cost the business, and where should we invest to reduce that exposure?
Crush Dollar Exposure is designed to answer those questions by connecting an organization’s security posture, control coverage, threat intelligence and industry financial loss data to a quantitative view of cyber risk. The result is a financial perspective that enables security and business leaders to evaluate potential losses, compare remediation priorities and make more informed investment decisions.
From Technical Risk Scores to Financial Decisions
Traditional cybersecurity assessments often produce long lists of findings ranked by technical severity. But the most technically severe vulnerability is not necessarily the one that represents the greatest potential financial loss to the organization.
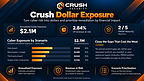
Crush Dollar Exposure changes the decision-making process by evaluating security gaps through their estimated contribution to financial risk. The capability provides four principal measurements:
Annualized Financial Exposure: An estimate of potential annual cyber losses, expressed in dollars.Financial Exposure Relative to Revenue: A view of modeled cyber exposure in relation to the organization’s annual revenue, providing business context.Value-at-Risk Analysis: Potential loss thresholds at selected probability levels, supported by loss-exceedance curves that illustrate the range of possible financial outcomes.Financially Prioritized Remediation: Security control gaps ranked by their modeled contribution to financial exposure, helping teams identify where remediation may reduce the most risk.
Rather than simply reporting that a security control is missing or a vulnerability is critical, Crush Dollar Exposure helps organizations understand the potential financial consequences and prioritize corrective action accordingly.
Connecting Every Security Gap to Business Impact
One of the capability’s key differentiators is its ability to connect security control weaknesses to modeled loss scenarios and financial consequences.
For example, a security team evaluating investments in identity protection, endpoint security and vulnerability remediation can use the model to determine which weaknesses contribute most significantly to estimated financial exposure. This allows security leaders to move beyond asking which problem is technically most severe and begin asking which investment is likely to provide the greatest financial risk reduction.
The analysis also connects control gaps to underlying loss scenarios, helping organizations understand how multiple weaknesses may contribute to the same business risk. For CFOs and executive teams, this provides a more financially grounded way to evaluate cybersecurity spending. For CISOs, it creates a defensible framework for explaining security priorities and communicating their potential business impact.
Transparent, Reproducible Risk Modeling — Not a Black-Box AI Score
Crush Dollar Exposure uses a quantitative methodology informed by the Factor Analysis of Information Risk (FAIR) framework and Monte Carlo simulation to model possible financial losses.
The methodology incorporates security control coverage, industry-relevant threat activity, recognized adversary techniques, organizational characteristics and established financial loss reference data.
Unlike opaque risk-scoring approaches, the capability is designed to make the assumptions, data inputs and modeled loss scenarios underlying its financial estimates visible and reviewable. Although Crush Security’s broader platform includes Cassandra, its AI-powered security advisor, the financial risk calculations themselves rely on defined quantitative modeling rather than generative AI.
The capability distinguishes between uncertainty in modeled financial outcomes and confidence in the quality of supporting data, helping executives understand both the estimated exposure and the limitations of the underlying analysis. This transparency is intended to support repeatable analysis, auditability and more defensible conversations with boards, regulators and financial stakeholders.
Giving CISOs and CFOs a Common Language
“Cybersecurity leaders are constantly asked to justify their budgets, but we’re still presenting information to boards that doesn’t directly answer the questions they’re asking,” said Josh Jones, CEO and Co-Founder of Crush Security. “Boards don’t just want to know how many vulnerabilities you have or how many security tools you’ve deployed. They want to understand what the risk could cost the business, where their money is going, and whether those investments are making a measurable difference.”
“With Crush Dollar Exposure, we’re connecting cybersecurity decisions to financial outcomes. Our goal is to give every CISO the ability to walk into a board meeting and explain their organization’s estimated financial exposure, identify the gaps driving it, and show which actions have the greatest potential to reduce that risk.” -Joshua Jones, CEO-
Built on the Crush Security Intelligence Platform
Crush Dollar Exposure extends Crush Security’s intelligence platform, which brings together vendor, control, compliance and threat data to support security investment decisions.
Powered by Cassandra, the platform helps organizations identify coverage gaps, compare technology and vendors, and optimize cybersecurity spending.
Risk calculations are performed within each customer’s data environment, with customer-specific information remaining within its designated security boundary. Anonymized and aggregated industry reference information supports comparative risk modeling.
Availability
Crush Dollar Exposure is available now within the Crush Security platform. Organizations interested in quantifying their financial cyber exposure, evaluating remediation priorities or scheduling a demonstration can visit www.CrushSecurity.com. Access information is available directly from Crush Security.
About Crush Security
Crush Security is a veteran-owned cybersecurity technology and advisory company headquartered in Scottsdale, Arizona.
Its proprietary intelligence platform, advisory services and cybersecurity procurement data help customers make data-driven technology purchasing decisions leveraging Crush Security’s resell capabilities.
Cassandra, its AI-powered advisor, unifies security, vendor and compliance intelligence to identify gaps, optimize investments, quantify risk and evaluate solutions to shorten the decision time and accuracy for each project.
Crush Security’s core intelligence platform is currently included at no separate subscription cost with eligible customer engagements.
Website: www.CrushSecurity.com
View original content to download multimedia:https://www.prnewswire.com/news-releases/crush-security-launches-crush-dollar-exposure-turning-cyber-risk-into-dollars-and-showing-which-security-investments-reduce-it-most-302914088.html
SOURCE Crush Security Group Inc
You may like
Technology
Anrok launches MCP server, putting your tax data inside the AI tools your team already uses
Published
2 minutes agoon
October 21, 2026By
Ask in plain language, get an answer that spans your billing system and Anrok, and act on it without opening a dashboard.
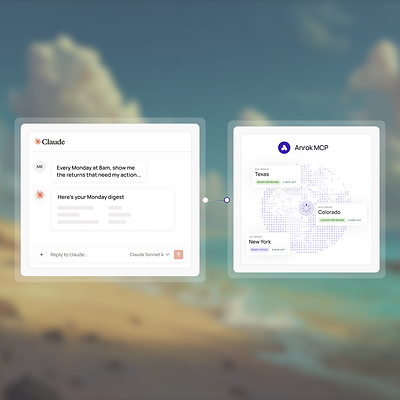
SAN FRANCISCO, Oct. 21, 2026 /PRNewswire/ — Anrok, the AI-native tax infrastructure for global commerce, today launched the Anrok MCP. It is a direct connection between your Anrok account and the AI assistants your team already works in, including Claude, ChatGPT, Cursor, and VS Code. Your team can read transactions, filings, exposure, customers, exemption certificates, and products, then act on what it finds without leaving the conversation.
Finance teams adopted AI assistants faster than their finance systems. A controller can ask an assistant to draft a memo or model a scenario. But to answer, “did we collect the right tax in July?” they close the assistant, open a dashboard, run an export, and build a spreadsheet. Anrok believes your tax data shouldn’t stay behind a login.
Anrok MCP puts tax data in the same thread as everything else your assistant can reach, including your billing system, your inbox, and your spreadsheets.
“Finance teams are increasingly doing their work directly with AI agents and their tax data should be in there with them,” said Brad Silicani, CEO at Anrok. “Ask it to reconcile your billing system and Anrok, and you get the reconciliation in minutes for your close. The AI does the thinking, and Anrok MCP exposes the tools. It’s the same platform either way, and it’s accurate underneath.”
What your team can do
Anrok MCP includes 30+ tools across transactions, filings, exposure, customers, exemption certificates, and products. Your team can:
Reconcile Anrok against your billing system and find the gap before you remit.Pull a revenue or transaction answer without building a report.Review a filing before Anrok submits it and avoid the amended return.Debug a single transaction without opening a support ticket.Get a recommended tax category for a new SKU, then map it so it never falls through again.Catch exemption certificates before they lapse.
The MCP also writes. It can create a product, create a customer, create or update a transaction, and upload a certificate. Every write shows what moved, so you can check it.
One platform behind one connection
Anrok MCP is part of Headless Tax, the way into Anrok’s platform through the Anrok APIs and MCP. Behind it, one platform runs all five tax jobs: monitor and manage, register, calculate, file and remit, and reconcile and audit. That includes reconciliation, which no other tax platform has built in. One source of truth means one connection reaches your transactions, filings, exposure, customers, and certificates. The same intelligence powers Anrok across the dashboard, the API, and your agents.
“Anrok’s MCP cut our monthly Stripe-to-Anrok reconciliation from 4 hours to 30 minutes.” —Christie Perez, Indirect Tax Manager at Webflow
Availability
Anrok MCP is available now to Anrok customers. Connect from your AI tool’s connector settings, approve the scopes, and start asking. Documentation is at https://apidocs.anrok.com/mcp/.
About Anrok
Anrok is the AI-native tax infrastructure for global commerce. More than 5,500 users run sales tax and VAT/GST compliance on Anrok across 150+ countries, with more than $100B in processed volume. One platform runs all five compliance jobs, monitoring, registration, calculation, filing and remittance, and reconciliation, which no other tax platform has built in. Teams reach it however they work, in the product with Anrok Atlas, through the Anrok APIs, or by handing the job to an agent. The result is every tax dollar owed, collected, so tax becomes a pass-through instead of an expense.
Media contact
Emilie Murphy
emilie.murphy@anrok.com
View original content to download multimedia:https://www.prnewswire.com/news-releases/anrok-launches-mcp-server-putting-your-tax-data-inside-the-ai-tools-your-team-already-uses-302915878.html
SOURCE Anrok
Technology
Alternative Data Market to Reach USD 40.35 Billion by 2035 as AI Developers and Corporations Expand Data Buying, Credence Research Finds
Published
3 minutes agoon
October 21, 2026By
LONDON, Oct. 21, 2026 /PRNewswire/ — Credence Research Inc. has added a new global Alternative Data Market study to its market intelligence portfolio, examining the competitive, technological and regulatory factors shaping demand through 2035.
The global alternative data market was valued at USD 6.32 billion in 2025 and is projected to increase to USD 7.56 billion in 2026 before reaching USD 40.35 billion by 2035, according to Credence Research. The forecast represents a 20.37% compound annual growth rate from 2025 to 2035. All market sizes, segment shares and regional shares are Credence Research estimates.
Key Takeaways
Credence Research estimates 2025 revenue of USD 6.32 billion and a 2035 market value of USD 40.35 billion, equivalent to 20.37% annualized growth over 10 years.North America represented 57.3% of modeled global value in 2025.Card and receipt transactions led the data type category with a 22.4% share.Hedge funds accounted for 24.6% of the end user category.Web-scraped data is forecast to grow at 24.00% annually, while Technology and AI developers is projected at 28.50%.The analysis distinguishes market revenue from adjacent products and services to avoid treating unrelated spending as part of the addressable market.
Scope & Segmentation – Alternative Data Market
The study measures licensed nontraditional datasets used for investment research, commercial intelligence and AI applications, including card and receipt panels, web traffic, app use, web-scraped information, geolocation, satellite data and sentiment feeds. Conventional market prices, ratings, cloud storage and consulting fees are excluded. Revenue is allocated to the buyer geography and is expressed in current U.S. dollars. The report evaluates the commercial drivers, market restraints, supplier positions and technology transitions affecting this defined market.
By data type: Card and receipt transactions; Web traffic and app usage; Web-scraped data; Geolocation and foot traffic; Satellite and weather data; Social and sentiment data; Other ESG, employment and B2B data.By end user: Hedge funds; Asset managers and investment institutions; Retail and consumer companies; Technology and AI developers; Other corporates and public sector.By region: North America; Europe; Asia Pacific; Latin America; Middle East and Africa.
Explore the full report: https://www.credenceresearch.com/report/alternative-data-market
Why This Report Matters
Defines the revenue boundary around purchased information rather than bundling unrelated analytics software and financial reference data.Compares investment-firm demand with newer corporate and AI developer use cases, including the privacy and licensing requirements that shape adoption.Provides a framework for evaluating vendor quality, consent, geographic coverage and data reliability before buyers commit to long-term contracts.
Market Overview
Alternative data vendors increasingly sell the same underlying information to different buyer groups. Quantitative funds use transaction, web and location panels to estimate business performance before quarterly filings. Retailers apply those signals to site selection and competitor analysis, while AI developers license web and app information for model training and retrieval workflows.
The forecast reflects a modeled change in buyer adoption, supplier economics and product mix rather than a guarantee of future transactions. Credence Research evaluates these mechanisms alongside recent regulatory and corporate developments. Decision-makers should distinguish disclosed company announcements from estimates of total market revenue.
Market Insights
Base year: 2025; forecast horizon: 2035; modeled CAGR: 20.37%.Largest modeled geography: North America (57.3% of 2025 value).Leading categories: Card and receipt transactions (22.4%) and Hedge funds (24.6%).Fast-growth categories: Web-scraped data (24.00% CAGR) and Technology and AI developers (28.50% CAGR).Geographic and segment shares are proprietary Credence Research model outputs, not audited vendor market-share disclosures.
Key Attributes
Attribute
Details
Historical period
2018–2025, as listed in the report
Base year
2025
Forecast period
2025–2035
Market size, 2025
USD 6.32 billion
Estimated market size, 2026
USD 7.56 billion
Market size forecast, 2035
USD 40.35 billion
Revenue CAGR, 2025–2035
20.37 %
Coverage
Global
Segments covered
Data type; End user
Geographies
North America; Europe; Asia Pacific; Latin America; Middle East and Africa
Market Segmentation Analysis
By data type
Card and receipt transaction panels led data types with 22.4% of 2025 spending because they can help estimate consumer revenue before corporate reporting. Web-scraped information is the fastest-growing data type in the model, supported by price monitoring, job-posting analysis and licensed AI data feeds.
By end user
Hedge funds accounted for 24.6% of 2025 end-user spending. Technology and AI developers have the faster modeled growth rate as demand expands from trading signals into model training, retrieval systems and agent-ready data services.
Card and receipt transactions held 22.4% of the data type segment in 2025, while Hedge funds led the end user split at 24.6%. Credence Research forecasts faster growth for Web-scraped data (24.00% a year) and Technology and AI developers (28.50% a year). These figures represent market estimates and are not company-reported results.
Market Drivers and Opportunities
Faster commercial signals
Card-spending, store-visit and app-usage panels can reveal operating trends before financial results are released. Funds buy such feeds to build forecasts, while retailers use them to compare competitors and local markets. Data coverage, representativeness and historical consistency determine whether these signals justify recurring subscription fees.
AI training and agent-ready feeds
Model developers are seeking licensed and documented sources of web, app and commerce data. Vendors that deliver clean feeds through APIs and data marketplaces can reach customers outside the hedge fund sector. Contracts for model training also require clear rights to collect, transform and reuse source information.
Distribution through existing research platforms
Financial-information terminals and cloud marketplaces reduce the engineering work required to test a new dataset. Bloomberg’s 2025 integration of Similarweb traffic data is one example of this route to market. Distribution can broaden adoption, although vendors may surrender part of the economics to aggregators.
Regional Analysis
Credence Research estimates the following shares of global 2025 revenue: North America 57.3%; Europe 22.1%; Asia Pacific 14.6%; Latin America 3.1%; Middle East and Africa 2.9%. These allocations sum to 100% and reflect buyer location rather than the location of manufacturing or company headquarters.
North America led the market in 2025, supported by its established buyer base, supplier relationships and industry infrastructure. Europe and Asia Pacific are also material demand centers, although the competitive mix and procurement requirements vary by country. The smaller regions may record high percentage growth from a limited starting base, and such rates should not be mistaken for leadership in absolute spending.
North America benefits from a dense concentration of quantitative funds, financial data platforms and AI developers. European buyers must navigate stringent personal-data rules, which increases demand for licensed and aggregated feeds. Asia Pacific adds demand from financial centers and domestic digital platforms but faces varying localization requirements.
Market Challenges
Sensitive geolocation and transaction data create privacy, consent and national-security concerns. U.S. enforcement actions and cross-border data restrictions make diligence a core purchase requirement. Panel drift, incomplete histories and nonrepresentative samples can undermine the value of apparently timely signals; a faster feed is not necessarily a better forecast.
Buyers should also evaluate the total cost of adoption, interoperability with existing systems, vendor continuity and country-specific compliance obligations. Those factors can lengthen purchasing decisions even where the long-term growth thesis remains intact. The study distinguishes these commercial constraints from the market forecast itself.
Future Outlook
North America holds the largest modeled share because it hosts many hedge funds, data vendors and AI companies. Asia Pacific has the fastest forecast regional growth as investment institutions and local digital platforms expand. The strongest opportunities lie in licensed, traceable and AI-ready datasets that meet regulatory and quality standards.
Through 2035, suppliers that convert product capabilities into repeatable deployments, transparent pricing and reliable support should be better positioned than firms relying only on early demonstrations. Credence Research expects growth to vary across customer types and geographies rather than advance evenly each year.
Competitive Landscape
The market includes established multinational suppliers and specialized technology or service providers. Competition centers on product performance, customer relationships, integration capabilities, delivery reliability and the ability to meet sector-specific standards. The companies listed below participate in different parts of the value chain; their inclusion does not imply identical offerings or a verified ranking by market share.
Competitive analysis should distinguish vendors that directly sell the products or services in the defined scope from adjacent technology providers and end users. Credence Research uses supplier disclosures and industry evidence to assess participation. Comparable revenue for the narrow market definition is rarely disclosed, so this release does not assign unsupported individual company shares.
Key Players
BloombergS&P Global Market IntelligenceLSEGFactSetMoody’sSimilarwebPlacer.aiPlanet LabsYipitDataConsumer EdgeM ScienceThinknum
Recent Developments
June 2025: Bloomberg made Similarweb web-traffic analytics available through the Bloomberg Terminal ALTD function alongside other alternative datasets.
January 2025: The U.S. Federal Trade Commission finalized its order restricting Gravy Analytics and Venntel from selling sensitive location data.
Report Coverage
The full study covers market size and forecast, competitive conditions, value-chain structure, product and application segmentation, regional demand, market drivers, restraints, opportunities and regulatory developments. It provides a 2025 baseline and 2035 outlook and identifies areas where supplier disclosures support, but do not independently establish, Credence Research market estimates.
Explore the full report: https://www.credenceresearch.com/report/alternative-data-market
Chapter 1 Market Segmentation
Chapter 2 Introduction
Chapter 3 Executive Summary
Chapter 4 Global Alternative Data Market Trends and Developments
Chapter 5 Global Alternative Data Market Production, Supply and Demand Analysis
Chapter 6 Global Alternative Data Market Pricing Analysis
Chapter 7 Global Alternative Data Market Dynamics
Chapter 8 Global Alternative Data Value Chain Analysis
Chapter 9 Global Alternative Data Market Regulations and Policies
Chapter 10 Global Alternative Data Market Hotspots and Opportunities
Chapter 11 Global Alternative Data Market Outlook, 2025-2035
Chapter 12 Global Alternative Data Market Segmentation and Outlook
Chapter 13 Global Alternative Data End-Use and Application Market Outlook
Chapter 14 Global Alternative Data Geographic Market Outlook, 2025-2035
Chapter 15 Global Alternative Data Technology, Innovation and Sustainability Outlook
Chapter 16 Global Alternative Data Market Key Strategic Imperatives
Chapter 17 Competition Outlook
Chapter 18 Company Profiles
Chapter 19 Disclaimer
Related Reports
Insurtech MarketBlockchain in Media and Entertainment MarketDigital Logistics MarketArtificial Intelligence in Automotive MarketAI-Based 3D Vision System Market
About Us
Credence Research Inc. is a global market intelligence and consulting firm founded in 2015. It delivers market insights, quantitative analysis and strategic guidance to business leaders, investors, governments and nonprofit organizations. The company helps clients evaluate market opportunities, understand competitive dynamics and make informed strategic decisions.
Credence Research produces industry studies covering market size, forecasts, growth drivers, market trends and competitive landscapes. Its services also include customized research, commercial due diligence and go-to-market advisory. Findings draw on primary and secondary research, expert input and analytical modeling.
Contact Us
Credence Research Inc.
Tower C-1105, S 25, Akash Tower
Vishal Nagar, Pimple Nilakh, Haveli
Pune – 411027, India
USA: +1-888-600-6441
Email: sales@credenceresearch.com
Website: www.credenceresearch.com
View original content to download multimedia:https://www.prnewswire.co.uk/news-releases/alternative-data-market-to-reach-usd-40-35-billion-by-2035-as-ai-developers-and-corporations-expand-data-buying-credence-research-finds-302915881.html
Technology
TECHNATION Appoints New Board Leadership and Welcomes Industry Leaders to National Board
Published
3 minutes agoon
October 21, 2026By
TORONTO, Oct. 21, 2026 /CNW/ — TECHNATION, Canada’s national technology industry association, is pleased to announce the appointment of Sylvie Ouellette as Chair and Colin McIsaac as Vice Chair of its National Board of Directors.
Sylvie Ouellette is President and Co-Founder of Versatil BPI Inc., a Canadian-owned, women-led technology SME based in the National Capital Region, specializing in data, artificial intelligence, and security intelligence. She has more than 30 years of industry experience, including senior executive roles at Electronic Data Systems and Hewlett-Packard. As Chair, she brings both multinational leadership, including representing TECHNATION at the last two G7/TECH7 summits, and firsthand experience building a Canadian technology company.
Colin McIsaac is the Vice-President, North America Commercial Sales at Lenovo, responsible for strategy and performance across the NA VLB Segment and Canada’s Public Sector business. A prominent voice on the North America Senior Leadership Team, he oversees sales, operations, culture, and P&L execution to ensure Lenovo consistently delivers industry‑leading value for customers. Under his leadership, the team brings Lenovo’s complete portfolio of hardware, software, and services to market, fueling growth through innovation, customer partnership, and operational excellence.
Sylvie and Colin have been active members of TECHNATION’s Board of Directors for several years, serving on the Executive Committee and Governance Committee, respectively.
“We are pleased to welcome Sylvie as Chair and Colin as Vice Chair to TECHNATION’s National Board of Directors,” said Kevin d’Entremont, President and CEO of TECHNATION. “As seasoned members of our National Board, they have been engaged in shaping the focus of TECHNATION in supporting the full technology ecosystem in Canada. Their combined expertise, leadership, and commitment to advancing Canada’s technology ecosystem will be invaluable as we continue to advance the priorities that matter most to the sector and to Canada’s digital future.”
In addition to these appointments, TECHNATION is pleased to welcome four industry leaders to its Board of Directors:
Heather Black, Regional Vice-President, Canadian Public Sector Leader, Palo AltoPeter Kelcey, General Manager, Customer Success Lead, Microsoft CanadaErin O’Halloran, Vice President & General Manager, Oracle Health CanadaRaj Thuppal, Chief Digital Officer – Public Sector, ServiceNow Canada
These appointments come at a pivotal moment for Canada, as governments and businesses accelerate the adoption of digital technologies that are transforming how the economy operates and grows.
“I am honoured by the trust my fellow Board members have placed in me to lead TECHNATION at such a defining moment for Canada,” said Ouellette. “As technology reshapes our economy, national security, and global competitiveness, we must strengthen Canada’s capacity to innovate, advance responsible AI, and ensure Canadian businesses across the full ecosystem help shape our digital future. I look forward to working with our members and government partners to turn collaboration into action that delivers meaningful value for Canadians.”
Together, these appointments strengthen TECHNATION’s commitment to bring industry expertise to inform public policy, champion member priorities, and advance initiatives that support Canada’s digital and economic growth. Their leadership will help drive key priorities including digital transformation, procurement reform, workforce development, and Canada’s long-term competitiveness.
TECHNATION also extends its sincere thanks to outgoing Board Chair, Lloyd Switzer, retired Chief Procurement Officer at TELUS, for his leadership and dedication to the board. “Lloyd has been an invaluable leader at TECHNATION, guiding the association through a period of executive transition, while bringing a strong industry perspective through his role as Chief Procurement Officer at TELUS,” said d’Entremont. “While his retirement marks the end of an exceptional chapter, he has ensured a smooth transition and a bright future for our association and Canada’s tech sector.”
TECHNATION’s National Board is comprised of senior executives from across Canada’s technology landscape, representing both Canadian tech firms and global enterprises with significant operations and investments in Canada. A full list of TECHNATION’s National Board of Directors can be found at www.technationcanada.ca.
About TECHNATION
TECHNATION is Canada’s authoritative technology industry association, representing the full spectrum of Canada’s tech ecosystem, from agile innovators to domestic and global tech companies. Trusted by both industry and government, TECHNATION is the neutral connector, convener and catalyst powering a digital future and positioning Canada as a global tech leader. Together with our members, we shape tech policy and insights, deliver forums to drive public-private collaboration, foster inclusive workforce development, and support global expansion. Learn more at www.technationcanada.ca.
SOURCE TECHNATION Canada
Anrok launches MCP server, putting your tax data inside the AI tools your team already uses
Alternative Data Market to Reach USD 40.35 Billion by 2035 as AI Developers and Corporations Expand Data Buying, Credence Research Finds
TECHNATION Appoints New Board Leadership and Welcomes Industry Leaders to National Board
Send Rakhi to UK swiftly with UK Gifts Portal
Whiteboard Series with NEAR | Ep: 45 Joel Thorstensson from ceramic.network
Nullmax and Renesas Forge Strategic Partnership to Deliver Competitive ADAS Solutions for the Global Market
Why You Should Build on #NEAR – Co-founder Illia Polosukhin at CV Labs
Whiteboard Series with NEAR | Ep: 45 Joel Thorstensson from ceramic.network
NEAR End of Year Town Hall 2021: The Open Web World, MetaBUILD 2 Hackathon and 2021 recap
Trending
-
Technology4 days agoHighland and Bath Counties, Virginia Go Live on a Shared Caliber Hosted CAD Environment
-
Technology4 days agoJinkoSolar Unveils Tiger Neo 5.0 All-Black Residential Solar Module with 25.52% Efficiency
-
Near Videos5 days agoWhat if you could build a skyscraper with one prompt?
-
Technology4 days agoBioethanol from human hair – Indian start-up’s solution to rising prices of grains and sugar
-
Technology3 days agoGMIF2026: AI Inference Powers the “Token Factory” and Drives System-Level Rethinking of Memory & Storage
-
Technology3 days agoLinktel Technologies Highlights Breakthrough 1.6T LPO Performance & Strong Market Pull at OCP 2026
-
Technology3 days agoTruecaller announces preliminary numbers for the third quarter 2026
-
Coin Market2 days agoWorld Liberty’s USD1 stablecoin sheds $400M in market cap in two weeks