Connect with us

Technology

Whoscall, GASA and Mastercard Release the 2026 Asia Scam Report: Hong Kong

Published

on

More Than 80% of Hong Kong Respondents Encountered Scams; Phone Calls and SMS Remain the Leading Channels and bank account transfers by scammers is significantly above the Asia average at 43%

Impersonation Scams Are the Most Common, While More Than 60% of Victims Have Been Scammed More Than Once

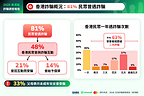
HONG KONG, Oct. 28, 2026 /PRNewswire/ — The Global Anti-Scam Alliance (GASA), Whoscall, the anti-scam app developed by TrustTech company Gogolook, and Mastercard have jointly released the 2026 Asia Scam Report: Hong Kong. The report examines how people in Hong Kong encounter scams, the tactics scammers use, how victims are asked to pay, and the effects of being scammed. It finds that 81% of respondents encountered a scam in the past year, while 48% interacted with a scammer. Phone calls and SMS remain the most common points of contact, and WhatsApp leads among individual digital platforms.

81% Encountered Scams; 27% of Victims Were Scammed Five Times

According to the report, 81% of Hong Kong respondents encountered a scam in the past year. Nearly half (48%) interacted with a scammer; 21% lost money following an interaction, and 14% provided personal information. The risk also extends to younger people: 33% of parents surveyed said their underage children had been scammed.

Among respondents who had been scammed, approximately 63% had been victimized more than once. More than a quarter (27%) said they had been scammed five times, while another 6% reported more than five incidents. These findings point to the need for continued support after an initial scam, including guidance that helps victims recognize and avoid subsequent attempts.

“One of the most striking findings in Hong Kong is the gap between confidence and vulnerability. While 76% of adults believe they can recognize a scam, nearly half of those exposed still interacted with one. Awareness is important, but consumers cannot be expected to carry the burden alone. Stronger prevention and intervention across the scam journey are essential,” said Brian D. Hanley, Chapter Director Asia-Pacific, Global Anti-Scam Alliance (GASA).

Jeff Kuo, Co-founder and CEO of Gogolook, said: “Scams now reach people through everyday channels, from phone calls and texts to messaging apps. More than 60% of scam victims in Hong Kong have been scammed more than once, highlighting the need for continued scam prevention education. Through our work with GASA, we hope to turn these findings into greater awareness and stronger protection. Gogolook will keep improving its technology to help people identify scams.”

Rajat Maheshwari, GASA Inaugural Chapter Chair and Senior Vice President, Strategic Growth (AP), Mastercard shared, “Hong Kong has put in place a strong range of measures to combat scams, offering valuable learnings for markets around the world. As scams continue to evolve, the GASA report highlights the opportunity to build on this progress through deeper collaboration across the wider ecosystem, supported by technology and a greater focus on preventive and behavior-based measures. Continued public-private partnership will be essential to staying ahead of emerging threats and helping protect people from scam-related losses.”

Top Three Scam Channels Revealed; WhatsApp Leads Digital Platforms at Nearly 70%

Phone calls (59%) and SMS (52%) were the channels through which Hong Kong respondents most commonly encountered scams, followed by messaging apps (47%) and email (41%). Compared with 2025, the share reporting scam contact by phone was unchanged, SMS fell by two percentage points, and messaging apps rose by four percentage points. The report also found that around 80% of scam contact occurred on platforms with private messaging capabilities, underscoring the need to scrutinize suspicious requests that move from calls or texts into private conversations.

Among individual digital platforms, WhatsApp ranked first at 68%. Hong Kong Police recently reported receiving around 50 cases of WhatsApp account hijacking in the first week of October, with losses totaling nearly HK$20 million. Many of the cases involved cryptocurrency or investment pretexts. Gmail (32%) and Facebook (28%) followed WhatsApp, while Instagram (22%) and Telegram (17%) also featured prominently. Whoscall advises people to verify a contact through a separate, trusted channel, even when a message arrives on a familiar platform or appears to come from a friend, business or public agency.

Impersonation Encountered by Over 80% of Respondents, Followed by Investment and Shopping Scams

Impersonation was the most widely encountered scam type, reported by 81% of Hong Kong respondents; 17% had interacted with someone carrying out such a scam. Scammers may pose as Hong Kong Police, the Department of Health or mainland law enforcement officials, claim that a person is implicated in a crime, and demand passwords or access to assets for a purported investigation. Others may impersonate banks, major telecommunications providers or online shopping platforms, using claims of account problems or order cancellations to obtain personal information, passwords or remote access to a device.

Investment scams followed at 78%, while shopping scams reached 71%. Respectively, 17% and 16% of respondents had interacted with scammers using these approaches. Other commonly encountered schemes included prize scams (68%), fake invoice scams (64%), identity theft (62%) and romance scams (61%). In addition, 55% had encountered offers claiming to help recover money lost to a scam. Such approaches warrant particular caution from people who have already suffered a loss.

Bank Transfers Are the Most Common Payment Method; Harm Extends Beyond Financial Loss

Among respondents who paid a scammer, 43% did so by bank transfer, above the Asia-wide average of 36%. Mobile payment apps and credit cards each accounted for 25%, followed by e-wallets at 24%. Physical or digital gift cards, cash, and payment tools within websites each accounted for 21%. The trend shows scammers favor immediate and irrevocable payment methods that increase in abuse rates in Hong Kong. This will require more advance interventions to secure these immediate payment rails in Hong Kong.

The report also examined the broader effects of scams on people in Hong Kong. Beyond financial loss, 33% said the experience had damaged their confidence and caused them to question themselves, 28% worried about being scammed again, and 23% had become less trusting of the internet or digital tools. The effects reached into daily life: 23% needed financial help from friends or family, and another 23% reported a greater need to borrow money. Both figures exceeded the Asia-wide averages.

When faced with a suspicious message or request, Whoscall recommends pausing before taking action and checking the sender’s identity using information from an official website. Anti-scam tools can also help assess unfamiliar numbers, links and messages. Anyone who has been scammed should seek help from the relevant authorities or organizations promptly and remain alert to subsequent offers to recover their money, which may be another scam attempt.

To help people navigate changing scam tactics, Whoscall offers more than caller identification. Its Check feature lets users assess suspicious phone numbers, URLs and screenshots in one place. Whether they receive an unfamiliar message or a promotional email, users can upload a screenshot or photograph a physical flyer for an AI-powered assessment of potential risks. They can also share the results with friends and family, helping others recognize suspicious content before they engage with it.

The full 2026 Asia Scam Report – Hong Kong is available on the GASA website:
https://gasa.org/knowledge-base?content_group=318467252980&page=1

For more information about the Global Anti-Scam Summit Asia 2026, visit:
https://events.gasa.org/gass-asia-2026

About Whoscall

The Whoscall app, a digital anti-scam tool, is designed to protect users across various scenarios from scams and spams, including phone calls, text messages, and links. With over 100 million downloads worldwide, it boasts the most comprehensive database in East and Southeast Asia, encompassing over 2.6 billion phone numbers, and collects data from partner ScamAdviser to form a leading digital anti-scam database. The Whoscall team has been dedicated to developing anti-scam technology for over a decade, employing AI to analyze and simulate the patterns of scam groups, proactively preventing the spread of scams. At the same time, Whoscall actively engages in building a community collaboration mechanism with its users, playing a role with societal impact in digital anti-scam services from educational initiatives, cross-sector collaboration to product innovation. Recognized and chosen for partnerships by the Taiwan National Police Agency, Thai Royal Police and NCSA, Royal Malaysia Police and CyberSecurity Malaysia, the Philippines Cybercrime Investigation and Coordinating Center, Financial Supervisory Service of South Korea, and local governments in Japan.

For more information, please refer to: https://whoscall.com/en

View original content to download multimedia:https://www.prnewswire.com/apac/news-releases/whoscall-gasa-and-mastercard-release-the-2026-asia-scam-report-hong-kong-302921783.html

SOURCE Whoscall; Gogolook

Continue Reading

Technology

LEO Satellite Market worth $43.37 billion by 2031 – Exclusive Report by MarketsandMarkets™

Published

on

By

DELRAY BEACH, Fla., Oct. 30, 2026 /PRNewswire/ — According to MarketsandMarkets™, the LEO satellites market is estimated at USD 12.82 billion in 2026 and is projected to reach USD 43.37 billion by 2031 at a CAGR of 27.6% during the forecast period.

Browse 300 market data Tables and 100 Figures spread through 350 Pages and in-depth TOC on ‘LEO Satellite Market – Global Forecast to 2031’

LEO Satellite Market Size & Forecast:

Market Size Available for Years: 2021–20312026 Market Size: USD 12.82 billion2031 Projected Market Size: USD 43.37 billionCAGR (2026–2031): 27.6%

LEO Satellite Market Trends & Insights:

The LEO satellites market is growing as satellite networks expand for communication, Earth observation, navigation, and defense applications. Developments in small satellite platforms, software-defined payloads, optical communication, and onboard data processing are helping operators improve coverage, reduce latency, and support a wider range of missions in low Earth orbit.By satellite mass, Small satellites are the fastest-growing segment due to the increasing deployment of LEO constellations for broadband communication, Earth observation, and defense applications. Their lower development and launch costs, shorter manufacturing cycles, and ability to be deployed in large constellations are supporting adoption among commercial operators, government agencies, and defense organizations.By application, Navigation satellites are the fastest-growing segment due to the rising demand for more accurate positioning, navigation, and timing services across transportation, defense, aviation, maritime, and autonomous systems. Increasing deployment of LEO-based navigation and PNT augmentation systems, along with the need for lower latency, stronger signal availability, and greater resilience than traditional navigation architectures, is supporting segmental growth.By customer type, Defense is the fastest-growing segment due to the increasing use of LEO satellites for secure communications, ISR, navigation support, and persistent monitoring. Rising defense investment in resilient space architectures, proliferated LEO constellations, and low-latency satellite networks is supporting adoption across military forces and defense agencies.By region, the Middle East is the fastest-growing region in the LEO satellites market, driven by rising investment in satellite communications, Earth observation, defense surveillance, and national space programs. Growing demand for secure connectivity across remote areas, expanding defense and border-monitoring requirements, and new satellite initiatives in countries such as the UAE and Saudi Arabia are supporting regional market growth due to increasing investment in drone detection across military bases, airports, borders, and critical infrastructure. Growing concerns around unauthorized drone activity and continued deployment of radar, RF, EO/IR, and multi-sensor systems are supporting regional growth.

Download PDF Brochure: https://www.marketsandmarkets.com/pdfdownloadNew.asp?id=252330251

LEO satellite operators are creating sustained demand through frequent replenishment and replacement of spacecraft. Satellites in low Earth orbit usually have shorter operating lives than larger satellites in higher orbits. Constellations therefore require regular launches to replace aging satellites, to maintain coverage and introduce upgraded payloads. Operators can also refresh technology faster as communication, processing and sensing requirements change. Planned deorbiting and debris mitigation requirements further increase the need for replacement satellites over time. This creates recurring demand for satellite platforms, propulsion systems, power systems, antennas and payloads. Large constellations also support repeat production, which allows manufacturers to maintain continuous assembly lines and improve production efficiency globally.

By customer type, the commercial segment is estimated to hold the second-largest market share in 2026.

The segment is supported by the growing deployment of LEO constellations for broadband, Earth observation, direct-to-device connectivity and data services. Commercial operators are benefiting from the scalable networks that allow capacity to be added as demand grows. Moreover, they also use standardized satellite buses and high-rate production to reduce costs and shorten deployment timelines. Large programs such as SpaceX Starlink and Amazon Project Kuiper are increasing satellite volumes and replacement demand. Earth observation companies are also deploying smaller satellites with shorter refresh cycles. These factors are supporting steady commercial demand across LEO satellite platforms, payloads, and related subsystems.

By frequency band, laser/optical band is expected to be the fastest-growing segment between 2026 and 2031.

The segment is expected to grow rapidly as LEO operators increase the use of optical inter-satellite links for high-capacity data transfer. Laser links allow satellites to exchange data directly in space without routing every transmission through ground stations. This reduces latency and improves network resilience. Optical links also avoid congestion in traditional RF spectrum and support higher data rates. Large constellations are increasingly adopting this architecture to move traffic across the network more efficiently. For instance, SpaceX Starlink is launching newer satellites using laser crosslinks for satellite-to-satellite communication.

Inquiry Before Buying: https://www.marketsandmarkets.com/Enquiry_Before_BuyingNew.asp?id=252330251

Europe is projected to be the largest LEO satellites industry during the forecast period.

Europe is expected to hold the largest market share due to strong government support, established satellite manufacturing capabilities, as well as growing sovereign connectivity programs. The region has a well-developed space ecosystem which is led by companies like Airbus, Thales Alenia Space, OHB, and Eutelsat OneWeb. Programs such as IRIS² are supporting the development of resilient satellite connectivity across the region. Europe also benefits from strong participation in ESA programs and a mature network of satellite subsystem suppliers. These factors are supporting sustained demand for LEO satellite platforms, payloads, and related subsystems.

Key Players in LEO satellites companies such as SpaceX (US), L3Harris Technologies (US), Lockheed Martin (US), Northrop Grumman (US), and Airbus Defence and Space (Netherlands).

Get 10% Free Customization on this Report: https://www.marketsandmarkets.com/requestCustomizationNew.asp?id=252330251

Browse Adjacent Market: Aerospace and Defence Market Research Reports &Consulting

See More Latest Aerospace and Defence Reports:

Solar Powered Drone Market Size, Share and Trends by Energy Architecture (Fully Solar-Electric UAV, Solar-Assisted Battery UAV), Drone Type (Small, Medium, Large), Operating Altitude, Application, and Region – Global Forecast to 2035

Space Cybersecurity Market Size, Share and Trends by Offering (Solutions (Network, Endpoint, Cloud, Application Security), Services), Platform (Satellites, Launch Vehicles, Ground Stations & Gateways), End User, Application, and Region – Global Forecast to 2031

About MarketsandMarkets™  

MarketsandMarkets™ has been recognized as one of America’s Best Management Consulting Firms by Forbes, as per their recent report.

MarketsandMarkets™ is a blue ocean alternative in growth consulting and program management, leveraging a man-machine offering to drive supernormal growth for progressive organizations in the B2B space. With the widest lens on emerging technologies, we are proficient in co-creating supernormal growth for clients across the globe.

Today, 80% of Fortune 2000 companies rely on MarketsandMarkets, and 90 of the top 100 companies in each sector trust us to accelerate their revenue growth. With a global clientele of over 13,000 organizations, we help businesses thrive in a disruptive ecosystem.

The B2B economy is witnessing the emergence of $25 trillion in new revenue streams that are replacing existing ones within this decade. We work with clients on growth programs, helping them monetize this $25 trillion opportunity through our service lines – TAM Expansion, Go-to-Market (GTM) Strategy to Execution, Market Share Gain, Account Enablement, and Thought Leadership Marketing.

Built on the ‘GIVE Growth’ principle, we collaborate with several Forbes Global 2000 B2B companies to keep them future-ready. Our insights and strategies are powered by industry experts, cutting-edge AI, and our Market Intelligence Cloud, KnowledgeStore™, which integrates research and provides ecosystem-wide visibility into revenue shifts.

MarketsandMarkets™ SalesPlay is an AI-driven Revenue Intelligence Co-Pilot designed to help revenue teams prioritize the right accounts, identify critical changes early, and surface opportunities ahead of demand, so pipeline builds naturally and deals close with greater consistency.

To find out more, visit www.MarketsandMarkets™.com or follow us on Twitter, LinkedIn and Facebook.

Contact:
Mr. Rohan Salgarkar
MarketsandMarkets™ INC.
1615 South Congress Ave.
Suite 103, Delray Beach, FL 33445
USA: +1-888-600-6441
Email: sales@marketsandmarkets.com
Visit Our Website: https://www.marketsandmarkets.com/
Research Insight: https://www.marketsandmarkets.com/ResearchInsight/leo-satellite-market.asp
Content Source: https://www.marketsandmarkets.com/PressReleases/leo-satellite.asp


View original content to download multimedia:https://www.prnewswire.com/news-releases/leo-satellite-market-worth-43-37-billion-by-2031—exclusive-report-by-marketsandmarkets-302924720.html

SOURCE MarketsandMarkets

Continue Reading

Technology

General Dynamics Reports Third-Quarter 2026 Financial Results

Published

on

By

Revenue $14.6 billion, up 12.9% versus prior yearDiluted EPS $4.49, up 15.7% versus prior year$1.7 billion cash from operating activities, 139% of net earnings6.8-to-1 book-to-bill, $220 billion backlog

RESTON, Va., Oct. 30, 2026 /PRNewswire/ — General Dynamics (NYSE: GD) today reported third-quarter 2026 operating earnings of $1.5 billion, and $4.49 per diluted share (EPS), on revenue of $14.6 billion. Compared with the year-ago quarter, revenue increased 12.9%, operating earnings increased 14.7%, and diluted EPS increased 15.7%. Operating margin of 10.5% was a 20-basis-point expansion from the year-ago quarter.

“Our business had exceptional third quarter results, with revenue growth across all four segments, robust bookings and solid operational performance,” said Phebe Novakovic, chairman and chief executive officer. “With the consistent growth in our backlog and our significant investment in our businesses over the last decade, we are poised to drive continued performance in the years to come.”

Cash and Capital Deployment

Cash provided by operating activities in the quarter totaled $1.7 billion, or 139% of net earnings. During the quarter, the company paid $429 million in dividends, invested $481 million in capital expenditures, and reduced total debt by $500 million. The company ended the quarter with $7 billion in total debt and $4.4 billion in cash and equivalents on hand.

Orders and Backlog

Orders received in the quarter totaled $93.8 billion in the defense segments, driven by large orders in the Marine Systems segment for Virginia- and Columbia-class submarines, and $5 billion in the Aerospace segment, for a total of $98.8 billion. Book-to-bill ratio, defined as orders divided by revenue, was 8.5-to-1 for the quarter for the defense segments, 1.4-to-1 for the Aerospace segment, and 6.8-to-1 on a company-wide basis.

Backlog at the end of the quarter was $220.3 billion. Estimated potential contract value, representing management’s estimate of additional value in unfunded indefinite delivery, indefinite quantity (IDIQ) contracts and unexercised options, was $50.4 billion. Total estimated contract value, the sum of backlog plus estimated potential contract value, was $270.7 billion.

About General Dynamics

Headquartered in Reston, Virginia, General Dynamics is a global aerospace and defense company that offers a broad portfolio of products and services in business aviation; ship construction and repair; land combat vehicles, weapon systems and munitions; and technology products and services. General Dynamics employs more than 120,000 people worldwide and generated $52.6 billion in revenue in 2025. More information is available at www.gd.com.

WEBCAST INFORMATION: General Dynamics’ financial results conference call will be held on Friday, October 30, 2026, at 9:00 a.m. EDT.  A link to the live webcast will be available at www.gd.com and will be available for replay following the call. Corresponding presentation slides will be available for download prior to the call.

This press release may contain forward-looking statements (FLS), including statements about the company’s future operational and financial performance, which are based on management’s expectations, estimates, projections and assumptions. Words such as “expects,” “anticipates,” “plans,” “believes,” “forecasts,” “scheduled,” “outlook,” “estimates,” “should” and variations of these words and similar expressions are intended to identify FLS. In making FLS, we rely on assumptions and analyses based on our experience and perception of historical trends; current conditions and expected future developments; and other factors, estimates and judgments we consider reasonable and appropriate based on information available to us at the time. FLS are made pursuant to the safe harbor provisions of the Private Securities Litigation Reform Act of 1995, as amended. FLS are not guarantees of future performance and involve factors, risks and uncertainties that are difficult to predict. Actual future results and trends may differ materially from what is forecast in the FLS. All FLS speak only as of the date they were made. We do not undertake any obligation to update or publicly release revisions to FLS to reflect events, circumstances or changes in expectations after the date of this press release. Additional information regarding these factors is contained in the company’s filings with the SEC, and these factors may be revised or supplemented in future SEC filings. In addition, this press release may contain some financial measures not prepared in accordance with U.S. generally accepted accounting principles (GAAP). While we believe these non-GAAP metrics provide useful information for investors, there are limitations associated with their use, and our calculations of these metrics may not be comparable to similarly titled measures of other companies. Non-GAAP metrics should not be considered in isolation from, or as a substitute for, GAAP measures. Reconciliations to comparable GAAP measures and other information relating to our non-GAAP measures are included in other filings with the SEC, which are available at investorrelations.gd.com.

EXHIBIT A

CONSOLIDATED STATEMENT OF EARNINGS – (UNAUDITED)

DOLLARS IN MILLIONS, EXCEPT PER SHARE AMOUNTS

Three Months Ended

Variance

October 4, 2026

September 28, 2025

$

%

Revenue

$                     14,566

$                     12,907

$     1,659

12.9 %

Operating costs and expenses

(13,039)

(11,576)

(1,463)

Operating earnings

1,527

1,331

196

14.7 %

Other, net

4

15

(11)

Interest, net

(45)

(74)

29

Earnings before income tax

1,486

1,272

214

16.8 %

Provision for income tax, net

(257)

(213)

(44)

Net earnings

$                       1,229

$                       1,059

$        170

16.1 %

Earnings per share—basic

$                         4.55

$                         3.93

$       0.62

15.8 %

Basic weighted average shares outstanding

270.2

269.2

Earnings per share—diluted

$                         4.49

$                         3.88

$       0.61

15.7 %

Diluted weighted average shares outstanding     

273.8

272.6


EXHIBIT B

CONSOLIDATED STATEMENT OF EARNINGS – (UNAUDITED)

DOLLARS IN MILLIONS, EXCEPT PER SHARE AMOUNTS

Nine Months Ended

Variance

October 4, 2026

September 28, 2025

$

%

Revenue

$                     42,141

$                     38,171

$     3,970

10.4 %

Operating costs and expenses

(37,734)

(34,267)

(3,467)

Operating earnings

4,407

3,904

503

12.9 %

Other, net

18

51

(33)

Interest, net

(163)

(251)

88

Earnings before income tax

4,262

3,704

558

15.1 %

Provision for income tax, net

(748)

(637)

(111)

Net earnings

$                       3,514

$                       3,067

$        447

14.6 %

Earnings per share—basic

$                       13.01

$                       11.41

$       1.60

14.0 %

Basic weighted average shares outstanding

270.2

268.8

Earnings per share—diluted

$                       12.83

$                       11.29

$       1.54

13.6 %

Diluted weighted average shares outstanding      

273.8

271.8


EXHIBIT C

REVENUE AND OPERATING EARNINGS BY SEGMENT – (UNAUDITED)

DOLLARS IN MILLIONS

Three Months Ended

Variance

October 4, 2026

September 28, 2025

$

%

Revenue:

Aerospace

$                  3,536

$                   3,234

$            302

9.3 %

Marine Systems

4,960

4,096

864

21.1 %

Combat Systems

2,386

2,252

134

6.0 %

Technologies

3,684

3,325

359

10.8 %

Total

$                14,566

$                 12,907

$         1,659

12.9 %

Operating earnings:                                                

Aerospace

$                     513

$                      430

$              83

19.3 %

Marine Systems

391

291

100

34.4 %

Combat Systems

330

335

(5)

(1.5) %

Technologies

346

327

19

5.8 %

Corporate

(53)

(52)

(1)

(1.9) %

Total

$                  1,527

$                   1,331

$            196

14.7 %

Operating margin:

Aerospace

14.5 %

13.3 %

Marine Systems

7.9 %

7.1 %

Combat Systems

13.8 %

14.9 %

Technologies

9.4 %

9.8 %

Total

10.5 %

10.3 %


EXHIBIT D

REVENUE AND OPERATING EARNINGS BY SEGMENT – (UNAUDITED)

DOLLARS IN MILLIONS

Nine Months Ended

Variance

October 4, 2026

September 28, 2025

$

%

Revenue:

Aerospace

$                10,340

$                   9,322

$         1,018

10.9 %

Marine Systems

13,963

11,905

2,058

17.3 %

Combat Systems

6,959

6,711

248

3.7 %

Technologies

10,879

10,233

646

6.3 %

Total

$                42,141

$                 38,171

$         3,970

10.4 %

Operating earnings:                                                

Aerospace

$                  1,516

$                   1,265

$            251

19.8 %

Marine Systems

1,049

832

217

26.1 %

Combat Systems

958

950

8

0.8 %

Technologies

1,024

987

37

3.7 %

Corporate

(140)

(130)

(10)

(7.7) %

Total

$                  4,407

$                   3,904

$            503

12.9 %

Operating margin:

Aerospace

14.7 %

13.6 %

Marine Systems

7.5 %

7.0 %

Combat Systems

13.8 %

14.2 %

Technologies

9.4 %

9.6 %

Total

10.5 %

10.2 %


EXHIBIT E

CONSOLIDATED BALANCE SHEET

DOLLARS IN MILLIONS

(Unaudited)

October 4, 2026

December 31, 2025

ASSETS

Current assets:

Cash and equivalents

$                        4,388

$                        2,333

Accounts receivable

2,529

2,406

Unbilled receivables

8,906

8,380

Inventories

9,124

9,232

Other current assets

1,926

1,897

Total current assets

26,873

24,248

Noncurrent assets:

Property, plant and equipment, net

7,853

7,525

Intangible assets, net

1,231

1,375

Goodwill

20,849

21,009

Other assets

3,399

3,092

Total noncurrent assets

33,332

33,001

Total assets

$                      60,205

$                      57,249

LIABILITIES AND SHAREHOLDERS’ EQUITY

Current liabilities:

Short-term debt and current portion of long-term debt                                                    

$                           756

$                        1,006

Accounts payable

3,166

2,678

Customer advances and deposits

11,083

9,824

Other current liabilities

3,821

3,288

Total current liabilities

18,826

16,796

Noncurrent liabilities:

Long-term debt

6,260

7,007

Other liabilities

7,827

7,824

Total noncurrent liabilities

14,087

14,831

Shareholders’ equity:

Common stock

482

482

Surplus

4,646

4,403

Retained earnings

46,299

44,080

Treasury stock

(23,403)

(22,860)

Accumulated other comprehensive loss

(732)

(483)

Total shareholders’ equity

27,292

25,622

Total liabilities and shareholders’ equity

$                      60,205

$                      57,249


EXHIBIT F

CONSOLIDATED STATEMENT OF CASH FLOWS – (UNAUDITED)

DOLLARS IN MILLIONS

Nine Months Ended

October 4, 2026

September 28, 2025

Cash flows from operating activities—continuing operations:

Net earnings

$                      3,514

$                      3,067

Adjustments to reconcile net earnings to net cash from operating activities:                 

Depreciation of property, plant and equipment

525

490

Amortization of intangible and finance lease right-of-use assets

173

182

Equity-based compensation expense

169

146

Deferred income tax provision

335

151

(Increase) decrease in assets, net of effects of business acquisitions:

Accounts receivable

(123)

(314)

Unbilled receivables

(480)

(415)

Inventories

108

(131)

Increase (decrease) in liabilities, net of effects of business acquisitions:

Accounts payable

488

119

Customer advances and deposits

1,232

45

Other, net

(196)

219

Net cash provided by operating activities

5,745

3,559

Cash flows from investing activities:

Capital expenditures

(918)

(552)

Other, net

18

130

Net cash used by investing activities

(900)

(422)

Cash flows from financing activities:

Dividends paid

(1,263)

(1,188)

Repayment of fixed-rate notes

(1,000)

(1,500)

Purchases of common stock

(604)

(600)

Proceeds from fixed-rate notes

—

747

Other, net

87

235

Net cash used by financing activities

(2,780)

(2,306)

Net cash used by discontinued operations

(10)

(8)

Net increase in cash and equivalents

2,055

823

Cash and equivalents at beginning of period

2,333

1,697

Cash and equivalents at end of period

$                      4,388

$                      2,520


EXHIBIT G

ADDITIONAL FINANCIAL INFORMATION – (UNAUDITED)

DOLLARS IN MILLIONS, EXCEPT PER SHARE AMOUNTS

Non-GAAP Financial Measures:

Third Quarter

Nine Months

2026

2025

2026

2025

Free cash flow:

Net cash provided by operating activities    

$                       1,710

$                  2,109

$                    5,745

$                    3,559

Capital expenditures

(481)

(212)

(918)

(552)

Free cash flow (a)

$                       1,229

$                  1,897

$                    4,827

$                    3,007

October 4, 2026

December 31, 2025

Net debt:

Total debt

$                       7,016

$                  8,013

Less cash and equivalents

4,388

2,333

Net debt (b)

$                       2,628

$                  5,680

Supplemental Aerospace Data:

Third Quarter

Nine Months

2026

2025

2026

2025

Gulfstream Aircraft Deliveries (units):

Large-cabin aircraft

35

33

101

95

Mid-cabin aircraft

5

6

18

18

Total

40

39

119

113

Aerospace Book-to-Bill:

Orders (c)

$                       4,970

$                  4,053

$                  14,091

$                  10,417

Revenue

3,536

3,234

10,340

9,322

Book-to-Bill Ratio

1.4x

1.3x

1.4x

1.1x

(a)

We define free cash flow as net cash from operating activities less capital expenditures. We believe free cash flow is a useful measure

for investors because it portrays our ability to generate cash from our businesses for purposes such as repaying debt, funding business 

acquisitions, paying dividends and repurchasing our common stock to cover dilution. We use free cash flow to assess the quality of our

earnings and as a key performance measure in evaluating management.

(b)

We define net debt as short- and long-term debt (total debt) less cash and equivalents. We believe net debt is a useful measure for

investors because it reflects the borrowings that support our operations and capital deployment strategy. We use net debt as an

important indicator of liquidity and financial position.

(c)

Excludes customer defaults, liquidated damages, cancellations, foreign exchange fluctuations and other backlog adjustments.


EXHIBIT H

BACKLOG – (UNAUDITED)

DOLLARS IN MILLIONS

Funded

Unfunded

Total

Backlog

Estimated

Potential

Contract Value*

Total

Estimated

Contract Value

Third Quarter 2026:

Aerospace

$            24,460

$                 925

$            25,385

$                     1,374

$               26,759

Marine Systems

47,289

99,576

146,865

7,644

154,509

Combat Systems

26,983

1,701

28,684

9,588

38,272

Technologies

13,064

6,341

19,405

31,724

51,129

Total

$          111,796

$          108,543

$          220,339

$                   50,330

$             270,669

Second Quarter 2026:                        

Aerospace

$            22,992

$                 985

$            23,977

$                     1,170

$               25,147

Marine Systems

42,356

22,826

65,182

7,442

72,624

Combat Systems

27,507

1,843

29,350

10,847

40,197

Technologies

11,256

6,733

17,989

30,945

48,934

Total

$          104,111

$            32,387

$          136,498

$                   50,404

$             186,902

Third Quarter 2025:

Aerospace

$            19,476

$              1,131

$            20,607

$                     1,147

$               21,754

Marine Systems

38,757

14,854

53,611

14,839

68,450

Combat Systems

17,232

1,470

18,702

9,553

28,255

Technologies

10,269

6,668

16,937

32,341

49,278

Total

$            85,734

$            24,123

$          109,857

$                   57,880

$             167,737

*

The estimated potential contract value includes work awarded on unfunded indefinite delivery, indefinite quantity (IDIQ) contracts and

unexercised options associated with existing firm contracts, including options and other agreements with existing customers to purchase

new aircraft and aircraft services. We recognize options in backlog when the customer exercises the option and establishes a firm order.

For IDIQ contracts, we evaluate the amount of funding we expect to receive and include this amount in our estimated potential contract

value. The actual amount of funding received in the future may be higher or lower than our estimate of potential contract value.


EXHIBIT H-1

BACKLOG – (UNAUDITED)

DOLLARS IN MILLIONS

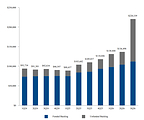
https://mmx.prnewswire.com/media/MS2023592/ExhibitH1.jpg?id=OA3047375

View original content to download multimedia:https://www.prnewswire.com/news-releases/general-dynamics-reports-third-quarter-2026-financial-results-302924010.html

SOURCE General Dynamics

Continue Reading

Technology

Delta Electronics Hosts Inaugural Future Industry Summit in Singapore and Inks Collaboration with the College of Design and Engineering at NUS to Advance Sustainable Data Center Innovation

Published

on

By

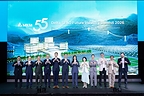
SINGAPORE, Oct. 30, 2026 /PRNewswire/ — Today, Delta Electronics, a global leader in power management and smart green solutions, hosted the annual Delta SEAO Future Industry Summit 2026 for the first time in Singapore, after seven consecutive editions in Thailand. Held under the theme “Advancing Regional Infrastructure for AI and Energy Transformation Evolution”, the Summit brought together over 200 prominent government officials, industry executives, academics, and media stakeholders to discuss solutions that accelerate the adoption of sustainable digital and energy infrastructure. This is aimed at supporting AI-driven growth across the Southeast Asia and Oceania (SEAO) region. At the Summit, Delta also deepened its collaboration with National University of Singapore (NUS) College of Design and Engineering (CDE) by joining the Sustainable Tropical Data Center Testbed (STDCT) Phase 2.0 Consortium to foster sustainable AI data center innovation.

Shan-Shan Guo, Delta’s Chief Brand Officer, said, “The energy transition is essential to addressing climate change. The rise of electrification and AI infrastructure is making the need for resilient, energy-efficient power infrastructure increasingly urgent. Since its founding 55 years ago, Delta has been committed to driving sustainability through innovation and energy conservation. We are honored to share at the Delta SEAO Future Industry Summit some of Delta’s key sustainability endeavors, including the acceleration of the energy transition with our microgrid solutions, helping customers move toward net zero carbon emissions with our ESG consulting services, and our coral restoration journey in Singapore and other regions. Together with our customers and partners, we are building a smarter, greener tomorrow.”

“Southeast Asia’s infrastructure needs are evolving rapidly as AI and electrification reshape the region. With its long-term development in power and thermal management, Delta brings deep expertise across power, cooling, automation and energy management,” said Jason Yuan, President of Delta Electronics Southeast Asia & Oceania. “Our strength lies in bringing these capabilities together to help build future-ready infrastructure that is reliable, scalable, efficient and adaptable to the region’s needs. That is the conversation we want to advance by bringing our annual SEAO Summit to Singapore.”

The program included executive keynotes and two panel discussions focused on energy infrastructure readiness for the region’s data centers and the role of industrial and building automation in sustainable manufacturing. The Singapore edition builds on Delta’s growing engagement across Southeast Asia, following the opening of its new Johor Bahru office and the Solutions Day forum in Kuala Lumpur in July. Together, these initiatives reflect Delta’s continued investment in the region and its focus on supporting the infrastructure demands created by AI, electrification and industrial transformation.

The Summit arrives as Southeast Asia’s data center power demand grows faster than any other region in the world. According to an IDC study commissioned by Delta (*), surveyed Southeast Asian operators reported 26-50% year-on-year growth in power demand, against 11-20% in the United States and Europe. 60% here are also already deploying, planning, or evaluating direct liquid cooling, the highest adoption rate of the three regions surveyed. The same study found that 24-26% of Southeast Asian operators cite cluster around power, grid, cooling capacity and equipment lead-time risks as their single biggest constraint on scaling.

Singapore is also investing in the infrastructure and research capabilities needed to support the next generation of data centers. The country is developing new approaches to tropical data center design and testing, including through the STDCT, hosted at the NUS CDE.

Collaboration with NUS to Advance Sustainable Data Center Innovation

Against this backdrop, Delta formalized today, at the Delta SEAO Future Industry Summit 2026, its deepening collaboration with NUS CDE through its participation in the Sustainable Tropical Data Centre Testbed Phase 2.0 (STDCT 2.0) Consortium. As part of the collaboration, Delta will provide NUS CDE with an AI Containerized Data Center and related equipment, to support research and testing of data center technologies suited to tropical conditions. The collaboration brings together Delta’s expertise in power, cooling, and data center infrastructure with NUS CDE’s research capabilities in tropical data center design and testing.

“AI is fundamentally changing the design envelope for data centers, with much higher power densities and thermal loads placing new demands on power, cooling and infrastructure efficiency,” said Professor Lee Poh Seng, Programme Director of STDCT 2.0 and Head of the Department of Mechanical Engineering at NUS CDE. “STDCT 2.0 is designed to bridge the gap between innovation and real-world deployment by providing a live environment in which next-generation technologies can be integrated, tested and validated under tropical operating conditions. Delta brings deep capabilities across power electronics, thermal management and data center infrastructure, and this collaboration will enable us to explore these technologies at system level and demonstrate measurable improvements in energy efficiency, water efficiency, reliability and climate resilience. Our goal is to generate solutions and evidence that can accelerate the deployment of more sustainable AI infrastructure in Singapore and across the wider region.”

As AI and electrification reshape infrastructure needs across Southeast Asia, the Delta SEAO Future Industry Summit 2026, held at Pan Pacific Orchard, brings these stakeholders together to fulfil the region’s infrastructure needs.

ABOUT DELTA ELECTRONICS INT’L (Singapore)

The company is a wholly owned subsidiary of Delta Electronics, Inc.

ABOUT DELTA

Delta, founded in 1971, and listed on the Taiwan Stock Exchange (code:2308), is a global leader in switching power supplies and thermal management products with a thriving portfolio of IoT-based smart energy-saving systems and solutions in the fields of industrial automation, building automation, telecom power, data center infrastructure, EV charging, renewable energy, energy storage and display, to nurture the development of smart manufacturing and sustainable cities. As a world-class corporate citizen guided by its mission statement, “To provide innovative, clean and energy-efficient solutions for a better tomorrow,” Delta leverages its core competence in high-efficiency power electronics and its ESG-embedded business model to address key environmental issues, such as climate change. Delta serves customers through its sales offices, R&D centers and manufacturing facilities spread over close to 200 locations across 5 continents.

Throughout its history, Delta has received various global awards and recognition for its business achievements, innovative technologies and dedication to ESG. Since 2011, Delta has been listed on the Dow Jones Best-in-Class World Index (formerly the DJSI World Index of Dow Jones Sustainability™ Indices) for 15 consecutive years. Delta has also won CDP with double A List for 4 times for its substantial contribution to climate change and water security issues and has been named Supplier Engagement Leader for its continuous development of a sustainable value chain for 8 consecutive years.

For detailed information about Delta, please visit: www.deltaww.com

About the Sustainable Tropical Data Centre Testbed (STDCT 2.0)

The Sustainable Tropical Data Centre Testbed (STDCT) is a joint research initiative led by the National University of Singapore (NUS) and hosted by its College of Design and Engineering, in collaboration with leading industry partners.

STDCT 2.0 focuses on developing energy-efficient data centre designs that can operate reliably in tropical climates. The programme serves as a live testbed to evaluate, validate, and deploy sustainable innovations that reduce energy and water consumption while supporting dense, AI-driven operations.

For more information, visit https://cde.nus.edu.sg/stdct/

*IDC InfoBrief, sponsored by Delta, Powering AI Growth: From Grid Constraints to Rack Readiness, #AP242570-IB, September 2026

View original content to download multimedia:https://www.prnewswire.com/apac/news-releases/delta-electronics-hosts-inaugural-future-industry-summit-in-singapore-and-inks-collaboration-with-the-college-of-design-and-engineering-at-nus-to-advance-sustainable-data-center-innovation-302924812.html

SOURCE Delta Electronics

Continue Reading

Trending