
Technology
QUEBECOR INC. REPORTS CONSOLIDATED RESULTS FOR THIRD QUARTER 2026

Published
1 day agoon
By

MONTRÉAL, Nov. 5, 2026 /PRNewswire/ — Quebecor Inc. (“Quebecor” or “the Corporation”) today reported its consolidated financial results for the third quarter of 2026.
Third quarter 2026 highlights
In the third quarter of 2026, Quebecor’s adjusted cash flows from operations1 were up $67.3 million (14.6%) compared with the same quarter of 2025 to $529.7 million, adjusted EBITDA2 was up $78.6 million (12.5%) to $706.7 million, and revenues were up $49.2 million (3.5%) to $1.45 billion. These results primarily reflect the strong performance of the Telecommunications and Media segments, as well as the favourable impact of $31.5 million related to stock‑based compensation.The Telecommunications segment recorded increases of $34.7 million (7.9%) in adjusted cash flows from operations, $45.0 million (7.5%) in adjusted EBITDA and $51.4 million (4.2%) in revenues, including growth of $43.1 million (9.6%) in mobile telephony service revenues and $9.3 million (3.0%) in Internet access service revenues. In addition, average monthly mobile revenue per unit (“mobile ARPU”)3 increased by 2.9%, marking a fourth consecutive quarterly increase and a sequential improvement.The mobile telephony service posted a net increase of 136,700 subscriber connections (3.0%), the largest quarterly increase in the number of subscriber connections since the launch of the mobile service in 2010.In the third quarter of 2026, the Media segment reported a $16.3 million (69.7%) increase in adjusted EBITDA, while the Sports and Entertainment segment reported a $0.9 million (‑6.0%) decrease.Quebecor’s net income attributable to shareholders was $296.4 million ($1.33 per basic share), an increase of $60.3 million ($0.30 per basic share) or 25.5%.Adjusted net income4 was $294.1 million ($1.32 per basic share), an increase of $52.5 million ($0.27 per basic share) or 21.7%.The consolidated net debt leverage ratio5 decreased to 2.69x and remains the lowest among Canada’s major telecommunications providers.On September 3, 2026, Quebecor entered into a new 12‑year sublicensing agreement with Rogers Communications (“Rogers”) for French‑language broadcast rights to National Hockey League (“NHL”) games. Effective from the 2026‑2027 season through the 2037‑2038 season, this agreement enables TVA Sports to build on its current role as an official French‑language NHL broadcaster, ensuring continuity in its position as the premier destination for watching hockey in French in Québec and across Canada. The illico+ platform will be added to the broadcasting landscape in keeping with the continued expansion to more streaming platforms.On October 1, 2026, Videotron Ltd. (“Videotron”) announced the expansion of its wireless subscription area to several communities in Abitibi‑Témiscamingue, Nord‑du‑Québec, Saguenay–Lac‑Saint‑Jean and Bas‑Saint‑Laurent, providing more than 25,000 residents with access to a genuine competitive alternative for mobile service.On July 24, 2026, Freedom Mobile (“Freedom”) announced that access to its 5G+ network would be available at no additional cost to customers on all of its plans, provided they have a compatible device and SIM card and are located within an eligible coverage area. Freedom also continued the rollout of its 5G and 5G+ networks in Ontario, Alberta and British Columbia, improving connectivity for more than 500,000 additional Canadians.During the third quarter of 2026, Videotron repaid a total of $200.0 million under the third tranche of its term credit facility. An additional repayment of $100.0 million was made on October 6, 2026. Following these repayments, the balance of the facility was reduced from $400.0 million to $100.0 million.
_____________________
1 See “Adjusted cash flows from operations” under “Definitions.”
2 See “Adjusted EBITDA” under “Definitions.”
3 See “Key performance indicators” under “Definitions.”
4 See “Adjusted net income” under “Definitions.”
5 See “Consolidated net debt leverage ratio” under “Definitions.”
Comments by Pierre Karl Péladeau, President and Chief Executive Officer of Quebecor
“Quebecor delivered an excellent performance in the third quarter of 2026, as reflected by increases of 14.6% in adjusted cash flows from operations, 12.5% in adjusted EBITDA and 3.5% in revenues. These results reflect the significant contribution of the Telecommunications and Media segments, as well as the $31.5 million favourable impact of stock‑based compensation. Demonstrating our financial discipline and operational rigour, this solid performance, combined with the strongest balance sheet in the industry, enabled us to reduce consolidated net debt by more than $220 million in the third quarter and lower our consolidated net debt leverage ratio to 2.69x as at September 30, 2026, by far the lowest among Canada’s major telecommunications providers.
The Telecommunications segment once again distinguished itself with increases of 7.9% in adjusted cash flows from operations, 7.5% in adjusted EBITDA and 4.2% in revenues. Revenue growth was driven by mobile telephony and Internet access services, which recorded increases of 9.6% and 3.0%, respectively.
In mobile telephony, we reached a new milestone with a net increase of 136,700 subscriber connections, or 3.0%, representing the largest quarterly increase since the launch of the mobile service in 2010. All three of our brands, Videotron, Freedom and Fizz, contributed to this record growth, reflecting both the success of our Canada‑wide expansion, the strength of our organic growth in Québec and the soundness of our strategic decisions in a highly competitive market. The value and appeal of our offerings continue to set us apart, driving both the acquisition of new subscribers and the loyalty of our customer base. At the same time, mobile ARPU increased by $1.03, or 2.9%, marking a fourth consecutive quarterly increase and a sequential improvement, reflecting our ability to combine subscriber growth with higher average revenue per subscriber.
To better meet our customers’ needs, we continue to invest in enhancing the performance, capacity and coverage of our networks. Freedom notably continued the expansion of its 5G and 5G+ networks in Ontario, Alberta and British Columbia, providing improved connectivity to more than 500,000 additional Canadians. In addition, access to Freedom’s 5G+ network was extended to customers across all of its plans at no additional cost for those with a compatible device and SIM card located within an eligible coverage area. In Québec, Videotron expanded its wireless service subscription area in October to several communities in Abitibi‑Témiscamingue, Nord‑du‑Québec, Saguenay–Lac‑Saint‑Jean and Bas‑Saint‑Laurent. More than 25,000 additional residents can now take advantage of our competitive mobile offerings. These initiatives reflect our commitment to making leading‑edge wireless technologies accessible to more Canadians while providing a strong competitive alternative.
In the Media segment, TVA Group Inc. (“TVA Group”) reported adjusted EBITDA of $32.8 million, an increase of $14.3 million compared with the third quarter of 2025. This improvement was mainly attributable to savings generated through various cost‑reduction initiatives, including lower content costs, higher subscription revenues at TVA Sports, driven by TVA Sports Direct and new carriage rate agreements, as well as the recognition of the estimated benefit from the new tax credit for Québec news media organizations. While we welcome these results, we remain prudent and disciplined given the ongoing challenges facing the industry, particularly in advertising revenues.
Maintaining its focus on programming choices that are both successful and responsible, TVA Group led the Québec television market in the third quarter with a 43.5% market share, a 2.3‑point increase from the same period of 2025, while the TVA Network strengthened its leadership position with a 23.1% market share, a 1.0‑point increase, driven in particular by the success of flagship programs such as Chanteurs masqués and Indéfendable. In news programming, LCN remained the most‑watched specialty channel in Québec with a 9.2% market share, a 1.2‑point increase. LCN and the TVA Network cemented their status as the authoritative sources for political news. During the recent election campaign, Face‑à‑face 2026 and Québec 2026 were the most‑watched leaders’ debate and election‑night broadcast.
In addition, a new 12‑year sublicensing agreement was reached with Rogers for the French‑language broadcast rights to NHL games through the 2037‑2038 season. This agreement reinforces TVA Sports’ position as a premier destination for hockey fans in Québec and across Canada. In an environment marked by changing viewing habits and the diversification of distribution platforms, illico+ will also become part of the distribution ecosystem.
The superior performance of our operations, the quality of our assets and the strength of our brands allow us to look to the future with confidence. Backed by our solid financial position, we continue to pursue our pan‑Canadian expansion while maintaining disciplined capital allocation to create sustainable value for all our stakeholders.”
Non‑IFRS financial measures
The Corporation uses financial measures not standardized under International Financial Reporting Standards (“IFRS”), such as adjusted EBITDA, adjusted net income, adjusted cash flows from operations, free cash flows and consolidated net debt leverage ratio, and key performance indicators, including revenue generating unit (“RGU”) and mobile ARPU. Definitions of the non‑IFRS measures and key performance indicators used by the Corporation in this press release are provided in the “Definitions” section.
Financial table
Table 1
Consolidated summary of income, cash flows and balance sheet
(in millions of Canadian dollars, except per basic share data)
Three months ended
September 30
Nine months ended
September 30
2026
2025
2026
2025
Income
Revenues:
Telecommunications
$
1,267.6
$
1,216.2
$
3,719.1
$
3,563.1
Media
154.2
152.1
495.5
491.1
Sports and Entertainment
64.5
68.3
161.9
169.5
Inter‑segments
(31.6)
(31.1)
(86.4)
(94.7)
1,454.7
1,405.5
4,290.1
4,129.0
Adjusted EBITDA (negative adjusted EBITDA):
Telecommunications
647.5
602.5
1,908.8
1,793.4
Media
39.7
23.4
64.3
14.1
Sports and Entertainment
14.1
15.0
19.0
23.2
Head Office
5.4
(12.8)
(81.4)
(47.9)
706.7
628.1
1,910.7
1,782.8
Depreciation and amortization
(219.0)
(213.6)
(645.8)
(642.7)
Financial expenses
(79.5)
(85.0)
(235.2)
(263.5)
Restructuring, impairment of assets and other
(1.8)
(8.1)
(8.2)
(27.4)
Other items
3.3
0.1
42.6
8.7
Income taxes
(107.1)
(82.8)
(261.9)
(218.7)
Net income
$
302.6
$
238.7
$
802.2
$
639.2
Net income attributable to shareholders
$
296.4
$
236.1
$
792.7
$
644.5
Adjusted net income
294.1
241.6
754.9
653.5
Per basic share:
Net income attributable to shareholders
1.33
1.03
3.53
2.80
Adjusted net income
1.32
1.05
3.36
2.84
Table 1 (continued)
Three months ended
September 30
Nine months ended
September 30
2026
2025
2026
2025
Capital expenditures:
Telecommunications
$
172.4
$
162.1
$
470.5
$
454.1
Media
3.3
2.3
8.7
6.2
Sports and Entertainment
1.2
1.1
4.2
3.8
Head Office
0.1
0.2
0.2
0.2
177.0
165.7
483.6
464.3
Cash flows:
Adjusted cash flows from operations:
Telecommunications
475.1
440.4
1,438.3
1,339.3
Media
36.4
21.1
55.6
7.9
Sports and Entertainment
12.9
13.9
14.8
19.4
Head Office
5.3
(13.0)
(81.6)
(48.1)
529.7
462.4
1,427.1
1,318.5
Free cash flows1
422.3
443.9
1,076.5
1,056.6
Cash flows provided by operating activities
592.8
581.8
1,582.7
1,540.0
Sept. 30,
2026
Dec. 31,
2025
Balance sheet
Cash and cash equivalents
$
135.3
$
160.6
Working capital
(637.8)
(233.2)
Net assets related to derivative financial instruments
87.7
24.3
Total assets
12,990.7
12,812.2
Short‑term borrowings
645.8
–
Total long‑term debt (including current portion)
5,935.3
6,824.3
Lease liabilities (current and long term)
423.3
410.6
Equity attributable to shareholders
2,882.2
2,625.0
Equity
3,124.3
2,737.0
Consolidated net debt leverage ratio
2.69x
2.95x
______________________
1 See “Free cash flows” under “Definitions”.
2026/2025 third quarter comparison
Revenues: $1.45 billion, a $49.2 million (3.5%) increase.
Revenues increased in Telecommunications ($51.4 million or 4.2% of segment revenues) and in Media ($2.1 million or 1.4%).Revenues decreased in Sports and Entertainment ($3.8 million or ‑5.6%).
Adjusted EBITDA: $706.7 million, an increase of $78.6 million (12.5%), including the $31.5 million favourable impact of the stock‑based compensation charge across all of the Corporation’s segments, primarily attributable to the impact of the decrease in Quebecor’s share price in the third quarter of 2026, compared with an increase in the share price during the corresponding period of 2025.
Adjusted EBITDA increased in Telecommunications ($45.0 million or 7.5% of segment adjusted EBITDA) and in Media ($16.3 million or 69.7%).There was a favourable variance at Head Office ($18.2 million), essentially due to the stock‑based compensation charge.Adjusted EBITDA decreased in Sports and Entertainment ($0.9 million or ‑6.0%).
Net income attributable to shareholders: $296.4 million ($1.33 per basic share), an increase of $60.3 million ($0.30 per basic share) or 25.5%.
The main favourable variances were:$78.6 million increase in adjusted EBITDA;$6.3 million decrease in the charge for restructuring, impairment of assets and other;$5.5 million decrease in financial expenses.The unfavourable variances were:$24.3 million increase in the income tax expense;$5.4 million increase in the depreciation and amortization charge;$3.6 million unfavourable variance related to non‑controlling interests.
Adjusted net income: $294.1 million ($1.32 per basic share), an increase of $52.5 million ($0.27 per basic share) or 21.7%.
Adjusted cash flows from operations: $529.7 million, a $67.3 million (14.6%) increase due to the $78.6 million increase in adjusted EBITDA, partially offset by an $11.3 million increase in capital expenditures, mainly in the Telecommunications segment.
Cash flows provided by operating activities: $592.8 million, an $11.0 million (1.9%) increase due primarily to the increase in adjusted EBITDA, the decrease in current income taxes and the decrease in the cash portion of financial expenses, partially offset by an unfavourable net change in non‑cash balances related to operating activities.
2026/2025 year‑to‑date comparison
Revenues: $4.29 billion, a $161.1 million (3.9%) increase.
Revenues increased in Telecommunications ($156.0 million or 4.4% of segment revenues) and in Media ($4.4 million or 0.9%).Revenues decreased in Sports and Entertainment ($7.6 million or ‑4.5%).
Adjusted EBITDA: $1.91 billion, an increase of $127.9 million (7.2%), including the $55.3 million unfavourable impact of the stock‑based compensation charge across all of the Corporation’s segments, due mainly to a significant increase in Quebecor’s share price.
Adjusted EBITDA increased in Telecommunications ($115.4 million or 6.4% of segment adjusted EBITDA) and in Media ($50.2 million).There was an unfavourable variance at Head Office ($33.5 million), essentially due to the stock‑based compensation charge.Adjusted EBITDA decreased in Sports and Entertainment ($4.2 million).
Net income attributable to shareholders: $792.7 million ($3.53 per basic share), an increase of $148.2 million ($0.73 per basic share) or 23.0%.
The favourable variances were:$127.9 million increase in adjusted EBITDA;$33.9 million favourable variance in other items;$28.3 million decrease in financial expenses;$19.2 million decrease in the charge for restructuring, impairment of assets and other.The main unfavourable variances were:$43.2 million increase in the income tax expense;$14.8 million unfavourable variance related to non‑controlling interests.
Adjusted net income: $754.9 million ($3.36 per basic share), an increase of $101.4 million ($0.52 per basic share) or 15.5%.
Adjusted cash flows from operations: $1.43 billion, a $108.6 million (8.2%) increase due to the $127.9 million increase in adjusted EBITDA, partially offset by a $19.3 million increase in capital expenditures, mainly in the Telecommunications segment.
Cash flows provided by operating activities: $1.58 billion, a $42.7 million (2.8%) increase due primarily to the increase in adjusted EBITDA, a decrease in the cash portion of financial expenses and a decrease in the cash portion of the charge for restructuring, impairment of assets and other, partially offset by an unfavourable net change in non‑cash balances related to operating activities and by the increase in current income taxes.
Financing operations
During the third quarter of 2026, Videotron repaid a total of $200.0 million under the third tranche of its term credit facility. On October 6, 2026, Videotron made an additional repayment of $100.0 million under its term credit facility. Following these repayments, the balance of the facility was reduced from $400.0 million to $100.0 million.
Capital stock
On August 6, 2025, the Board of Directors of the Corporation authorized a normal course issuer bid for a maximum of 1,000,000 Class A Multiple Voting Shares (“Class A Shares”) representing approximately 1.3% of issued and outstanding Class A Shares, and for a maximum of 5,000,000 Class B Subordinate Voting Shares (“Class B Shares”) representing approximately 3.2% of issued and outstanding Class B Shares as of August 1, 2025. On May 13, 2026, the Corporation received approval from the Toronto Stock Exchange to amend its normal course issuer bid in order to increase the maximum number of Class B Shares that may be repurchased to 7,000,000 Class B Shares, representing approximately 4.5% of the Class B Shares public float as of August 1, 2025. All shares purchased under the bid were cancelled.
On August 5, 2026, the Board of Directors of the Corporation authorized a normal course issuer bid for a maximum of 1,000,000 Class A Shares representing approximately 1.3% of issued and outstanding Class A Shares, and for a maximum of 7,000,000 Class B Shares representing approximately 4.7% of issued and outstanding Class B Shares as of July 31, 2026. The purchases can be made from August 15, 2026 to August 14, 2027, at prevailing market prices on the open market through the facilities of the Toronto Stock Exchange or other alternative trading systems in Canada. All shares purchased under the bid will be cancelled.
During the first nine months of 2026, the Corporation repurchased and cancelled 3,899,900 Class B Shares for a total cash consideration of $237.6 million (3,740,908 Class B Shares repurchased and cancelled for a total cash consideration of $140.0 million in 2025) and 24,333 Class B Shares were issued following the exercise of stock options for a total cash consideration of $0.8 million (217,221 Class B Shares issued for a total cash consideration of $6.6 million in 2025).
Dividends declared
On November 4, 2026, the Board of Directors of Quebecor declared a quarterly dividend of $0.45 per share on its Class A Shares and Class B Shares, payable on December 15, 2026 to shareholders of record at the close of business on November 20, 2026. This dividend is designated an eligible dividend, as provided under subsection 89(14) of the Canadian Income Tax Act and its provincial counterpart.
Detailed financial information
For a detailed analysis of Quebecor’s third quarter 2026 results, please refer to the Management Discussion and Analysis and condensed consolidated financial statements of Quebecor, available on the Corporation’s website at www.quebecor.com/en/investors/financial‑documentation and the SEDAR+ website at www.sedarplus.ca.
Conference call for investors and webcast
Quebecor will hold a conference call to discuss its third quarter 2026 results on November 5, 2026, at 9:00 a.m. EST. There will be a question period reserved for financial analysts. To access the conference call, please dial 1‑800‑990‑4777. The conference call will also be broadcast live on Quebecor’s website at www.quebecor.com/en/investors/conferences‑and‑annual‑meeting. A recording will be available at the same address until February 3, 2027 for anyone unable to attend the call.
Cautionary statement regarding forward‑looking statements
The statements in this press release that are not historical facts are forward‑looking statements and are subject to significant known and unknown risks, uncertainties and assumptions that could cause Quebecor’s actual results for future periods to differ materially from those set forth in forward‑looking statements. Forward‑looking statements may be identified by the use of the conditional or by forward‑looking terminology such as the terms “plans,” “expects,” “may,” “anticipates,” “intends,” “estimates,” “projects,” “seeks,” “believes,” or similar terms, variations of such terms or the negative of such terms. Some important factors that could cause actual results to differ materially from those expressed in these forward‑looking statements include, but are not limited to:
Quebecor’s ability to continue successfully developing its network and the facilities that support its mobile services;general economic and political climate, financial and economic market conditions, including hyperinflation in Turkey, global business challenges, such as tariffs and trade barriers, as well as market conditions and variations in the businesses of local, regional and national advertisers in Quebecor’s newspapers, television outlets and other media properties;Quebecor’s ability to implement its business and growth strategies successfully;the intensity of competitive activity in the industries in which Quebecor operates and its ability to penetrate new markets and successfully develop its business, including in growth sectors and new geographies;fragmentation of the media landscape and its impact on the advertising market and the media properties of Quebecor;new technologies that might change consumer behaviour with respect to Quebecor’s product suites;impacts related to cybersecurity and the protection of personal information;unanticipated higher capital spending required for developing Quebecor’s network or to address the continued development of competitive alternative technologies, or the inability to obtain additional capital to continue the development of Quebecor’s business segments;the impacts of the significant and recurring investments that will be required for development and expansion and to compete effectively with the incumbent local exchange carriers and other current or potential competitors in the Telecommunications segment’s target markets;disruptions to the network through which Quebecor provides its television, Internet access, mobile and wireline telephony and over-the-top (“OTT”) video services, and its ability to protect such services against piracy, unauthorized access and other security breaches;labour disputes and strikes, service interruptions resulting from equipment breakdown, network failure, the threat of natural disasters, public‑health crises and political instability in some countries;changes in Quebecor’s ability to obtain services and equipment critical to its operations;impacts related to environmental issues;changes in laws and regulations, or in their interpretations, which could result, among other things, in increased competition, changes in Quebecor’s markets, increased operating expenses, capital expenditures or tax expenses, or a reduction in the value of some assets; and Quebecor’s indebtedness, interest rate and exchange rate fluctuations, the tightening of credit markets and the restrictions on its business imposed by the terms of its debt.
The forward‑looking statements in this document are made to provide investors and the public with a better understanding of the Corporation’s circumstances and are based on assumptions it believes to be reasonable as of the day on which they are made. Investors and others are cautioned that the foregoing list of factors that may affect future results is not exhaustive and that undue reliance should not be placed on any forward‑looking statements. For more information on the risks, uncertainties and assumptions that could cause the Corporation’s actual results to differ from current expectations, please refer to the Corporation’s public filings, available at www.sedarplus.ca and www.quebecor.com, including, in particular, the “Trend Information” and “Risks and Uncertainties” sections of the Corporation’s Management Discussion and Analysis for the year ended December 31, 2025.
The forward‑looking statements in this document reflect the Corporation’s expectations as of November 5, 2026, and are subject to change after that date. The Corporation expressly disclaims any obligation or intention to update or revise any forward‑looking statements, whether as a result of new information, future events or otherwise, except as required by applicable securities laws.
About Quebecor
Quebecor, a Canadian leader in telecommunications, entertainment, news media and culture, is one of the best‑performing integrated communications companies in the industry. Driven by their determination to deliver the best possible customer experience, all of Quebecor’s subsidiaries and brands are differentiated by their high‑quality, multiplatform, convergent products and services.
Quebecor (TSX: QBR.A, QBR.B) is headquartered in Québec and employs more than 11,000 people in Canada.
A family business founded in 1950, Quebecor is strongly committed to the community. Every year, it actively supports more than 400 organizations in the vital fields of culture, health, education, the environment and entrepreneurship.
Visit our website: www.quebecor.com
Follow us on X: www.x.com/Quebecor
DEFINITIONS
Adjusted EBITDA
In its analysis of operating results, the Corporation defines adjusted EBITDA, as reconciled to net income under IFRS, as net income before depreciation and amortization, financial expenses, restructuring, impairment of assets and other, other items and income taxes. Adjusted EBITDA as defined above is not a measure of results that is consistent with IFRS. It is not intended to be regarded as an alternative to IFRS financial performance measures or to the statement of cash flows as a measure of liquidity. This measure should not be considered in isolation or as a substitute for other performance measures prepared in accordance with IFRS. The Corporation’s management and Board of Directors use this measure in evaluating its consolidated results as well as the results of the Corporation’s operating segments. This measure eliminates the significant level of impairment and depreciation/amortization of tangible and intangible assets and is unaffected by the capital structure or investment activities of the Corporation and its business segments.
Adjusted EBITDA is also relevant because it is a component of the Corporation’s annual incentive compensation programs. A limitation of this measure, however, is that it does not reflect the capital expenditures and acquisitions of spectrum licences needed to generate revenues in the Corporation’s segments. The Corporation also uses other measures that do reflect capital expenditures, such as adjusted cash flows from operations and free cash flows. The Corporation’s definition of adjusted EBITDA may not be the same as similarly titled measures reported by other companies.
Table 2 provides a reconciliation of adjusted EBITDA to net income as disclosed in Quebecor’s condensed consolidated financial statements.
Table 2
Reconciliation of adjusted EBITDA to the net income measure used in the condensed consolidated financial statements
(in millions of Canadian dollars)
Three months ended
September 30
Nine months ended
September 30
2026
2025
2026
2025
Adjusted EBITDA (negative adjusted EBITDA):
Telecommunications
$
647.5
$
602.5
$
1,908.8
$
1,793.4
Media
39.7
23.4
64.3
14.1
Sports and Entertainment
14.1
15.0
19.0
23.2
Head Office
5.4
(12.8)
(81.4)
(47.9)
706.7
628.1
1,910.7
1,782.8
Depreciation and amortization
(219.0)
(213.6)
(645.8)
(642.7)
Financial expenses
(79.5)
(85.0)
(235.2)
(263.5)
Restructuring, impairment of assets and other
(1.8)
(8.1)
(8.2)
(27.4)
Other items
3.3
0.1
42.6
8.7
Income taxes
(107.1)
(82.8)
(261.9)
(218.7)
Net income
$
302.6
$
238.7
$
802.2
$
639.2
Adjusted net income
The Corporation defines adjusted net income, as reconciled to net income attributable to shareholders under IFRS, as net income attributable to shareholders before restructuring, impairment of assets and other, and other items, net of income tax and non‑controlling interest related to adjustments. Adjusted net income as defined above is not a measure of results that is consistent with IFRS. It should not be considered in isolation or as a substitute for measures of performance prepared in accordance with IFRS. The Corporation uses adjusted net income to analyze trends in the performance of its businesses. The above‑listed items are excluded from the calculation of this measure because they impair the comparability of financial results. Adjusted net income is more representative for forecasting income. The Corporation’s definition of adjusted net income may not be the same as similarly titled measures reported by other companies.
Table 3 provides a reconciliation of adjusted net income to the net income attributable to shareholders measure used in Quebecor’s condensed consolidated financial statements.
Table 3
Reconciliation of adjusted net income to the net income attributable to shareholders measure used in the condensed consolidated financial statements
(in millions of Canadian dollars)
Three months ended
September 30
Nine months ended
September 30
2026
2025
2026
2025
Adjusted net income
$
294.1
$
241.6
$
754.9
$
653.5
Restructuring, impairment of assets and other
(1.8)
(8.1)
(8.2)
(27.4)
Other items
3.3
0.1
42.6
8.7
Income taxes related to adjustments1
0.6
2.2
2.5
8.3
Non‑controlling interest related to adjustments
0.2
0.3
0.9
1.4
Net income attributable to shareholders
$
296.4
$
236.1
$
792.7
$
644.5
1
Includes the impact of fluctuations in income tax applicable to adjusted items, either for statutory reasons or in connection with tax transactions.
Adjusted cash flows from operations and free cash flows
Adjusted cash flows from operations
Adjusted cash flows from operations represents adjusted EBITDA less capital expenditures (excluding spectrum licence acquisitions). Adjusted cash flows from operations represents funds available for interest and income tax payments, expenditures related to restructuring programs, business acquisitions, acquisitions of spectrum licences, payment of dividends, repayment of long‑term debt and lease liabilities, and share repurchases. Adjusted cash flows from operations is not a measure of liquidity that is consistent with IFRS. It is not intended to be regarded as an alternative to IFRS financial performance measures or to the statement of cash flows as a measure of liquidity. Adjusted cash flows from operations is used by the Corporation’s management and Board of Directors to evaluate the cash flows generated by the operations of all of its segments, on a consolidated basis, in addition to the operating cash flows generated by each segment. Adjusted cash flows from operations is also relevant because it is a component of the Corporation’s annual incentive compensation programs. The Corporation’s definition of adjusted cash flows from operations may not be identical to similarly titled measures reported by other companies.
Free cash flows
Free cash flows represents cash flows provided by operating activities calculated in accordance with IFRS, less cash flows used for capital expenditures (excluding spectrum licence acquisitions), plus proceeds from disposal of assets. Free cash flows is used by the Corporation’s management and Board of Directors to evaluate cash flows generated by the Corporation’s operations. Free cash flows represents available funds for business acquisitions, acquisitions of spectrum licences, payment of dividends, repayment of long‑term debt and lease liabilities, and share repurchases. Free cash flows is not a measure of liquidity that is consistent with IFRS. It is not intended to be regarded as an alternative to IFRS financial performance measures or to the statement of cash flows as a measure of liquidity. The Corporation’s definition of free cash flows may not be identical to similarly titled measures reported by other companies.
Tables 4 and 5 provide a reconciliation of adjusted cash flows from operations and free cash flows to cash flows provided by operating activities reported in the condensed consolidated financial statements.
Table 4
Adjusted cash flows from operations
(in millions of Canadian dollars)
Three months ended
September 30
Nine months ended
September 30
2026
2025
2026
2025
Adjusted EBITDA (negative adjusted EBITDA)
Telecommunications
$
647.5
$
602.5
$
1,908.8
$
1,793.4
Media
39.7
23.4
64.3
14.1
Sports and Entertainment
14.1
15.0
19.0
23.2
Head Office
5.4
(12.8)
(81.4)
(47.9)
706.7
628.1
1,910.7
1,782.8
Minus
Capital expenditures:1
Telecommunications
(172.4)
(162.1)
(470.5)
(454.1)
Media
(3.3)
(2.3)
(8.7)
(6.2)
Sports and Entertainment
(1.2)
(1.1)
(4.2)
(3.8)
Head Office
(0.1)
(0.2)
(0.2)
(0.2)
(177.0)
(165.7)
(483.6)
(464.3)
Adjusted cash flows from operations
Telecommunications
475.1
440.4
1,438.3
1,339.3
Media
36.4
21.1
55.6
7.9
Sports and Entertainment
12.9
13.9
14.8
19.4
Head Office
5.3
(13.0)
(81.6)
(48.1)
$
529.7
$
462.4
$
1,427.1
$
1,318.5
1 Reconciliation to cash flows used for capital expenditures
as per condensed consolidated financial statements:
Three months ended
September 30
Nine months ended
September 30
2026
2025
2026
2025
Capital expenditures
$
(177.0)
$ (165.7)
$ (483.6)
$ (464.3)
Net variance in current operating items related to capital
expenditures (excluding government credits receivable for
large investment projects)
5.5
27.4
(24.3)
(20.2)
Cash flows used for capital expenditures
$
(171.5)
$ (138.3)
$ (507.9)
$ (484.5)
Table 5
Free cash flows and cash flows provided by operating activities reported in the condensed consolidated financial statements
(in millions of Canadian dollars)
Three months ended
September 30
Nine months ended
September 30
2026
2025
2026
2025
Adjusted cash flows from operations from Table 4
$
529.7
$
462.4
$
1,427.1
$
1,318.5
Plus (minus)
Cash portion of financial expenses
(77.4)
(82.9)
(228.8)
(256.7)
Cash portion of restructuring, impairment of assets
and other
(2.5)
(4.6)
(9.3)
(23.5)
Current income taxes
(40.4)
(57.0)
(233.5)
(215.3)
Other
0.7
1.0
0.4
0.8
Net change in non‑cash balances related to
operating activities
6.7
97.6
144.9
253.0
Net variance in current operating items related to
capital expenditures (excluding government
credits receivable for large investment projects)
5.5
27.4
(24.3)
(20.2)
Free cash flows
422.3
443.9
1,076.5
1,056.6
Plus (minus)
Cash flows used for capital expenditures
(excluding spectrum licence acquisitions)
171.5
138.3
507.9
484.5
Proceeds from disposal of assets
(1.0)
(0.4)
(1.7)
(1.1)
Cash flows provided by operating activities
$
592.8
$
581.8
$
1,582.7
$
1,540.0
Consolidated net debt leverage ratio
The consolidated net debt leverage ratio represents consolidated net debt divided by the trailing 12‑month adjusted EBITDA. Consolidated net debt consists of total long‑term debt, lease liabilities, short‑term borrowings, derivative financial instruments, and cash and cash equivalents. The consolidated net debt leverage ratio serves to evaluate the Corporation’s financial leverage and is used by management and the Board of Directors in decisions on the Corporation’s capital structure, including its financing strategy, and in managing debt maturity risks. The consolidated net debt leverage ratio is not a measure established in accordance with IFRS. It is not intended to be used as an alternative to IFRS measures or the balance sheet to evaluate the Corporation’s financial position. The Corporation’s definition of consolidated net debt leverage ratio may not be identical to similarly titled measures reported by other companies.
Table 6 provides the calculation of consolidated net debt leverage ratio and the reconciliation to balance sheet items reported in Quebecor’s condensed consolidated financial statements.
Table 6
Consolidated net debt leverage ratio
(in millions of Canadian dollars)
Sept. 30, 2026
Dec. 31, 2025
Total long‑term debt1
$
5,935.3
$
6,824.3
Plus (minus)
Lease liabilities2
423.3
410.6
Short‑term borrowings
645.8
–
Derivative financial instruments3
(87.7)
(24.3)
Cash and cash equivalents
(135.3)
(160.6)
Consolidated net debt
6,781.4
7,050.0
Divided by:
Trailing 12‑month adjusted EBITDA
$
2,521.1
$
2,393.2
Consolidated net debt leverage ratio
2.69x
2.95x
1 Excluding financing costs.
2 Total liabilities.
3 Assets less liabilities.
Key performance indicators
Revenue‑generating unit
The Corporation uses RGU, an industry metric, as a key performance indicator. An RGU represents a subscriber connection to the mobile or wireline telephony service or a subscription to the Internet access or television service. RGU is not a measurement that is consistent with IFRS and the Corporation’s definition and calculation of RGU may not be the same as identically titled measurements reported by other companies or published by public authorities.
Average monthly mobile revenue per unit
The Corporation uses mobile ARPU, an industry metric, as a key performance indicator. This indicator is calculated by dividing mobile telephony revenues by the average number of mobile RGUs during the applicable period, and then dividing the resulting amount by the number of months in the applicable period. Mobile ARPU is not a measurement that is consistent with IFRS and the Corporation’s definition and calculation of mobile ARPU may not be the same as identically titled measurements reported by other companies.
QUEBECOR INC.
CONSOLIDATED STATEMENTS OF INCOME
(in millions of Canadian dollars, except for earnings per share data)
Three months ended
Nine months ended
(unaudited)
September 30
September 30
2026
2025
2026
2025
Revenues
$
1,454.7
$
1,405.5
$
4,290.1
$
4,129.0
Employee costs
166.3
195.6
658.3
609.0
Purchase of goods and services
581.7
581.8
1,721.1
1,737.2
Depreciation and amortization
219.0
213.6
645.8
642.7
Financial expenses
79.5
85.0
235.2
263.5
Restructuring, impairment of assets and other
1.8
8.1
8.2
27.4
Other items
(3.3)
(0.1)
(42.6)
(8.7)
Income before income taxes
409.7
321.5
1,064.1
857.9
Income taxes:
Current
40.4
57.0
233.5
215.3
Deferred
66.7
25.8
28.4
3.4
107.1
82.8
261.9
218.7
Net income
$
302.6
$
238.7
$
802.2
$
639.2
Net income (loss) attributable to
Shareholders
$
296.4
$
236.1
$
792.7
$
644.5
Non-controlling interests
6.2
2.6
9.5
(5.3)
Earnings per share attributable to shareholders
Basic
$
1.33
$
1.03
$
3.53
$
2.80
Diluted
1.29
1.02
3.44
2.78
Weighted average number of shares outstanding (in millions)
223.4
229.3
224.8
230.2
Weighted average number of diluted shares (in millions)
229.4
231.2
230.3
232.1
QUEBECOR INC.
CONSOLIDATED STATEMENTS OF COMPREHENSIVE INCOME
(in millions of Canadian dollars)
Three months ended
Nine months ended
(unaudited)
September 30
September 30
2026
2025
2026
2025
Net income
$
302.6
$
238.7
$
802.2
$
639.2
Other comprehensive (loss) income:
Items that may be reclassified to income:
Cash flow hedges:
(Loss) gain on valuation of derivative financial instruments
(9.1)
0.9
(32.6)
46.9
Deferred income taxes
1.7
(1.5)
3.2
(4.0)
Gain (loss) on translation of foreign operations
1.0
(0.3)
17.0
(3.4)
Items that will not be reclassified to income:
Equity investments:
Gain (loss) on revaluation of equity investments
1.4
(6.9)
(5.3)
15.1
Deferred income taxes
(0.2)
0.9
0.7
(2.0)
(5.2)
(6.9)
(17.0)
52.6
Comprehensive income
$
297.4
$
231.8
$
785.2
$
691.8
Comprehensive income (loss) attributable to
Shareholders
$
291.7
$
229.2
$
774.0
$
697.1
Non-controlling interests
5.7
2.6
11.2
(5.3)
QUEBECOR INC.
SEGMENTED INFORMATION
(in millions of Canadian dollars)
(unaudited)
Three months ended September 30, 2026
Sports
Head
and
office
Telecommuni-
Enter-
and Inter-
cations
Media
tainment
segments
Total
Revenues
$
1,267.6
$
154.2
$
64.5
$
(31.6)
$
1,454.7
Employee costs
124.4
30.1
10.3
1.5
166.3
Purchase of goods and services
495.7
84.4
40.1
(38.5)
581.7
Adjusted EBITDA1
647.5
39.7
14.1
5.4
706.7
Depreciation and amortization
219.0
Financial expenses
79.5
Restructuring, impairment of assets and other
1.8
Other items
(3.3)
Income before income taxes
$
409.7
Cash flows used for capital expenditures
$
167.4
$
2.8
$
1.2
$
0.1
$
171.5
Three months ended September 30, 2025
Sports
Head
and
office
Telecommuni-
Enter-
and Inter-
cations
Media
tainment
segments
Total
Revenues
$
1,216.2
$
152.1
$
68.3
$
(31.1)
$
1,405.5
Employee costs
127.0
38.1
12.5
18.0
195.6
Purchase of goods and services
486.7
90.6
40.8
(36.3)
581.8
Adjusted EBITDA1
602.5
23.4
15.0
(12.8)
628.1
Depreciation and amortization
213.6
Financial expenses
85.0
Restructuring, impairment of assets and other
8.1
Other items
(0.1)
Income before income taxes
$
321.5
Cash flows used for capital expenditures
$
131.7
$
5.2
$
1.2
$
0.2
$
138.3
QUEBECOR INC.
SEGMENTED INFORMATION (continued)
(in millions of Canadian dollars)
(unaudited)
Nine months ended September 30, 2026
Sports
Head
and
office
Telecommuni-
Enter-
and Inter-
cations
Media
tainment
segments
Total
Revenues
$
3,719.1
$
495.5
$
161.9
$
(86.4)
$
4,290.1
Employee costs
406.4
118.1
39.2
94.6
658.3
Purchase of goods and services
1,403.9
313.1
103.7
(99.6)
1,721.1
Adjusted EBITDA1
1,908.8
64.3
19.0
(81.4)
1,910.7
Depreciation and amortization
645.8
Financial expenses
235.2
Restructuring, impairment of assets and other
8.2
Other items
(42.6)
Income before income taxes
$
1,064.1
Cash flows used for capital expenditures
$
498.3
$
5.2
$
4.2
$
0.2
$
507.9
Nine months ended September 30, 2025
Sports
Head
and
office
Telecommuni-
Enter-
and Inter-
cations
Media
tainment
segments
Total
Revenues
$
3,563.1
$
491.1
$
169.5
$
(94.7)
$
4,129.0
Employee costs
384.5
128.4
38.6
57.5
609.0
Purchase of goods and services
1,385.2
348.6
107.7
(104.3)
1,737.2
Adjusted EBITDA1
1,793.4
14.1
23.2
(47.9)
1,782.8
Depreciation and amortization
642.7
Financial expenses
263.5
Restructuring, impairment of assets and other
27.4
Other items
(8.7)
Income before income taxes
$
857.9
Cash flows used for capital expenditures
$
467.2
$
13.3
$
3.8
$
0.2
$
484.5
1
The Chief Executive Officer uses adjusted EBITDA as the measure of profit to assess the performance of each segment. Adjusted EBITDA is a non-IFRS measure and is defined as net income before depreciation and amortization, financial expenses, restructuring, impairment of assets and other, other items and income taxes.
QUEBECOR INC.
CONSOLIDATED STATEMENTS OF EQUITY
(in millions of Canadian dollars)
(unaudited)
Equity attributable to shareholders
Equity
attributable
to non-
controlling
interests
Accumulated
other com-
prehensive
(loss) income
Capital
stock
Contributed
surplus
Retained
earnings
Total equity
Balance as of December 31, 2024
$
1,041.2
$
17.4
$
1,143.6
$
(45.0)
$
107.5
$
2,264.7
Net income (loss)
–
–
644.5
–
(5.3)
639.2
Other comprehensive income
–
–
–
52.6
–
52.6
Dividends
–
–
(241.5)
–
(0.4)
(241.9)
Repurchase of Class B Shares
(24.6)
–
(115.4)
–
–
(140.0)
Issuance of Class B Shares
6.6
2.2
–
–
–
8.8
Balance as of September 30, 2025
1,023.2
19.6
1,431.2
7.6
101.8
2,583.4
Net income
–
–
211.5
–
10.1
221.6
Other comprehensive income
–
–
–
89.4
0.1
89.5
Dividends
–
–
(79.7)
–
–
(79.7)
Repurchase of Class B Shares
(10.4)
–
(67.4)
–
–
(77.8)
Balance as of December 31, 2025
1,012.8
19.6
1,495.6
97.0
112.0
2,737.0
Net income
–
–
792.7
–
9.5
802.2
Other comprehensive income
–
–
–
(18.7)
1.7
(17.0)
Dividends
–
–
(280.7)
–
–
(280.7)
Repurchase of Class B Shares
(25.7)
–
(211.9)
–
–
(237.6)
Issuance of Class B Shares
0.8
0.7
–
–
–
1.5
Business acquisition
–
–
–
–
118.9
118.9
Balance as of September 30, 2026
$
987.9
$
20.3
$
1,795.7
$
78.3
$
242.1
$
3,124.3
CONSOLIDATED STATEMENTS OF CASH FLOWS
(in millions of Canadian dollars)
Three months ended
Nine months ended
(unaudited)
September 30
September 30
2026
2025
2026
2025
Cash flows related to operating activities
Net income
$
302.6
$
238.7
$
802.2
$
639.2
Adjustments for:
Depreciation of property, plant and equipment
124.8
127.9
377.4
381.4
Amortization of intangible assets
61.2
52.3
169.3
164.0
Depreciation of right-of-use assets
33.0
33.4
99.1
97.3
Amortization of financing costs
2.1
2.1
6.4
6.8
Impairment of assets
0.2
3.6
0.9
5.1
Share of results in associates
(1.6)
(0.1)
(8.7)
(8.7)
Gain on revaluation of an equity interest
–
–
(30.1)
–
Deferred income taxes
66.7
25.8
28.4
3.4
Other
(2.9)
0.5
(7.1)
(1.5)
586.1
484.2
1,437.8
1,287.0
Net change in non-cash balances related to operating activities
6.7
97.6
144.9
253.0
Cash flows provided by operating activities
592.8
581.8
1,582.7
1,540.0
Cash flows related to investing activities
Capital expenditures
(171.5)
(138.3)
(507.9)
(484.5)
Deferred subsidies (used) received to finance capital expenditures
(11.5)
(4.6)
(19.6)
10.3
Business acquisitions, net of cash and cash equivalents acquired
–
–
(91.3)
–
Proceeds from disposals of assets
1.0
0.4
1.7
1.1
Other
4.2
0.8
9.7
2.0
Cash flows used in investing activities
(177.8)
(141.7)
(607.4)
(471.1)
Cash flows related to financing activities
Net change in short-term borrowings
(16.4)
(3.4)
575.1
(6.7)
Net change under revolving facilities, net of financing costs
15.4
(59.4)
22.7
–
Repayment of long-term debt
(200.0)
–
(1,000.0)
(400.0)
Repayment of lease liabilities
(34.1)
(33.3)
(97.1)
(93.5)
Issuance of Class B Shares
–
5.3
0.8
6.6
Repurchase of Class B Shares
(52.7)
(49.3)
(237.6)
(140.0)
Dividends
(100.5)
(80.7)
(280.7)
(241.9)
Cash flows used in financing activities
(388.3)
(220.8)
(1,016.8)
(875.5)
Net change in cash, cash equivalents and restricted cash
26.7
219.3
(41.5)
193.4
Effect of translation on cash and cash equivalents
in foreign currencies
(0.5)
–
(3.4)
–
Cash, cash equivalents and restricted cash at beginning of period
124.7
70.1
195.8
96.0
Cash, cash equivalents and restricted cash at end of period
$
150.9
$
289.4
$
150.9
$
289.4
QUEBECOR INC.
CONSOLIDATED BALANCE SHEETS
(in millions of Canadian dollars)
(unaudited)
September 30
December 31
2026
2025
Assets
Current assets
Cash and cash equivalents
$
135.3
$
160.6
Restricted cash
15.6
35.2
Accounts receivable
1,088.1
1,067.8
Contract assets
92.5
109.2
Inventories
380.6
414.3
Derivative financial instruments
12.4
–
Other current assets
195.3
195.2
1,919.8
1,982.3
Non-current assets
Property, plant and equipment
3,219.2
3,282.7
Intangible assets
3,666.0
3,441.9
Right-of-use assets
385.6
374.1
Goodwill
2,891.9
2,713.4
Derivative financial instruments
79.1
57.9
Deferred income taxes
51.1
42.0
Other assets
778.0
917.9
11,070.9
10,829.9
Total assets
$
12,990.7
$
12,812.2
Liabilities and equity
Current liabilities
Short-term borrowings
$
645.8
$
–
Accounts payable, accrued charges and provisions
1,150.1
1,142.2
Deferred revenue
376.5
376.3
Other current liabilities
63.2
95.6
Current portion of long-term debt
204.9
491.6
Current portion of lease liabilities
117.1
109.8
2,557.6
2,215.5
Non-current liabilities
Long-term debt
5,703.3
6,301.5
Lease liabilities
306.2
300.8
Derivative financial instruments
3.8
33.6
Deferred income taxes
911.5
871.7
Other liabilities
384.0
352.1
7,308.8
7,859.7
Equity
Capital stock
987.9
1,012.8
Contributed surplus
20.3
19.6
Retained earnings
1,795.7
1,495.6
Accumulated other comprehensive income
78.3
97.0
Equity attributable to shareholders
2,882.2
2,625.0
Non-controlling interests
242.1
112.0
3,124.3
2,737.0
Total liabilities and equity
$
12,990.7
$
12,812.2
View original content:https://www.prnewswire.com/news-releases/quebecor-inc-reports-consolidated-results-for-third-quarter-2026-302929776.html
SOURCE Québecor

You may like
Technology
Ashling’s Morgan Conque Named SMB Leader of the Year Finalist at the 2026 U.S. Forces in Business Awards
Published
59 seconds agoon
November 6, 2026By

The world’s largest celebration of veteran talent lands in Dallas, Texas, on December 10 to spotlight outstanding former service members driving American business forward.
CHICAGO, Nov. 6, 2026 /PRNewswire/ — Morgan Conque, Vice President of Go-to-Market at Ashling, a leading global provider of AI and Automation consulting and development services, has been named a finalist for SMB Leader of the Year at the 2026 U.S. Forces in Business Awards. Now in its ninth year, the program is the world’s largest celebration of military veterans in the civilian workforce, with this year’s shortlist selected from hundreds of nominations.
A U.S. Army officer commissioned through ROTC, Morgan served with NATO forces in Germany, ran personnel operations in South Korea, and advised an Afghan army hospital, where she helped cut the medical evacuation cycle from 17 hours to 3. She concluded her service as the Medical Operations and Logistics Officer for the First Cavalry Division, supporting more than 18,000 soldiers.
Morgan’s military experience translated into business leadership from the start. Following her service, she led branch operations for a large specialty infusion pharmacy team, then moved into intelligent automation and rapidly expanded her scope from bid manager to leading sales platforms, enablement, content, and strategy. Her education supports that trajectory, including a Bachelor of Science in Biology from Seattle University, a Master of Science in Biosecurity and Disaster Preparedness from Saint Louis University, and an Executive MBA from Baylor University’s Hankamer School of Business.
Today, Morgan leads go-to-market strategy at Ashling, aligning sales, marketing, and partnership teams to drive the fast-paced growth and navigate the ever evolving market landscape. “I look back on my transition into AI and automation as serendipitous,” Conque said. “The discipline I built in the Army, leading teams, making decisions with incomplete information, and staying accountable to the mission, carried directly into this field and suited me well. I remain fascinated by the conversations I’m part of and excited about where the industry is headed.”
More than 200,000 service members leave active duty in the United States each year, yet research by ZipRecruiter and the Call of Duty Endowment found that almost one-third of veterans are underemployed, a rate 15.6% higher than among their non-veteran peers. Morgan’s career is a testament to what that talent can achieve. Established in 2018, the Forces in Business Awards celebrate veteran role models like her, reflecting the breadth of industries and professional disciplines where former service members are making their mark.
Rear Admiral (Ret.) Milton “Jamie” Sands III, President and CEO of Special Operations Warrior Foundation, official charity partner of the U.S. Forces in Business Awards, said: “Congratulations to this year’s finalists, whose achievements demonstrate the value military experience brings to business. Service develops leaders who take responsibility, build strong teams, and deliver under pressure. These finalists are putting those qualities to work in new ways, strengthening their organizations and communities while helping others see what is possible after military service.”
Marshall Sied, Co-Founder and Co-CEO of Ashling, said: “Morgan’s experience as a military veteran has clearly laid a strong foundation for the evolution of her career. At Ashling, she balances our fast-paced industry and constantly evolving capabilities with enthusiasm and clarity. Morgan has the unique ability of being a creative thinker, inspiring team leader, and strong operational executor all at once. We are honored to have Morgan help lead the charge on many of our most mission-critical initiatives. She is a very deserving finalist.”
Winners will be announced on December 10, 2026, at a black-tie gala in the Lincoln Ballroom at the Hilton Dallas Lincoln Centre, hosted by longtime CBS News anchor and Gold Star son Doug Dunbar.
About Ashling
Ashling is a global AI and automation consulting and development firm specializing in digital process transformation. They align on what value means for enterprises, design, build and manage solutions that work from pilot to production, and architect an operating model designed for rapid deployment and compounding success.
Ashling’s delivery accelerators get clients to production 5x faster and prove ROI sooner, backed by a delivery team of forward-deployed AI pods and award-winning innovation. Ashling is the firm enterprise clients trust, with over 400 clients across industries, an 86 NPS, and an unwavering commitment to the business outcomes they deliver.
About the Forces in Business Awards
The Forces in Business Awards is the world’s largest business celebration of the military community. Taking place in the United States and United Kingdom, the Awards program is the leading platform for uncovering and showcasing the achievements and talents of veterans, presenting them as visible role models for transitioning service members and recognizing aspirational employers for current and former servicemen and women. The prestigious events promote the value that veterans add to the economy after service.
Media Contact
Madison Ramsay, Senior Marketing Manager, Ashling madison.ramsay@ashlingpartners.com
View original content to download multimedia:https://www.prnewswire.com/news-releases/ashlings-morgan-conque-named-smb-leader-of-the-year-finalist-at-the-2026-us-forces-in-business-awards-302932150.html
SOURCE Ashling Partners
Technology
Diamond Foundry Announces First-Ever D200mm Single-Crystal Diamond
Published
1 minute agoon
November 6, 2026By

Breakthrough culminates 25 years of scientific pursuit and establishes a new scale for single-crystal diamond
SAN FRANCISCO, Nov. 6, 2026 /PRNewswire/ — Diamond Foundry Inc. today announced a major milestone in the history of materials technology: the creation of the first-ever D200mm single-crystal diamond, measuring 200 millimeters in diameter.
The achievement marks a fundamental step forward in humanity’s ability to manufacture diamond as a technology material at semiconductor-relevant scale.
The announcement accompanies a keynote by Diamond Foundry CEO Martin Roscheisen, delivered by video at CarbonSemi 2026 in Ningbo, China. Watch the keynote: https://youtu.be/ae0XQBDlLMQ.
Diamond has long been recognized as an extraordinary material for technology. It combines the highest thermal conductivity with exceptional mechanical strength, electrical insulation, optical properties, and the potential for extreme electronic performance. Yet its use in advanced technology has been constrained by one basic limitation: size.
Diamond Foundry’s D200mm breakthrough changes that.
Producing single-crystal diamond at D200mm scale required overcoming fundamental challenges in crystal growth, plasma physics, reactor engineering, materials science, process control, and manufacturing. The result is not an assembly of individual diamond pieces and not a polycrystalline diamond wafer. It is a single-crystal diamond at D200mm scale.
“This is one of those milestones that once seemed almost impossible,” said Martin Roscheisen, CEO of Diamond Foundry Inc. “Hundreds of DF engineers, scientists, and technicians contributed to us getting here. It is the accumulated result of countless experiments, failures, inventions, rebuilt machines, and insights over more than a decade.”
Roscheisen particularly recognized Stefan Gsell and Martin Fischer, whose work on scaling single-crystal diamond began 25 years ago.
“Stefan and Martin pursued this goal for 25 years,” Roscheisen said. “There are very few examples in technology of someone sticking to a really hard scientific challenge with that level of perseverance. They kept going when the prevailing view was that single-crystal diamond simply could not be made at this scale. Today, the perseverance shows as the first-ever D200mm single-crystal diamond. And best of all, it makes D300mm predictable as well.”
From Gemstone Dimensions to Semiconductor Dimensions
The semiconductor industry is built around the ability to manufacture extraordinary materials at wafer scale. Silicon’s progression toward larger wafers transformed electronics by allowing increasingly sophisticated devices to be manufactured economically and repeatably.
Diamond has never had an equivalent scaling path.
Natural diamond is constrained by geology. Conventional lab-grown diamond has historically been constrained to relatively small crystal dimensions. Even as the extraordinary properties of diamond became increasingly relevant to high-power electronics, AI computing, optics, quantum systems, and other advanced technologies, crystal size remained a fundamental bottleneck.
The D200mm single-crystal diamond milestone demonstrates a path beyond that limitation.
For Diamond Foundry, the achievement is part of a broader effort to turn single-crystal diamond from a scarce material measured in gemstones into a tech-industrial semiconductor substrate manufactured at scale.
The implications are particularly significant as computing systems encounter increasingly severe thermal constraints. Modern AI processors concentrate enormous amounts of power into microscopic regions of silicon. Diamond’s exceptional thermal conductivity can spread that heat at the material level, creating new possibilities for chip architectures, power densities, reliability, and cooling.
Twenty-Five Years of Perseverance
The D200mm achievement has roots extending well beyond Diamond Foundry itself.
For 25 years, Gsell and Fischer pursued the underlying scientific and engineering challenge of growing high-quality single-crystal diamond of scalable size. Their work ultimately became part of a much larger effort involving hundreds of people across Diamond Foundry.
The milestone reflects advances spanning plasma generation, growth chemistry, reactor architecture, crystal engineering, thermal management, metrology, automation, and manufacturing.
“Technology history is often written around the moment something finally works,” Roscheisen said. “But that moment rests on the people who were willing to spend years — sometimes decades — making it work. This diamond exists because hundreds of people contributed, and because a few people refused to give up on the idea for 25 years.”
A New Scale for Diamond
Diamond Foundry views D200mm not as an endpoint, but as the beginning of a new manufacturing era for diamond.
The company is developing single-crystal diamond for semiconductor and advanced-technology applications where diamond’s combination of thermal, mechanical, electrical, and optical properties can enable performance beyond the limits of conventional materials.
The first D200mm crystal is shown as grown and unpolished — directly from the growth process.
For a material that nature forms only under extraordinary conditions deep inside the Earth, the significance is simple:
Single-crystal diamond has entered the wafer-scale era.
About Diamond Foundry Inc.
Diamond Foundry is the #1 producer of single-crystal diamond in the world. Founded in San Francisco, the company created the world’s first diamond wafer and is scaling volume production of chip substrates with a $2.77B EU Chips Act project in Spain.
Media contact: Jeff Yurek, j@df.com
View original content to download multimedia:https://www.prnewswire.com/news-releases/diamond-foundry-announces-first-ever-d200mm-single-crystal-diamond-302931849.html
SOURCE Diamond Foundry
Technology
Qued Ranks No. 5 on FreightWaves’ 2027 FreightTech 25, Its Third Straight Year on the List
Published
1 minute agoon
November 6, 2026By

An independent panel ranked the AI appointment scheduling platform No. 5 of 25 companies selected from the 2027 FreightTech 100. FreightWaves announced the rankings Oct. 26 at the inaugural F3 Awards Dinner in Chattanooga.
BROADLANDS, Va., Nov. 6, 2026 /PRNewswire-PRWeb/ — Qued, a leader in developing sophisticated, automated appointment scheduling solutions for supply chain and logistics companies, today announced that it ranked No. 5 on the 2027 FreightTech 25, the FreightWaves list of 25 companies recognized for innovation across freight technology and transportation. FreightWaves revealed the list on Oct. 26 at the inaugural F3 Awards Dinner in Chattanooga, Tennessee.
This is the third year in a row Qued has made the FreightTech 25. Qued debuted at No. 6 in 2025 and ranked No. 3 in 2026.
The FreightTech 25 is selected from the FreightTech 100, a broader list of 100 companies FreightWaves recognizes for innovation in freight and supply chain technology. An independent panel ranks those 100 companies to set the top 25, and the accounting firm Henderson, Hutcherson & McCullough oversees the voting. FreightWaves recognized all 100 companies at the F3 Awards Dinner, where Sope Creek presented the 2027 FreightTech Awards.
“Appointment scheduling rarely makes headlines, so a third straight year on the FreightTech 25 means a lot to our team,” said Prasad Gollapalli, CEO and founder of Qued. “Our customers earned this ranking. They book their appointments through Qued from inside the systems they already run, and we will keep building for the people who move freight every day.”
Qued’s platform uses machine learning to find the best appointment slots in real time, weighing ETAs, facility capacity, historical performance, and the specific requirements of each location. Qued connects directly to the transportation management system a broker, 3PL, or carrier already runs, and it books through facility portals, email, and AI voice calls to facilities that only book by phone.
The full 2027 FreightTech 25 is published on FreightWaves.com.
About Qued
Qued is a cloud-based, AI-powered smart workflow automation platform transforming load appointment scheduling for brokers, 3PLs, and carriers. By automating the scheduling process, Qued eliminates manual work, simplifies multi-stop load appointments, and ensures seamless coordination across the supply chain, improving both operational efficiency and customer satisfaction. For more information, visit www.qued.com or contact us at contact.us@qued.com.
Media Contact
Adam Robinson, Qued, 1 2148720780, adam@the-robinson-agency.com, https://www.qued.com/
View original content:https://www.prweb.com/releases/qued-ranks-no-5-on-freightwaves-2027-freighttech-25-its-third-straight-year-on-the-list-302931740.html
SOURCE Qued


Ashling’s Morgan Conque Named SMB Leader of the Year Finalist at the 2026 U.S. Forces in Business Awards

Diamond Foundry Announces First-Ever D200mm Single-Crystal Diamond
Qued Ranks No. 5 on FreightWaves’ 2027 FreightTech 25, Its Third Straight Year on the List

Send Rakhi to UK swiftly with UK Gifts Portal

Whiteboard Series with NEAR | Ep: 45 Joel Thorstensson from ceramic.network

Nullmax and Renesas Forge Strategic Partnership to Deliver Competitive ADAS Solutions for the Global Market

Why You Should Build on #NEAR – Co-founder Illia Polosukhin at CV Labs
Whiteboard Series with NEAR | Ep: 45 Joel Thorstensson from ceramic.network

NEAR End of Year Town Hall 2021: The Open Web World, MetaBUILD 2 Hackathon and 2021 recap
Trending
-

 Coin Market5 days ago
Binance net outflows surge to $5.8B as withdrawals resume after record hack
-

 Coin Market5 days ago
THORChain halts swaps after block reorg bug, slowing Binance hackers
-
 Technology5 days ago
RD Technologies Upgrades Its Cross-Border Payments and Digital Finance Ecosystem
-
 Technology4 days ago
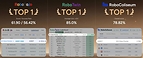
AGIBOT Unveils GO-3 Preview, Takes Top Spot on Three Embodied AI Benchmarks
-

 Technology5 days ago
Thunes and UnionPay International Transform Payments to China’s Mainland, Launching High-Capacity Instant Payouts
-

 Technology5 days ago
Ace nanochem Develops Three New Semiconductor Materials for Power Devices and Advanced Packaging
-
 Technology5 days ago
Tiger Brokers Brings Extended-Hours* US Options Trading to Investors Worldwide
-

 Technology5 days ago
FF EAI Robotics Ecosystem (FFR) CEO YT Jia Shares Weekly Investor Update: Recaps FFR’s Listing Closing and First Investor Day in New York; FFR Sold and Shipped 351 Robot Devices in October, Setting Another Monthly Record