
Technology
Couchbase Announces First Quarter Fiscal 2025 Financial Results
Published
2 years agoon
By
SANTA CLARA, Calif., June 5, 2024 /PRNewswire/ — Couchbase, Inc. (NASDAQ: BASE), the cloud database platform company, today announced financial results for its first quarter ended April 30, 2024.
“We grew ARR by 21% year-over-year, continued to increase our Capella mix, and made meaningful progress in our efforts to improve our operational rigor and efficiency,” said Matt Cain, Chair, President and CEO of Couchbase. “I’m particularly pleased that we delivered revenue and operating loss results that exceeded our outlook and delivered our first quarter of free cash flow positivity. I remain confident in our strategy and ability to achieve our objectives in fiscal 2025.”
First Quarter Fiscal 2025 Financial Highlights
Revenue: Total revenue for the quarter was $51.3 million, an increase of 25% year-over-year. Subscription revenue for the quarter was $49.0 million, an increase of 27% year-over-year.Annual recurring revenue (ARR): Total ARR as of April 30, 2024 was $207.7 million, an increase of 21% year-over-year as reported and on a constant currency basis. See the section titled “Key Business Metrics” below for details.Gross margin: Gross margin for the quarter was 88.9%, compared to 85.6% for the first quarter of fiscal 2024. Non-GAAP gross margin for the quarter was 89.9%, compared to 86.4% for the first quarter of fiscal 2024. See the section titled “Use of Non-GAAP Financial Measures” and the tables titled “Reconciliation of GAAP to Non-GAAP Results” below for details.Loss from operations: Loss from operations for the quarter was $22.5 million, compared to $22.5 million for the first quarter of fiscal 2024. Non-GAAP operating loss for the quarter was $6.7 million, compared to $12.9 million for the first quarter of fiscal 2024.Cash flow: Cash flow provided by operating activities for the quarter was $1.6 million, compared to cash flow used in operating activities of $7.2 million in the first quarter of fiscal 2024. Capital expenditures were $1.0 million during the quarter, leading to free cash flow of $0.6 million, compared to negative free cash flow of $8.5 million in the first quarter of fiscal 2024.Remaining performance obligations (RPO): RPO as of April 30, 2024 was $220.0 million, an increase of 33% year-over-year.
Recent Business Highlights
Delivered the general availability of vector search as a feature in Couchbase Capella and the Enterprise Edition of Couchbase Server to help businesses bring to market a new class of AI-powered adaptive applications that engage users in a hyper-personalized and contextualized way. Couchbase now supports retrieval-augmented generation (RAG) techniques in the cloud and the data center, with mobile and edge in a public beta.Announced the appointment of Julie Irish as Couchbase’s first Chief Information Officer. In this role, Irish will lead the global IT and security team and set the strategy for systems and IT to position Couchbase’s internal infrastructure for future growth and effectiveness in alignment with the company’s key business objectives.Announced intent to participate in the Google Cloud Ready Distributed Cloud program, a new program that Google announced at Google Cloud Next. The new program is designed to validate partner solutions on Google Distributed Cloud (GDC), Google’s AI-ready modern infrastructure that customers run on-premises at the edge. It allows customers to quickly find and deploy solutions that have been vetted by Google specifically for running on GDC. Through the program, Couchbase will become a powerful data storage and processing option for customers on GDC, providing a scalable, flexible multi-purpose database platform running locally on standardized Google Cloud infrastructure.Introduced the Google Cloud Couchbase connector as part of Google Application Integration Services. The Google Cloud Couchbase connector provides a direct conduit between Couchbase Capella and Google Cloud services, allowing developers to connect to and work directly with services such as Vertex AI, making it easy to develop data-driven AI powered applications.Introduced the Couchbase Docs chatbot which we built on Amazon Web Services (AWS) and is powered by Amazon Bedrock for the large language model. The chatbot is the latest example of our commitment to enhancing user experience with AI.
Financial Outlook
For the second quarter and full year of fiscal 2025, Couchbase expects:
Q2 FY2025 Outlook
FY2025 Outlook
Total Revenue
$50.6-51.4 million
$204.5-208.5 million
Total ARR
$212.5-215.5 million
$235.5-240.5 million
Non-GAAP Operating Loss
$5.7-4.7 million
$26.5-21.5 million
The guidance provided above is based on several assumptions that are subject to change and many of which are outside our control. If actual results vary from these assumptions, our expectations may change. There can be no assurance that we will achieve these results.
Couchbase is not able, at this time, to provide GAAP targets for operating loss for the second quarter or full year of fiscal 2025 because of the difficulty of estimating certain items excluded from non-GAAP operating loss that cannot be reasonably predicted, such as charges related to stock-based compensation expense. The effect of these excluded items may be significant.
Conference Call Information
Couchbase will host a live webcast at 1:30 p.m. Pacific Time (or 4:30 p.m. Eastern Time) on Wednesday, June 5, 2024, to discuss its financial results and business highlights. The conference call can be accessed by dialing 877-407-8029 from the United States, or +1 201-689-8029 from international locations. The live webcast and a webcast replay can be accessed from the investor relations page of Couchbase’s website at investors.couchbase.com.
About Couchbase
Modern customer experiences need a flexible database platform that can power applications spanning from cloud to edge and everything in between. Couchbase’s mission is to simplify how developers and architects develop, deploy and run modern applications wherever they are. We have reimagined the database with our fast, flexible and affordable cloud database platform Couchbase Capella, allowing organizations to quickly build applications that deliver premium experiences to their customers – all with best-in-class price performance. More than 30% of the Fortune 100 trust Couchbase to power their modern applications. For more information, visit www.couchbase.com and follow us on X (formerly Twitter) @couchbase.
Couchbase has used, and intends to continue using, its investor relations website and the corporate blog at blog.couchbase.com to disclose material non-public information and to comply with its disclosure obligations under Regulation FD. Accordingly, you should monitor our investor relations website and the corporate blog in addition to following our press releases, SEC filings and public conference calls and webcasts.
Use of Non-GAAP Financial Measures
In addition to our financial information presented in accordance with GAAP, we believe certain non-GAAP financial measures are useful to investors in evaluating our operating performance. We use certain non-GAAP financial measures, collectively, to evaluate our ongoing operations and for internal planning and forecasting purposes. We believe that non-GAAP financial measures, when taken together with the corresponding GAAP financial measures, may be helpful to investors because they provide consistency and comparability with past financial performance and meaningful supplemental information regarding our performance by excluding certain items that may not be indicative of our business, results of operations or outlook. Non-GAAP financial measures are presented for supplemental informational purposes only, have limitations as analytical tools and should not be considered in isolation or as a substitute for financial information presented in accordance with GAAP, and may be different from similarly-titled non-GAAP financial measures used by other companies. In addition, other companies, including companies in our industry, may calculate similarly-titled non-GAAP financial measures differently or may use other measures to evaluate their performance, all of which could reduce the usefulness of our non-GAAP financial measures as tools for comparison. Investors are encouraged to review the related GAAP financial measures and the reconciliation of these non-GAAP financial measures to their most directly comparable GAAP financial measures (provided in the financial statement tables included in this press release), and not to rely on any single financial measure to evaluate our business.
Non-GAAP gross profit, non-GAAP gross margin, non-GAAP operating loss, non-GAAP operating margin, non-GAAP net loss and non-GAAP net loss per share: We define these non-GAAP financial measures as their respective GAAP measures, excluding expenses related to stock-based compensation expense, employer payroll taxes on employee stock transactions, restructuring charges and impairment of capitalized internal-use software. We use these non-GAAP financial measures in conjunction with GAAP measures to assess our performance, including in the preparation of our annual operating budget and quarterly forecasts, to evaluate the effectiveness of our business strategies and to communicate with our board of directors concerning our financial performance.
Beginning with the fourth quarter of fiscal 2024, we have excluded the impairment of capitalized internal-use software, a non-cash operating expense, from our non-GAAP results as it is not reflective of ongoing operating results. This impairment charge relates to certain previously capitalized internal-use software that we determined would no longer be placed into service. Prior period non-GAAP financial measures have not been adjusted to reflect this change as we did not incur impairment of capitalized internal-use software in any prior period presented.
Free cash flow: We define free cash flow as cash used in operating activities less additions to property and equipment, which includes capitalized internal-use software costs. We believe free cash flow is a useful indicator of liquidity that provides our management, board of directors and investors with information about our future ability to generate or use cash to enhance the strength of our balance sheet and further invest in our business and pursue potential strategic initiatives.
Please see the reconciliation tables at the end of this press release for the reconciliation of GAAP and non-GAAP results.
Key Business Metrics
We review a number of operating and financial metrics, including ARR, to evaluate our business, measure our performance, identify trends affecting our business, formulate business plans and make strategic decisions.
We define ARR as of a given date as the annualized recurring revenue that we would contractually receive from our customers in the month ending 12 months following such date. Based on historical experience with customers, we assume all contracts will be renewed at the same levels unless we receive notification of non-renewal and are no longer in negotiations prior to the measurement date. For Capella products, ARR in a customer’s initial year is calculated as the greater of: (i) initial year contract revenue as described above or (ii) annualized prior 90 days of actual consumption; and ARR for subsequent years is calculated with method (ii). ARR excludes services revenue.
Prior to fiscal 2025, ARR excluded on-demand revenue and, for Capella products in a customer’s initial year, ARR was calculated solely on the basis of initial year contract revenue. The reason for these changes is to better reflect ARR where usage rates or timing of purchases may be uneven and to better align with how ARR is used to measure the performance of the business. ARR for prior periods has not been adjusted to reflect this change as it is not material to any period previously presented.
ARR should be viewed independently of revenue, and does not represent our revenue under GAAP on an annualized basis, as it is an operating metric that can be impacted by contract start and end dates and renewal dates. ARR is not intended to be a replacement for forecasts of revenue. Although we seek to increase ARR as part of our strategy of targeting large enterprise customers, this metric may fluctuate from period to period based on our ability to acquire new customers, expand within our existing customers and consumption dynamics. We believe that ARR is an important indicator of the growth and performance of our business.
We also attempt to represent the changes in the underlying business operations by eliminating fluctuations caused by changes in foreign currency exchange rates within the current period. We calculate constant currency growth rates by applying the applicable prior period exchange rates to current period results.
Forward-Looking Statements
This press release contains “forward-looking” statements within the meaning of the Private Securities Litigation Reform Act of 1995 that are based on management’s beliefs and assumptions and on information currently available to management. Forward-looking statements include, but are not limited to, quotations of management, the section titled “Financial Outlook” above and statements about Couchbase’s market position, strategies and potential market opportunities. Forward-looking statements generally relate to future events or our future financial or operating performance. Forward-looking statements include all statements that are not historical facts and, in some cases, can be identified by terms such as “anticipate,” “expect,” “intend,” “plan,” “believe,” “continue,” “could,” “potential,” “remain,” “may,” “might,” “will,” “would” or similar expressions and the negatives of those terms. However, not all forward-looking statements contain these identifying words. Forward-looking statements involve known and unknown risks, uncertainties and other factors, including factors beyond our control, which may cause our actual results, performance or achievements to be materially different from any future results, performance or achievements expressed or implied by the forward-looking statements. These risks include, but are not limited to: our history of net losses and ability to achieve or maintain profitability in the future; our ability to continue to grow on pace with historical rates; our ability to manage our growth effectively; intense competition and our ability to compete effectively; cost-effectively acquiring new customers or obtaining renewals, upgrades or expansions from our existing customers; the market for our products and services being relatively new and evolving, and our future success depending on the growth and expansion of this market; our ability to innovate in response to changing customer needs, new technologies or other market requirements, including new capabilities, programs and partnerships and their impact on our customers and our business; our limited operating history, which makes it difficult to predict our future results of operations; the significant fluctuation of our future results of operations and ability to meet the expectations of analysts or investors; our significant reliance on revenue from subscriptions, which may decline and, the recognition of a significant portion of revenue from subscriptions over the term of the relevant subscription period, which means downturns or upturns in sales are not immediately reflected in full in our results of operations; and the impact of geopolitical and macroeconomic factors. Further information on risks that could cause actual results to differ materially from forecasted results are included in our filings with the Securities and Exchange Commission that we may file from time to time, including those more fully described in our Annual Report on Form 10-K for the fiscal year ended January 31, 2024. Additional information will be made available in our Quarterly Report on Form 10-Q for the quarter ended April 30, 2024 that will be filed with the Securities and Exchange Commission, which should be read in conjunction with this press release and the financial results included herein. Any forward-looking statements contained in this press release are based on assumptions that we believe to be reasonable as of this date. Except as required by law, we assume no obligation to update these forward-looking statements, or to update the reasons if actual results differ materially from those anticipated in the forward-looking statements.
Couchbase, Inc.
Condensed Consolidated Statements of Operations
(in thousands, except per share data)
(unaudited)
Three Months Ended April 30,
2024
2023
Revenue:
License
$ 6,859
$ 4,943
Support and other
42,179
33,599
Total subscription revenue
49,038
38,542
Services
2,289
2,454
Total revenue
51,327
40,996
Cost of revenue:
Subscription(1)
3,957
3,673
Services(1)
1,725
2,249
Total cost of revenue
5,682
5,922
Gross profit
45,645
35,074
Operating expenses:
Research and development(1)
17,847
15,383
Sales and marketing(1)
37,755
32,553
General and administrative(1)
12,583
9,625
Restructuring(1)
—
46
Total operating expenses
68,185
57,607
Loss from operations
(22,540)
(22,533)
Interest expense
—
(25)
Other income, net
1,531
1,433
Loss before income taxes
(21,009)
(21,125)
Provision (benefit) for income taxes
(14)
750
Net loss
$ (20,995)
$ (21,875)
Net loss per share, basic and diluted
$ (0.42)
$ (0.48)
Weighted-average shares used in computing net loss per share, basic and diluted
49,788
45,843
(1)
Includes stock-based compensation expense as follows:
Three Months Ended April 30,
2024
2023
Cost of revenue—subscription
$ 266
$ 193
Cost of revenue—services
141
145
Research and development
3,993
2,768
Sales and marketing
5,223
3,241
General and administrative
5,004
2,928
Restructuring
—
1
Total stock-based compensation expense
$ 14,627
$ 9,276
Couchbase, Inc.
Condensed Consolidated Balance Sheets
(in thousands)
(unaudited)
As of April 30,
2024
As of January 31,
2024
Assets
Current assets
Cash and cash equivalents
$ 51,975
$ 41,351
Short-term investments
108,220
112,281
Accounts receivable, net
34,580
44,848
Deferred commissions
13,233
15,421
Prepaid expenses and other current assets
10,307
10,385
Total current assets
218,315
224,286
Property and equipment, net
6,113
5,327
Operating lease right-of-use assets
4,135
4,848
Deferred commissions, noncurrent
12,562
11,400
Other assets
1,446
1,891
Total assets
$ 242,571
$ 247,752
Liabilities and Stockholders’ Equity
Current liabilities
Accounts payable
$ 4,071
$ 4,865
Accrued compensation and benefits
8,939
18,116
Other accrued expenses
3,814
4,581
Operating lease liabilities
3,106
3,208
Deferred revenue
89,619
81,736
Total current liabilities
109,549
112,506
Operating lease liabilities, noncurrent
1,388
2,078
Deferred revenue, noncurrent
2,572
2,747
Total liabilities
113,509
117,331
Stockholders’ equity
Preferred stock
—
—
Common stock
—
—
Additional paid-in capital
640,931
621,024
Accumulated other comprehensive income (loss)
(215)
56
Accumulated deficit
(511,654)
(490,659)
Total stockholders’ equity
129,062
130,421
Total liabilities and stockholders’ equity
$ 242,571
$ 247,752
Couchbase, Inc.
Condensed Consolidated Statements of Cash Flows
(in thousands)
(unaudited)
Three Months Ended April 30,
2024
2023
Cash flows from operating activities
Net loss
$ (20,995)
$ (21,875)
Adjustments to reconcile net loss to net cash used in operating activities
Depreciation and amortization
400
890
Stock-based compensation, net of amounts capitalized
14,627
9,276
Amortization of deferred commissions
4,096
4,540
Non-cash lease expense
765
772
Foreign currency transaction losses (gains)
283
(84)
Other
(824)
(746)
Changes in operating assets and liabilities
Accounts receivable
10,165
(2,274)
Deferred commissions
(3,070)
(4,824)
Prepaid expenses and other assets
31
1,405
Accounts payable
(792)
5,458
Accrued compensation and benefits
(9,179)
(4,060)
Other Accrued Expenses
(813)
(1,256)
Operating lease liabilities
(843)
(826)
Deferred revenue
7,708
6,423
Net cash provided by (used in) operating activities
1,559
(7,181)
Cash flows from investing activities
Purchases of short-term investments
(19,454)
(7,821)
Maturities of short-term investments
24,144
19,423
Additions to property and equipment
(995)
(1,288)
Net cash provided by investing activities
3,695
10,314
Cash flows from financing activities
Proceeds from exercise of stock options
3,294
1,917
Proceeds from issuance of common stock under ESPP
1,795
847
Net cash provided by financing activities
5,089
2,764
Effect of exchange rate changes on cash, cash equivalents and restricted cash
(262)
(103)
Net increase in cash, cash equivalents and restricted cash
10,081
5,794
Cash, cash equivalents, and restricted cash at beginning of period
41,894
40,989
Cash, cash equivalents, and restricted cash at end of period
$ 51,975
$ 46,783
Reconciliation of cash, cash equivalents, and restricted cash within the consolidated balance sheets to the amounts shown above:
Cash and cash equivalents
$ 51,975
$ 46,240
Restricted cash included in other assets
—
543
Total cash, cash equivalents and restricted cash
$ 51,975
$ 46,783
Couchbase, Inc.
Reconciliation of GAAP to Non-GAAP Results
(in thousands, except per share data)
(unaudited)
Three Months Ended April 30,
2024
2023
Reconciliation of GAAP gross profit to non-GAAP gross profit:
Total revenue
$ 51,327
$ 40,996
Gross profit
$ 45,645
$ 35,074
Add: Stock-based compensation expense
407
338
Add: Employer taxes on employee stock transactions
70
10
Non-GAAP gross profit
$ 46,122
$ 35,422
Gross margin
88.9 %
85.6 %
Non-GAAP gross margin
89.9 %
86.4 %
Three Months Ended April 30,
2024
2023
Reconciliation of GAAP operating expenses to non-GAAP operating expenses:
GAAP research and development
$ 17,847
$ 15,383
Less: Stock-based compensation expense
(3,993)
(2,768)
Less: Employer taxes on employee stock transactions
(309)
(108)
Non-GAAP research and development
$ 13,545
$ 12,507
GAAP sales and marketing
$ 37,755
$ 32,553
Less: Stock-based compensation expense
(5,223)
(3,241)
Less: Employer taxes on employee stock transactions
(682)
(120)
Non-GAAP sales and marketing
$ 31,850
$ 29,192
GAAP general and administrative
$ 12,583
$ 9,625
Less: Stock-based compensation expense
(5,004)
(2,928)
Less: Employer taxes on employee stock transactions
(155)
(29)
Non-GAAP general and administrative
$ 7,424
$ 6,668
Three Months Ended April 30,
2024
2023
Reconciliation of GAAP operating loss to non-GAAP operating loss:
Total revenue
$ 51,327
$ 40,996
Loss from operations
$ (22,540)
$ (22,533)
Add: Stock-based compensation expense
14,627
9,275
Add: Employer taxes on employee stock transactions
1,216
267
Add: Restructuring(2)
—
46
Non-GAAP operating loss
$ (6,697)
$ (12,945)
Operating margin
(44) %
(55) %
Non-GAAP operating margin
(13) %
(32) %
Three Months Ended April 30,
2024
2023
Reconciliation of GAAP net loss to non-GAAP net loss:
Net loss
$ (20,995)
$ (21,875)
Add: Stock-based compensation expense
14,627
9,275
Add: Employer taxes on employee stock transactions
1,216
267
Add: Restructuring(2)
—
46
Non-GAAP net loss
$ (5,152)
$ (12,287)
GAAP net loss per share
$ (0.42)
$ (0.48)
Non-GAAP net loss per share
$ (0.10)
$ (0.27)
Weighted average shares outstanding, basic and diluted
49,788
45,843
(2)
For the three months ended April 30, 2023, an immaterial amount of stock-based compensation expense related to restructuring charges was
included in the restructuring expense line.
The following table presents a reconciliation of free cash flow to net cash provided by (used in) operating activities, the most directly comparable GAAP measure, for each of the periods indicated (in thousands, unaudited):
Three Months Ended April 30,
2024
2023
Net cash provided by (used in) operating activities
$ 1,559
$ (7,181)
Less: Additions to property and equipment
(995)
(1,288)
Free cash flow
$ 564
$ (8,469)
Net cash provided by investing activities
$ 3,695
$ 10,314
Net cash provided by financing activities
$ 5,089
$ 2,764
Couchbase, Inc.
Key Business Metrics
(in millions)
(unaudited)
As of
July 31,
Oct. 31,
Jan. 31,
April 30,
July 31,
Oct. 31,
Jan. 31,
April 30,
2022
2022
2023
2023
2023
2023
2024
2024
Annual Recurring Revenue
$ 145.2
$ 151.7
$ 163.7
$ 172.2
$ 180.7
$ 188.7
$ 204.2
$ 207.7
View original content to download multimedia:https://www.prnewswire.com/news-releases/couchbase-announces-first-quarter-fiscal-2025-financial-results-302165206.html
SOURCE Couchbase, Inc.

You may like
Technology
2CRSi SA: Annual Revenue of €416.2 Million¹, Up 88% for Fiscal Year 2025/26
Published
54 minutes agoon
July 23, 2026By
STRASBOURG, France, July 23, 2026 /PRNewswire/ — 2CRSi (ISIN: FR0013341781), a designer and manufacturer of high-performance, energy-efficient servers, today reports its revenue for fiscal year 2025/26. Over the period, the Group generated revenue of €416.2 million[1], an increase of more than 88% compared with fiscal year 2024/25 (€220.7 million).
Another Record-Breaking Year
This performance reflects the Group’s strong commercial momentum as well as the success of the strategic transformation launched nearly two years ago to position 2CRSi in the Artificial Intelligence infrastructure market.
Initially set at €300 million at the beginning of the fiscal year[2], then raised to more than €400 million in March 2026[3], the revenue target has now been exceeded, demonstrating the Group’s ability to anticipate market developments and successfully execute its commercial growth strategy in the rapidly expanding global Artificial Intelligence market. As a reminder, the €610 million framework agreement referred to in our detailed response[4] of July 16, 2026 generated no revenue during fiscal year 2025/26: the year’s growth was entirely driven by other orders that were delivered and invoiced.
Increasing Diversification of the Customer Portfolio
The portfolio of the Group’s main customers invoiced during the fiscal year consists predominantly of new customers signed during the period, demonstrating the Group’s ability to win new strategic accounts and rapidly convert its commercial pipeline into revenue.
2CRSi’s largest customer accounted for less than 20% of consolidated revenue, while the Group’s top five customers represented approximately 70%, compared with more than 90% in fiscal year 2024/25.
While equipment sales represented approximately 94% of total revenue, service revenue increased significantly in value to reach €24.7 million (compared with €8.3 million in 2024/25, representing growth of nearly 200%). As services generate higher margins, they will constitute a key development driver over the coming fiscal years. In particular, 2CRSi Cloud Solutions recorded its first significant billings, notably in connection with the ÆTHER project.
Positive Cash Flow and Strengthened Financial Position
At the end of the fiscal year, the Group’s cash position stood at €14.4 million1 (compared with -€0.2 million one year earlier), its highest year-end cash balance since its IPO in 2018. This strengthened financial position provides 2CRSi with the resources to support its continued growth trajectory.
Group Year-End Cash Position by Fiscal Year (in € thousands)
2026/27 Ambition: Targeting €1 Billion in Revenue
During the RAISE Summit, the global Artificial Intelligence summit held in Paris on July 8–9, 2026, bringing together more than 9,000 leading industry participants, the announcement[5] of the ÆTHER consortium members and the advanced negotiations for the upcoming acquisition by ÆTHER Infrastructures of two industrial sites in the Strasbourg region significantly boosted customer demand for the megawatts of computing capacity that will be deployed there. Like the other consortium members, 2CRSi expects to benefit from this momentum and anticipates an increase in order intake, with part of these orders expected to be delivered during the current fiscal year.
In light of this commercial momentum, 2CRSi confirms its ambition to achieve €1 billion in revenue during fiscal year 2026/27.
Beyond sustaining its growth trajectory, improving margins will also remain a key priority for the Group through increasing the contribution of services and higher value-added solutions to its overall business.
Next event: Publication of Fiscal Year 2025/26 Annual Results: October 29, 2026
About 2CRSi
Founded in 2005 in Strasbourg, France, 2CRSi designs, develops, and manufactures high-performance computing servers and innovative solutions for artificial intelligence, high-performance computing (HPC), and data storage. Committed to responsible and sustainable practices, the Group operates across multiple continents and provides highly energy-efficient technology solutions to industries including technology, manufacturing, gaming, scientific research, and data centers. 2CRSi has been listed since June 2018 on the regulated market of Euronext Paris (ISIN code: FR0013341781) and was transferred to Euronext Growth in November 2022.
For more information: https://2crsi.com/
Media Contacts
2CRSi
Jean-Philippe LLOBERA
France Director
investors@2crsi.com
03 68 41 10 70
Seitosei.Actifin
Foucauld Charavay
Financial Communication
Foucauld.charavay@seitosei-actifin.com
06 37 83 33 19
Seitosei.Actifin
Isabelle Dray
Financial Press Relations
isabelle.dray@seitosei-actifin.com
06 85 36 85 11
References:
[1] Unaudited Data
[2] https://investors.2crsi.com/wp-content/uploads/2024/01/2CRSI-announces-its-strategic-plan-with-a-strong-development-focus-in-the-US.pdf
[3] https://investors.2crsi.com/wp-content/uploads/2026/03/2CRSi-announces-an-increase-in-its-half-year-result-by-4.6.pdf
[4] https://investors.2crsi.com/wp-content/uploads/2026/07/2CRSis-detailed-response-to-the-allegations-in-the-Grizzly-Research-report.pdf
[5] https://investors.2crsi.com/wp-content/uploads/2026/07/2CRSi-the-AETHER-Consortium-Reveals-Itself.pdf
Regulatory filing PDF file
File: 2CRSi Announces 2026 Revenue of €416.2 Million an 88% Increase
View original content:https://www.prnewswire.com/news-releases/2crsi-sa-annual-revenue-of-416-2-million-up-88-for-fiscal-year-202526–302833032.html
SOURCE 2CRSi SA
Technology
Nearly Half of Senior Leaders Feel Only Partly Prepared to Lead AI Transformation, as Ambition Outpaces Readiness
Published
54 minutes agoon
July 23, 2026By
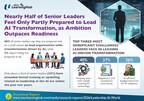
Almost half of senior leaders (46%) say they are prepared only to a small extent to lead organisation-wide transformation driven by AI, while 2% report being not prepared at all. Keeping pace with rapidly evolving AI technology is cited as the most significant challenge (40%) faced by senior leaders, followed by regulatory and compliance uncertainty (37%) and insufficient budget or resources for AI adoption (36%).Only about a third of senior leaders (34%) have attended formal training or upskilling related to leadership in the AI era within the past two years. Over half (53%) are planning to do so in the coming months and years, with 13% reporting no plans to undertake such training.The most common shift in leadership approach is an increased focus on people management during AI-driven change, cited by 37% of leaders, particularly in supporting morale and employee well-being. This is followed by greater time spent on upskilling themselves and their teams (31%), and on strategic decision-making (30%).
SINGAPORE, July 23, 2026 /PRNewswire/ — Artificial Intelligence (AI) is reshaping how organisations operate and compete. However, the leaders responsible for steering this transformation report a gap between what is expected of them and their preparedness to deliver. Almost half of senior leaders (46%) say they are prepared only to a small extent to lead organisation-wide transformation driven by AI, while a further 2% report being not prepared at all. In comparison, 37% are prepared to a moderate extent, and only 15% consider themselves prepared to a large extent.
Senior leaders identify several factors contributing to this readiness gap. Keeping pace with rapidly evolving AI technology is cited as the top challenge (40%), followed by regulatory and compliance uncertainty (37%). Resource constraints are also a key pressure point, with 36% pointing to insufficient budget or resources for AI adoption. In addition, 34% highlight challenges related to data quality and governance, while another 34% cite the need to upskill or reskill employees to work effectively alongside AI.
These are some of the key findings from NTUC LearningHub’s Special Report on Leadership in an AI-Driven World. The report surveyed 131 senior leaders from organisations of different sizes and across industries, including Infocomm Technology, Finance, Advanced Manufacturing, Healthcare and others. All respondents reported some level of experience with AI and are involved, to varying degrees, in AI adoption decisions within their organisation.
This readiness gap extends into decision-making. Senior leaders generally express moderate levels of confidence in making high-stakes AI-related decisions. Over two in five (43%) report being quite confident, while 13% say they are very confident. However, 40% indicate they are not very confident and 4% not confident at all.
Despite that, only about a third of senior leaders (34%) have attended formal training or upskilling on leading in an AI-driven workplace within the past two years. Among those who have not yet done so, many indicate plans to pursue training, including 22% within the next six months, 20% within the next year, and 11% within the next two years. Only 13% report having no plans to undertake such training. Among the training areas leaders prioritise, AI literacy and strategic understanding (57%) emerge as the key priority, followed by data-driven decision-making (46%), and ethical AI governance and responsible deployment (40%).
Alongside this, the most common shift in leadership approach is an increased focus on people management during AI-driven change, cited by 37% of leaders, particularly in supporting morale and employee well-being. This is followed by greater time spent on upskilling themselves and their teams (31%) and on strategic decision-making (30%). Ethical and governance considerations also feature strongly at 27%, alongside a similar share who report dedicating more effort to change management (27%), including communicating how AI may affect roles and ways of working.
These shifts reflect a broader recognition among leaders that navigating AI transformation requires more than technical fluency alone. Two in five (40%) senior leaders regard human-centric skills as very important in leading an organisation in the AI era, while nearly half (48%) consider them to be quite important. Among the capabilities leaders consider most critical, creative thinking and critical thinking each emerge at 47%, closely followed by sense-making (46%), problem-solving (44%) and effective communication (43%).
Commenting on the report’s findings, Mr Sean Lim, Chief Human Resource Officer, NTUC LearningHub, says, “The gap between expectation and readiness reflects a fundamental shift in what is required of leadership in today’s AI era. Leaders were once expected to hold all the answers and direct from the top. However, they must now act as strategic navigators, making sense of complexity and providing guidance through this period of rapid change and uncertainty. This means a shift towards coaching and empowering people, while also aligning competing priorities across technology, business and operational needs. It is a demanding shift, but it is encouraging to know that many senior leaders are already planning to further their own development to lead their teams through this period of AI transformation.”
To download the Special Report on Leadership in an AI-Driven World, please visit https://www.ntuclearninghub.com/media/research-reports/2026/Leadership-AI-World. To find out more about the courses, training, and grants, please contact NTUC LearningHub at www.ntuclearninghub.com.
### END ###
About NTUC LearningHub
NTUC LearningHub is the leading Continuing Education and Training provider in Singapore which aims to transform the lifelong employability of working people. Since our corporatisation in 2004, we have been working with employers and individual learners to provide learning solutions in areas such as Infocomm Technology, Generative AI & Cloud, Healthcare, Retail & Food Services, Employability & Literacy, Business Excellence, Workplace Safety & Health, Security, Human Resources & Coaching and Foreign Workers Training.
To date, NTUC LearningHub has helped over 34,000 organisations and achieved more than 3.2 million training places across more than 1,000 courses with a pool of about 1,000 certified trainers. As a Total Learning Solutions provider to organisations, we also forge partnerships to offer a wide range of relevant end-to-end training. Besides in-person training, we also offer instructor-led virtual live classes (VLCs) and asynchronous online learning. The NTUC LearningHub Learning eXperience Platform (LXP)—a one-stop online learning platform—offers timely, bite-sized and quality content for learners to upskill anytime and anywhere. Beyond learning, LXP also serves as a platform for jobs and skills development for both workers and companies.
For more information, visit www.ntuclearninghub.com.
View original content to download multimedia:https://www.prnewswire.com/apac/news-releases/nearly-half-of-senior-leaders-feel-only-partly-prepared-to-lead-ai-transformation-as-ambition-outpaces-readiness-302833038.html
SOURCE NTUC LearningHub Pte Ltd
Technology
THE LEGO GROUP INTRODUCES THE LEGO® SMART PLAY™ GATEWAY AT SAN DIEGO COMIC-CON 2026
Published
54 minutes agoon
July 23, 2026By

Booth #2829 invites attendees to step inside the worlds of two iconic franchises through the groundbreaking LEGO SMART Play experienceAttendees will be able to experience two beloved franchises like never before, as LEGO SMART Play adds a new dimension of interactive playOther exciting ways to experience the LEGO brand on-site July 23-26 include multiple new product reveals making global debuts, in-booth programming and a scavenger hunt for brand prizes
SAN DIEGO, July 23, 2026 /PRNewswire/ — The LEGO Group is unveiling the LEGO® SMART Play™ Gateway at San Diego Comic-Con 2026 — a booth experience powered by LEGO SMART Play technology that puts attendees right at the center of their fandoms and brings LEGO sets to life with a newfound layer of interactivity. At the LEGO SMART Play Gateway, fans will step inside the heart of two of pop culture’s most beloved franchises.
The LEGO Group will also further debut several new LEGO sets spanning numerous fandoms at San Diego Comic-Con 2026 — continuing to offer a LEGO set for every age and interest!
Enter a New Dimension of Play at the LEGO SMART Play Gateway
Launched this year, LEGO SMART Play provides open-ended physical play through responsive technology that reacts in real time. The LEGO SMART Play platform is powered by the SMART Brick, a 2×4 LEGO brick compatible with the LEGO System in Play that holds more than 20 patented world-first technologies. The SMART Brick can read SMART Tags and SMART Minifigures, synthesize light and sounds and sense precise motion, allowing kids to build, interact and create their own stories as their creations play back.
Attendees at San Diego Comic-Con 2026 are invited to step through the doors of the LEGO SMART Play Gateway, a retro-futuristic interworld departure terminal. Blending mid-century modern design with the technological optimism of LEGO SMART Play, the space transports fans from the show floor through SMART Play™-powered portals and into one of two fully immersive destinations:
Destination: LEGO Pokémon™ Lab
Destination: LEGO Pokémon™ Lab invites fans into the starting point of every Pokémon Trainer’s journey, a Lab recreated with scaled-up LEGO bricks and populated by life-sized LEGO Pokémon™ builds powered by LEGO SMART Play.Guests can choose their first partner Pokémon by selecting a Poké Ball to reveal Bulbasaur, Charmander or Squirtle and interact with their chosen Pokémon via SMART Brick lights and sounds. Portal visitors can further try out a game of “Hide and Pikachu” inspired by the LEGO Pokémon™ SMART Play: Training House with Pikachu set or interact with Eevee as its ears sway and the gems around its glow.Don’t depart without exploring the display case highlighting a full range of LEGO Pokémon™ sets available this year.
Destination: Mos Eisley
Destination: Mos Eisley transports Star Wars™ fans straight to Mos Eisley Cantina, recreated as a series of oversized LEGO brick environments pulled directly from the world of LEGO Star Wars™ SMART Play (specifically, the LEGO Star Wars™ SMART Play: Mos Eisley Cantina™ set!).Interactive touchpoints are woven throughout, doubling as iconic photo opportunities: grab the mic and swing it to trigger a SMART Brick remix of the iconic Cantina Song as the Modal Nodes band plays along; slide into the infamous corner booth for a face-to-face encounter with Greedo; and visit the Dewback Petting Zoo for a photo op with a purring, snoozing Dewback.Eagle-eyed fans can also decode hidden Aurebesh signage to unlock in-universe Easter eggs scattered throughout the space.
“The excitement around LEGO SMART Play began earlier this year and continues to grow with the launch of new sets on August 1. We are thrilled to bring these themes to life at the LEGO SMART Play Gateway during San Diego Comic-Con,” said Beth McKenna, Head of U.S. Marketing at the LEGO Group. “LEGO SMART Play represents the most significant advancement in LEGO® play since the Minifigure. Comic-Con is the ideal venue to showcase the possibilities of LEGO SMART Play, where attendees unite over the stories, characters, and worlds they adore.”
Sets Debuting at San Diego Comic-Con 2026
Brand new sets from across the LEGO brand’s most beloved franchises, not specific to SMART Play, are on display flanking the rear of the gateway; as each display case operates as its own destination, inviting fans and enthusiasts to explore and build upon the worlds they love most.
Boldly Build Where No One Has Built Before with the NEW LEGO Icons Star Trek: U.S.S. Enterprise NCC-1701™ Bridge
The LEGO Icons Star Trek: U.S.S. Enterprise NCC-1701™ Bridge (11385), the ultimate tribute to one of the most iconic ships in sci-fi history, is a perfect way to celebrate Star Trek’s 60th anniversary in 2026 – and it reveals at San Diego Comic-Con!
This 1,701-piece set, available at LEGO Stores and LEGO.com exclusively beginning September 1 and available for pre-order now, recreates the iconic bridge and transporter room from the original series in authentic detail with eight LEGO Minifigures representing the Starfleet crew. Turn a dial to beam crew from the transporter room, swish open the turbo lift doors and rock the captain’s chair to simulate warp turbulence and space battles; this is a mission-worthy build for any Trekkie.
Outside of the booth, the U.S.S. Enterprise NCC-1701™ Bridge set will make its first appearance at the Star Trek: The Collector Frontier Panel, accompanied by LEGO set designers Henrik Andersen and Crystal Marie Fontan to explain the process and inspiration that went into recreating the U.S.S. Enterprise. The panel takes place Thursday, July 23, 11:00am to 12:00pm in Room 5AB. For those on the hunt for further LEGO Star Trek sights, be sure to visit the “Star Trek: Boldly Built” activation at the Marriot Marquis on W. Harbor Drive July 23-26, where attendees can take a photo in a LEGO brick-built Captain’s Chair – made out of 83,568 LEGO bricks!
Relive the Classic with the NEW LEGO Donkey Kong™ Arcade
Jump back into a classic age of gaming with the LEGO Donkey Kong Arcade (72051), on display for the first time at San Diego Comic-Con and available in stores August 1. This 1,367-piece collectible set pays homage to the iconic arcade cabinet, complete with Jumpman, Donkey Kong and Lady, plus scaffold, ladder and hammer details straight from the original Nintendo® game.
Pull the lever to release one of the 21 barrels at a time, move Jumpman with the joystick and press the button to make him jump over the barrels — there is even a mechanism to circulate the barrels in a continuous loop to keep the fun rolling! A must-have for adult fans of classic arcade games and retro decor.
Bringing the Swamp to San Diego with NEW LEGO Minifigures Shrek Series
The LEGO Minifigures Shrek Series (71053) brings 12 beloved characters from the franchise to Minifigure form at San Diego Comic-Con, each tucked inside a sealed mystery box for ages six and up. Discover Shrek, Fiona, Donkey, Puss in Boots, Lord Farquaad and more, most with at least one themed accessory like blind mice, a magic mirror or lollipop. Collect them all, play out scenes from the films or put them on display. These are available September 1, but the fairytale will continue in 2027 with more LEGO Shrek!
This summer marks the 25th anniversary of the first Shrek film, which launched a global blockbuster franchise. A new chapter begins next summer, when DreamWorks Animation’s Shrek 5 arrives in cinemas worldwide.
Within and Beyond the Booth
Attendees can explore the LEGO SMART Play™ Gateway from Thursday, July 23 to Sunday, July 26 at booth #2829, where the power of LEGO SMART Play comes to life across every corner of the experience.
Beyond the SMART Play Gateway, fans can attend LEGO-brand panels celebrating major milestones, hunt for exclusive LEGO finds in a scavenger hunt spanning the entire convention floor and take home collectible souvenirs to remember the experience:
LEGO NINJAGO® Celebrates – 15 Years and Counting! NINJAGO voice talent will take the stage to celebrate 15 years of everyone’s favorite minifig ninja team – LEGO NINJAGO! They will talk about their best-loved moments from hundreds of episodes and perform a staged reading of an all-new, exclusive canon scene written by fellow panelists, LEGO NINJAGO: Dragons Rising head writers Kevin Burke & Chris “Doc” Wyatt. Thursday, July 23, 2:15pm-3:15pm in Room 6BCF. In-booth signings July 23, 4:00pm-5:00pm and Friday, July 24 2:30pm-3:30pm. NINJAGO fans will be further pleased to know that the LEGO brand debuted the third installation of its partnership with Crocs™, the NINJAGO collection, at San Diego Comic-Con this morning, The release features Classic Clogs for adults and kids inspired by one of the franchise’s most beloved heroes, Lloyd; fans can further personalize their look with character-inspired Jibbitz™ charm packs.Lost Luggage Scavenger Hunt. Keep your eyes open — LEGO luggage tags are being hidden within the San Diego Convention Center daily, July 23-26. Find one and return it to the LEGO booth to claim a prize package, including exclusive brand artwork commissioned for San Diego Comic-Con 2026.Travel souvenirs to take home from your journey. Visitors can collect limited-edition boarding passes, exclusive LEGO Travel Guides, destination postcards and IP-themed travel stickers in-booth — all designed to commemorate the trip long after the show floor closes.
More Information
All products on display at the show, including LEGO set reveals, can be found at LEGO.com/san-diego-comic-con. For more information on the LEGO Group activities at San Diego Comic-Con, contact press@america.lego.com.
Notes to Editor
Product Information
LEGO® Icons Star Trek: U.S.S. Enterprise NCC-1701™ Bridge (11385)
Age Grade: 18+MSRP: $199.99Piece Count: 1,701Global Launch Date: September 1, 2027 (available for pre-order now) at LEGO Stores and LEGO.comDescription: Set course for a voyage of creativity with the LEGO® Icons Star Trek: U.S.S. Enterprise NCC-1701™ Bridge building set for adults. Recreate the iconic bridge and transporter room that served as the backdrop for epic scenes aboard the legendary starship. Rock the captain’s chair to simulate ship turbulence and turn a dial to beam crew members. Includes eight iconic Star Trek character Minifigures.
LEGO® Donkey Kong™ Arcade (72051)
Age Grade: 18+MSRP: $199.99Piece Count: 1367Global Launch Date: August 1, 2026 at LEGO Stores and select retailersDescription: Join Jumpman on the construction site again with this LEGO® brick model of the iconic Donkey Kong™ arcade game. Pull the lever for Donkey Kong to ‘throw’ barrels one after the other. Move Jumpman with the joystick and press the button to make him leap over the barrels. This set pays homage to the original Donkey Kong arcade cabinet game and makes a fun, nostalgic addition to your game room.
LEGO® Minifigures Shrek Series (71053)
Age Grade: 6+MSRP: $4.99Piece Count: 7Global Launch Date: September 1, 2026 at LEGO Stores and select retailersDescription: Enjoy movie adventures with LEGO® Minifigures Shrek Series mystery boxes. There are 12 detailed characters to collect, including Shrek, Fiona and Donkey, Puss in Boots, Prince Charming, Big Bad Wolf and Lord Farquaad and most come with at least one accessory. Expand your Minifigure collection or use them to play out your favorite scenes from the DreamWorks Animation’s Shrek films. Open your box and find out who’s inside!
About the LEGO Group
The LEGO Group’s mission is to inspire and develop the builders of tomorrow through the power of play. The LEGO System in Play, with its foundation in LEGO bricks, allows children and fans to build and rebuild anything they can imagine.
The LEGO Group was founded in Billund, Denmark in 1932 by Ole Kirk Kristiansen, its name derived from the two Danish words Leg Godt, which mean “Play Well”.
Today, the LEGO Group remains a family-owned company headquartered in Billund. Its products are now sold in more than 130 countries worldwide. For more information: www.LEGO.com.
About The Pokémon Company International
The Pokémon Company International manages the Pokémon property outside of Asia and is responsible for brand management, licensing, marketing, the Pokémon Trading Card Game, the animated TV series, home entertainment and the official Pokémon website. Pokémon was launched in Japan in 1996 and today is one of the most popular children’s entertainment properties in the world. For more information, please visit www.pokemon.co.uk.
STAR WARS and related properties are trademarks and/or copyrights, in the United States and other countries, of Lucasfilm Ltd. and/or its affiliates. © & TM Lucasfilm Ltd.
About Paramount Products & Experiences
Paramount Products & Experiences oversees all licensing, merchandising, and location-based experiences for Paramount, a Skydance Corporation (Nasdaq: PSKY), a leading next generation global media and entertainment company. The division brings to life iconic franchises and beloved characters through innovative products and immersive experiences across categories including toys, apparel, publishing, food and beverage, theme parks, hotels, cruises, attractions, and live entertainment. Its global portfolio is powered by content from brands such as Nickelodeon, Paramount Pictures, CBS, MTV, Comedy Central, and Paramount+, and fan-favorite franchises like PAW Patrol, SpongeBob SquarePants, Teenage Mutant Ninja Turtles, Star Trek, and Yellowstone. To explore our range of consumer products and Paramount-branded merchandise, visit ParamountShop.com.
TM & © 2026 CBS Studios Inc. Star Trek and related marks and logos are trademarks of CBS Studios Inc. All Rights Reserved.
About DreamWorks Animation’s Shrek Franchise
For the past two decades, children of all ages have been enchanted by DreamWorks Animation’s delightful, irreverent adventures of a misunderstood ogre and his ragtag group of roguish fairytale folk. Beginning with Shrek, the 2001 Academy Award® winner for Best Animated Feature, Shrek (Mike Myers), Fiona (Cameron Diaz), Donkey (Oscar® nominee Eddie Murphy), Puss in Boots (Oscar® nominee Antonio Banderas) and their signature friends, family and tormentors have grown into an indelible part of pop culture, reminding audiences around the globe that beauty is in the eye of the beholder.
The four Shrek franchise films have earned more than $2.9 billion worldwide, spawning a global live-touring show, an award-winning Broadway musical that earned eight Tony nominations and 12 Drama Desk nominations, plus an immersive, top-tourist destination in London and popular events and attractions across Universal Studios theme parks worldwide.
From an astonishing consumer products campaign to imaginative digital extensions and a global animation exhibition tour, the iconic age of Shrek now enters a thrilling new era in 2027, as DreamWorks Animation reimagines this wonderous tale for a new generation with Shrek 5. Stars Mike Myers, Cameron Diaz and Eddie Murphy return, now joined by Emmy winning superstar Zendaya (Dune franchise, Euphoria) as Shrek and Fiona’s daughter.
View original content to download multimedia:https://www.prnewswire.com/news-releases/the-lego-group-introduces-the-lego-smart-play-gateway-at-san-diego-comic-con-2026-302833040.html
SOURCE The LEGO Group

2CRSi SA: Annual Revenue of €416.2 Million¹, Up 88% for Fiscal Year 2025/26

Nearly Half of Senior Leaders Feel Only Partly Prepared to Lead AI Transformation, as Ambition Outpaces Readiness

THE LEGO GROUP INTRODUCES THE LEGO® SMART PLAY™ GATEWAY AT SAN DIEGO COMIC-CON 2026
Send Rakhi to UK swiftly with UK Gifts Portal

Whiteboard Series with NEAR | Ep: 45 Joel Thorstensson from ceramic.network

New Gooseneck Omni Antennas Offer Enhanced Signals in a Durable Package

Why You Should Build on #NEAR – Co-founder Illia Polosukhin at CV Labs
Whiteboard Series with NEAR | Ep: 45 Joel Thorstensson from ceramic.network

NEAR End of Year Town Hall 2021: The Open Web World, MetaBUILD 2 Hackathon and 2021 recap
Trending
-

 Technology4 days ago
Emdoor Launches “Ailyn” AI Hub at WAIC 2026: Unifying Intelligence Across Every Device
-

 Coin Market4 days ago
Saylor turns up heat with ‘110 reasons’ why BIP-110 is a bad idea
-

 Technology5 days ago
Laifen Expands U.S. Retail Footprint with Costco Launch of Best-Selling SE Hair Dryer
-

 Technology5 days ago
AI-Powered Connectivity: APAC Charts a Path to a Smarter Digital Future
-

 Coin Market3 days ago
Will the US get CLARITY this week? Bitcoin’s new $80K target: Hodler’s Digest, July 19
-

 Technology4 days ago
Penetron Strengthens Global Research Collaboration at ICSHM 2026
-

 Technology3 days ago
“Every Day CO₂ Challenge”: More Than a Game, A New Way of Learning
-
 Technology5 days ago
Best AI Design Tools (2026): CapCut Named a Top Choice for Creating Images and Marketing Assets by Software Experts