18% sequential royalty revenue growth and record AI licensing revenues, with multi-year smartphone modem ramp ahead
ROCKVILLE, Md., Nov. 9, 2026 /PRNewswire/ — Ceva, Inc. (NASDAQ: CEVA), the leading licensor of silicon and software IP for the Smart Edge, today announced its financial results for the third quarter ended September 30, 2026.
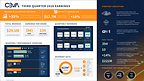
Third Quarter Highlights: *
Total revenues of $29.1 million, up 2% YoY.Licensing and related revenues of $16.3 million, up 2% YoY.Record AI licensing revenues, accounting for more than 35% of total licensing and related revenues.Royalty revenues of $12.7 million, up 3% YoY and 18% sequentially.623 million Ceva-powered devices shipped by customers, matching all-time quarterly record, including record cellular IoT and Wi-Fi 6 shipments.
*Unless otherwise stated, all comparisons are to the third quarter 2025.
Amir Panush, Chief Executive Officer of Ceva, commented, “We continued to grow our business in the third quarter, with 18% sequential royalty revenue growth and Ceva-powered device shipments matching our all-time quarterly record. In licensing, we achieved our highest-ever AI licensing revenues and expanded our relationships with three of our highest-volume connectivity customers, building a broader base of potential future royalty-generating products.
“The continued ramp of internally developed modems at a major U.S. customer is creating a multi-year smartphone royalty growth opportunity through 2027 and beyond. We are also extending our AI business into infrastructure applications and moving closer to initial NPU royalties. Together, we believe these developments reinforce the long-term growth potential of our Connect, Sense and Infer portfolio.”
Business and Market Highlights
During the quarter, Ceva signed 10 IP licensing agreements, including three with first-time customers. Six were for AI technologies, including one with a new customer targeting AI infrastructure, and Edge AI agreements targeting consumer, automotive and industrial markets.
In wireless connectivity, three of Ceva’s highest-volume customers extended their agreements for multiple years and added more Ceva IP, including one adding Wi-Fi 6 and Wi-Fi 7 to its existing Bluetooth and DSP deployments. In sensing, Ceva expanded its presence in smart TVs with a customer targeting advanced motion-based interaction.
Other Third Quarter Financial Data: *
GAAP gross margin was 85%, as compared to GAAP gross margin of 88%GAAP operating loss was $3.5 million, as compared to a GAAP operating loss of $2.1 millionGAAP net loss was $2.3 million, as compared to a GAAP net loss of $2.5 millionGAAP diluted loss per share was $0.08, as compared to GAAP diluted loss per share of $0.10Non-GAAP gross margin was 86%, as compared to non-GAAP gross margin of 89%Non-GAAP operating income was $2.5 million, as compared to non-GAAP operating income of $3.1 millionNon-GAAP net income and non-GAAP diluted earnings per share were $3.8 million and $0.13, respectively, as compared to non-GAAP net income and non-GAAP diluted earnings per share of $2.7 million and $0.11, respectively
*Unless otherwise stated, all comparisons are to the third quarter 2025.
Yaniv Arieli, Chief Financial Officer of Ceva, added, “Royalty revenues grew 18% sequentially, led by the ramp of internally developed modems at a major U.S. customer and continued strength in broad-based IoT and connectivity, partially offset by memory-related softness in compute-intensive consumer devices. A significant multi-year connectivity agreement we expected in the third quarter was signed early in the fourth quarter. With a robust licensing pipeline and a step-up in smartphone royalties, we expect a strong fourth quarter on both the top and bottom lines.”
Ceva Conference Call
On November 9, 2026, Ceva management will conduct a conference call at 8:30 a.m. Eastern Time to discuss the operating performance for the quarter.
The conference call will be available via the following dial-in numbers:
U.S. Participants: Dial +1 844-435-0316 (Access Code: Ceva)International Participants: Dial +1 412-317-6365 (Access Code: Ceva)
The conference call will also be available live via webcast at the following link: https://app.webinar.net/oKLP6DwbXyv. Please go to the website at least fifteen minutes prior to the call to register.
For those who cannot access the live broadcast, a replay will be available by dialing +1 855-669-9658 or +1 412-317-0088 (access code: 7028120) from one hour after the end of the call until 9:00 a.m. (Eastern Time) on November 16, 2026. The replay will also be available at Ceva’s website at www.ceva-ip.com.
Forward-Looking Statements
This press release contains forward-looking statements that involve risks and uncertainties, as well as assumptions that, if they materialize or prove incorrect, could cause the results of Ceva to differ materially from those expressed or implied by such forward-looking statements and assumptions. Forward-looking statements include statements about Ceva’s positioning for future growth and to serve as a foundational technology provider for intelligent, connected devices, licensing agreement wins, future industry demand, our market position for the future and future growth in the demand for our products, our forecast of financial measures for the following quarter and 2026, our long-term targets and underlying assumptions, our future investments, expectations about future markets, the success of our strategies and agreements, visibility into future revenue streams, and Ceva’s focus on expense management and profitability improvement. The risks, uncertainties and assumptions that could cause differing Ceva results include: the effect of intense industry competition; the ability of Ceva’s technologies and products incorporating Ceva’s technologies to achieve market acceptance; Ceva’s ability to meet changing needs of end-users and evolving market demands; the lengthy sales cycle for IP and related solutions; Ceva’s ability to diversify royalty streams and license revenues; geopolitical risks and instability, including the impact of tariffs and other trade measures and potential disruptions related to ongoing conflicts in the Middle East; and general market conditions and other risks relating to Ceva’s business and industry, including, but not limited to, those that are described from time to time in our SEC filings. Ceva assumes no obligation to update any forward-looking statements or information, which speak as of their respective dates.
About Ceva, Inc.
Ceva powers the Smart Edge, bridging the digital and physical worlds to bring AI-driven products to life. Our Ceva AI fabric portfolio of silicon and software IP enables devices to Connect, Sense, and Infer – the essential capabilities for the intelligent edge. From 5G, cellular IoT, Bluetooth, Wi-Fi, and UWB connectivity to scalable Edge AI NPUs, AI DSPs, sensor fusion processors and embedded software, Ceva provides the foundational IP for devices that connect, understand their environment, and act in real time.
With more than 23 billion devices shipped and trusted by 400+ customers worldwide, Ceva is the backbone of today’s most advanced smart edge products—from AI-infused wearables and IoT devices to autonomous vehicles and 5G infrastructure. Our differentiated solutions deliver seamless integration into existing design flows, total flexibility to combine solutions based on design needs and ultra‑low‑power performance in a minimal silicon footprint, helping customers accelerate development, reduce risk, and bring innovative products to market faster. As technology evolves toward Physical AI, Ceva’s IP portfolio lays the foundation for systems that are always connected, contextually aware, and capable of intelligent, real-time decision-making.
Visit us at www.ceva-ip.com and follow us on LinkedIn, X, YouTube, Facebook, and Instagram.
CEVA, INC. AND ITS SUBSIDIARIES
INTERIM CONDENSED CONSOLIDATED STATEMENTS OF LOSS – U.S. GAAP
U.S. dollars in thousands, except per share data
Three months ended
Nine months ended
September 30,
September 30,
2026
2025
2026
2025
Unaudited
Unaudited
Unaudited
Unaudited
Revenues:
Licensing and related revenues
$ 16,338
$ 16,028
$ 52,379
$ 46,092
Royalties
12,725
12,356
32,741
32,215
Total revenues
29,063
28,384
85,120
78,307
Cost of revenues
4,252
3,392
11,627
10,428
Gross profit
24,811
24,992
73,493
67,879
Operating expenses:
Research and development, net
18,128
19,532
57,297
55,899
Sales and marketing
3,935
3,012
10,980
9,783
General and administrative
6,154
4,383
15,557
12,697
Amortization of intangible assets
110
149
336
448
Total operating expenses
28,327
27,076
84,170
78,827
Operating loss
(3,516)
(2,084)
(10,677)
(10,948)
Financial income, net
2,301
1,245
5,156
5,466
Remeasurement of marketable equity securities
(16)
1
72
(261)
Loss before taxes on income
(1,231)
(838)
(5,449)
(5,743)
Income tax expense
1,070
1,671
4,221
3,797
Net loss
$ (2,301)
$ (2,509)
$ (9,670)
$ (9,540)
Basic and diluted net loss per share
$ (0.08)
$ (0.10)
$ (0.35)
$ (0.40)
Weighted-average shares used to compute net loss
per share (in thousands):
Basic and diluted
28,323
23,942
28,001
23,869
Unaudited Reconciliation of GAAP to Non-GAAP Financial Measures
U.S. dollars in thousands, except per share data
Three months ended
Nine months ended
September 30,
September 30,
2026
2025
2026
2025
Unaudited
Unaudited
Unaudited
Unaudited
GAAP net loss
$
(2,301)
$
(2,509)
$
(9,670)
$
(9,540)
Equity-based compensation expense included in cost of
revenues
173
168
533
493
Equity-based compensation expense included in research
and development expenses
2,130
2,639
7,651
7,778
Equity-based compensation expense included in sales
and marketing expenses
880
571
2,310
1,735
Equity-based compensation expense included in general
and administrative expenses
1,809
1,495
5,041
4,092
Amortization of intangible assets related to acquisition of
businesses
168
208
302
625
Acquisition and deal-related costs
893
145
1,014
433
Loss (income) associated with the remeasurement of
marketable equity securities
16
(1)
(72)
261
Non-GAAP net income
$
3,768
$
2,716
$
7,109
$
5,877
GAAP weighted-average number of Common Stock used
in computation of diluted net loss per share (in
thousands)
28,323
23,942
28,001
23,869
Weighted-average number of shares related to
outstanding stock-based awards (in thousands)
1,579
1,763
1,733
1,714
Non-GAAP weighted-average number of
Common Stock used in computation of diluted earnings
per share (in thousands)
29,902
25,705
29,734
25,583
GAAP diluted loss per share
$
(0.08)
$
(0.10)
$
(0.35)
$
(0.40)
Equity-based compensation expense
$ 0.18
$ 0.19
$ 0.54
$ 0.57
Amortization of intangible assets related to acquisition of
businesses
$ 0.00
$ 0.01
$ 0.01
$ 0.03
Acquisition and deal-related costs
$ 0.03
$ 0.01
$ 0.04
$ 0.02
Loss (income) associated with the remeasurement of
marketable equity securities
$ 0.00
$ 0.00
$ 0.00
$ 0.01
Non-GAAP diluted earnings per share
$ 0.13
$ 0.11
$ 0.24
$ 0.23
Three months ended
Nine months ended
September 30,
September 30,
2026
2025
2026
2025
Unaudited
Unaudited
Unaudited
Unaudited
GAAP operating loss
$ (3,516)
$ (2,084)
$ (10,677)
$ (10,948)
Equity-based compensation expense included in cost of
revenues
173
168
533
493
Equity-based compensation expense included in research
and development expenses
2,130
2,639
7,651
7,778
Equity-based compensation expense included in sales
and marketing expenses
880
571
2,310
1,735
Equity-based compensation expense included in general
and administrative expenses
1,809
1,495
5,041
4,092
Amortization of intangible assets related to acquisition of
businesses
168
208
302
625
Acquisition and deal-related costs
893
145
1,014
433
Total non-GAAP operating income
$ 2,537
$ 3,142
$ 6,174
$ 4,208
Three months ended
Nine months ended
September 30,
September 30,
2026
2025
2026
2025
Unaudited
Unaudited
Unaudited
Unaudited
GAAP gross profit
$ 24,811
$ 24,992
$ 73,493
$ 67,879
GAAP gross margin
85 %
88 %
86 %
87 %
Equity-based compensation expense included in cost of
revenues
173
168
533
493
Amortization of intangible assets related to acquisition of
businesses
58
59
(34)
177
Total non-GAAP gross profit
$ 25,042
$ 25,219
$ 73,992
$ 68,549
Non-GAAP gross margin
86 %
89 %
87 %
88 %
Three months ended
Nine months ended
September 30,
September 30,
2026
2025
2026
2025
Unaudited
Unaudited
Unaudited
Unaudited
GAAP operating expenses
$ 28,327
$27,076
$84,170
$ 78,827
Equity-based compensation expense included in
research and development expenses
(2,130)
(2,639)
(7,651)
(7,778)
Equity-based compensation expense included in sales
and marketing expenses
(880)
(571)
(2,310)
(1,735)
Equity-based compensation expense included in
general and administrative expenses
(1,809)
(1,495)
(5,041)
(4,092)
Amortization of intangible assets related to acquisition
of businesses
(110)
(149)
(336)
(448)
Acquisition and deal-related costs
(893)
(145)
(1,014)
(433)
Total non-GAAP operating expenses
$ 22,505
$ 22,077
$ 67,818
$ 64,341
CEVA, INC. AND ITS SUBSIDIARIES
INTERIM CONDENSED CONSOLIDATED BALANCE SHEETS
(U.S. dollars in thousands)
September 30,
December 31,
2026
2025 (*)
Unaudited
ASSETS
Current assets:
Cash and cash equivalents
$ 29,608
$ 40,586
Marketable securities and short-term bank deposits
191,072
181,397
Trade receivables, net
17,806
19,495
Unbilled receivables
28,683
29,860
Prepaid expenses and other current assets
14,235
13,498
Total current assets
281,404
284,836
Long-term assets:
Severance pay fund
6,901
7,530
Deferred tax assets, net
303
257
Property and equipment, net
9,161
7,054
Operating lease right-of-use assets
16,727
17,486
Investment in marketable equity securities
127
55
Goodwill
58,308
58,308
Intangible assets, net
532
1,044
Other long-term assets
17,148
11,686
Total assets
$ 390,611
$ 388,256
LIABILITIES AND STOCKHOLDERS’ EQUITY
Current liabilities:
Trade payables
$ 1,243
$ 2,418
Deferred revenues
3,444
3,496
Accrued expenses and other payables
18,378
21,026
Operating lease liabilities
2,797
1,743
Total current liabilities
25,862
28,683
Long-term liabilities:
Accrued severance pay
7,113
7,690
Operating lease liabilities
14,040
14,388
Other accrued liabilities
1,224
1,037
Total liabilities
48,239
51,798
Stockholders’ equity:
Common stock
29
28
Additional paid-in capital
354,941
337,966
Treasury stock
0
(1,591)
Accumulated other comprehensive income (loss)
(2,904)
79
Accumulated deficit
(9,694)
(24)
Total stockholders’ equity
342,372
336,458
Total liabilities and stockholders’ equity
$ 390,611
$ 388,256
(*) Derived from audited financial statements.
The Company believes that the presentation of non-GAAP measures in the press release is useful to investors in analyzing the results for the quarters ended September 30, 2026, and 2025 because the exclusion of the applicable expenses may provide a meaningful analysis of the Company’s core operating results and comparison of quarterly results. Further, the Company believes it is useful for investors to understand how the expenses associated with the application of FASB ASC No. 718 are reflected in its statements of loss. The reconciliation of financial measures should be reviewed in addition to and in conjunction with results presented in accordance with GAAP and is intended to provide additional insight into the Company’s operations that, when viewed with its GAAP results and the accompanying reconciliation, offers a more complete understanding of factors and trends affecting the Company’s business. The reconciliation of financial measures should not be viewed as a substitute for the Company’s reported GAAP results.
A reconciliation of non-GAAP guidance to the corresponding GAAP measures is not available on a forward-looking basis without unreasonable effort due to the uncertainty of expenses that may be incurred in the future, although it is important to note that these factors could be material to the Company’s results computed in accordance with GAAP.
View original content to download multimedia:https://www.prnewswire.com/news-releases/ceva-inc-announces-third-quarter-2026-financial-results-302932918.html
SOURCE Ceva, Inc.








 Technology3 days ago

 Near Videos4 days ago

 Coin Market3 days ago

 Technology4 days ago

 Technology3 days ago

 Technology4 days ago

 Technology4 days ago

 Technology3 days ago