Connect with us

Technology

XTransfer Launches Self-Developed Large Language Model TradePilot

Published

on

First Large Language Model in the Foreign Trade Financial Industry

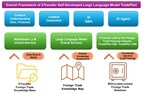
SHANGHAI, Sept. 11, 2024 /PRNewswire/ — XTransfer, the World’s Leading & China’s No.1 B2B Cross-Border Trade Payment Platform, is delighted to announce the successful launch of TradePilot, its self-developed large language model (LLM) for the foreign trade financial industry. This marks a significant advancement in foreign trade financial services for B2B small and medium-sized enterprises (SMEs).

With the rapid development of artificial intelligence technology, particularly using LLMs in various fields, the foreign trade financial sector has also seen new opportunities for transformation. After years of technological research and innovative practices, XTransfer has successfully introduced its self-developed LLM TradePilot for the foreign trade financial industry, marking a new stage for foreign trade financial services for B2B SMEs. This also signals the beginning of the “intelligent emergence” era for the foreign trade financial industry.

Currently, multimodal, long-context and AI Agents are three important directions in the field of AI LLMs, each with unique applications and research value. Multimodal relates to artificial intelligence systems that can process and understand different data types, including text, images, sound, and video. These systems can extract information from multiple data sources and conduct comprehensive analysis and understanding.

As an artificial intelligence system capable of understanding and processing long texts, long-context LLMs can understand complex semantics and logical structures, and provide long text content through natural language understanding, machine translation, and more. Natural language processing (NLP) handles topics, emotions, and logical relationships in long articles.

AI Agent is an artificial intelligence system that can autonomously perform tasks, make decisions, and interact with other systems or users. These agents can be virtual (chatbots and virtual assistants) or physical (autonomous vehicles and robots).

These three directions in artificial intelligence are interconnected and collectively drive the development and application of technology. Today, as global trade continues to evolve, foreign trade enterprises face unprecedented challenges and opportunities. XTransfer is dedicated to reducing the barriers and costs of global expansion for SMEs through technological means, and to promoting the digital development of the foreign trade industry.

Last year, XTransfer began research and development on TradePilot, an LLM for the foreign trade financial industry. The goal is to improve the efficiency and security of payment and financial services using advanced data analysis and artificial intelligence technology. After multiple rounds of improvements, the model incorporates a significant amount of business data and market demand. It uses the latest LLM training and fine-tuning techniques to ensure exceptional performance in risk management, customer service, and more.

In June of this year, XTransfer completed the training of two versions of the self-developed LLM TradePilot. TradePilot competed with many well-known domestic and international LLMs, including GPT-4, in the foreign trade financial professional knowledge assessment and won first place in the overall score*. Initial feedback suggests that the model has significantly improved transaction security and efficiency while reducing costs for foreign trade SMEs. It is gradually being effectively applied in multiple domains.

In terms of risk identification and management, TradePilot, through powerful context reasoning and natural language processing capabilities, can accurately predict and prevent potential transaction risks, greatly enhancing the market competitiveness of foreign trade SMEs.

The shift of B2B foreign trade business from offline to online has accelerated in recent years. However, the B2B model still involves many offline activities, leading to scattered and unstructured transaction data. This presents a challenge for anti-money laundering (AML) risk control in the B2B cross-border financial industry.

XTransfer has developed a data-driven, automated, internet-based, and intelligent infrastructure for AML risk control infrastructure centred around SMEs, establishing a new standard in AML risk control for the B2B foreign trade financial industry. By utilising multimodal information extraction of LLMs, including proforma invoices, logistics documents, and bills, XTransfer has achieved automatic matching of buyers and sellers, audit, and account verification, further improving the efficiency of AML risk control.

On the customer service front, TradePilot has integrated XTransfer AI-based customer service, achieving significant advancements in semantic recognition and understanding, effective response capabilities, and engaging exploration capabilities. The AI-based customer service response rate has increased from 13% to 84.2%.

Moreover, to fulfil foreign trade companies’ marketing and customer acquisition requirements, TradePilot’s AI-powered website has created tens of thousands of websites, thereby reducing the barrier to creating foreign trade websites. “AI Staff” have also assisted numerous foreign trade businesses in achieving precise customer acquisition.

Regarding technical implementation, TradePilot adopts a distributed computing architecture, ensuring the efficiency and stability of data processing. At the same time, TradePilot placed high importance on data security and privacy protection from the outset, in compliance with international and regional laws and regulations. Through encryption technology, access control, and audit mechanisms, the model ensures the integrity and security of user data.

The successful implementation of XTransfer’s LLM TradePilot for the foreign trade financial industry not only brings tangible benefits to foreign trade enterprises but also has a profound impact on the entire B2B foreign trade financial industry. With the model’s promotion and application, it is expected to drive the industry towards a more efficient, secure, and intelligent direction. In the future, XTransfer will continue to focus on technological innovation to promote the digital development of global trade.

Li Weitong, Senior Technical Director of XTransfer, stated: “The successful implementation of our self-developed LLM for the foreign trade financial industry is an important milestone. It not only demonstrates our technological innovation capabilities but also showcases our deep understanding of B2B foreign trade and precise grasp of the needs of SMEs. We believe that as the model continues to improve, it will bring even greater value to foreign trade enterprises. We look forward to seeing more enterprises achieve greater success in the global market through our technology and services.”

*Note: The evaluation is based on 5,000 foreign trade/cross-border financial-related test questions arbitrarily extracted from professional books, and the evaluation of the answers given by TradePilot and many well-known domestic and foreign large language models, with the main dimensions of factuality, relevance, and completeness, and the results of the evaluation by XTransfer’s expert panel (without labelling the names of the large language models).

– END –

About XTransfer

XTransfer, World’s Leading & China’s No.1 B2B Cross-Border Trade Payment Platform, is dedicated to providing SMEs with secure, compliant, fast, convenient and low-cost foreign trade payment & fund collection solutions, significantly reducing the cost of global expansion and enhancing global competitiveness. Founded in 2017, the company is headquartered in Shanghai and has branches in Hong Kong SAR, the United Kingdom, the Netherlands, the United States, Canada, Japan, Australia, and Singapore. XTransfer has obtained local payment licenses in Hong Kong, the United Kingdom, the United States, Canada, and Australia. With more than 550,000 enterprise clients, XTransfer has become the industry No.1 in China.

By cooperating with well-known multinational banks and financial institutions, XTransfer has built a unified global multi-currency clearing network and built a data-based, automated, Internet-based and intelligent anti-money laundering risk control infrastructure centred on small and medium enterprises. XTransfer uses technology as a bridge to link large financial institutions and small and medium enterprises around the world, allowing SMEs to enjoy the same level of cross-border financial services as large multinational corporations.

XTransfer completed its Series D financing in September 2021 and achieved unicorn status. The Company possesses a diverse composition of international investors, including D1 Capital Partners LP, Telstra Ventures, China Merchants Venture, eWTP Capital, Yunqi Capital, Gaorong Capital, 01VC, MindWorks and Lavender Hill Capital Partners.

For more information: https://www.xtransfer.com/

View original content to download multimedia:https://www.prnewswire.com/apac/news-releases/xtransfer-launches-self-developed-large-language-model-tradepilot-302244591.html

SOURCE XTransfer

Continue Reading
Click to comment

Leave a Reply

Your email address will not be published. Required fields are marked *

Technology

10x Genomics Reports First Quarter 2026 Financial Results

Published

on

By

PLEASANTON, Calif., May 7, 2026 /PRNewswire/ — 10x Genomics, Inc. (Nasdaq: TXG), a leader in single cell and spatial biology, today reported financial results for the first quarter ended March 31, 2026.

Recent Updates

Revenue was $150.8 million for the first quarter of 2026, representing a 3% decrease over the corresponding period of 2025. Excluding $16.8 million related to one-time license and royalty revenue in the first quarter of 2025, revenue increased 9% over the corresponding period of 2025.Launched Atera, a new platform to redefine how biology is measured and understood. Atera was engineered to deliver spatial whole-transcriptome analysis with single-cell sensitivity at unprecedented scale. The Company expects to start shipping Atera in the second half of 2026.Announced a partnership with Bioptimus, a global AI biotech company, to launch STELA, a multinational spatial data generation initiative to create foundational datasets connecting underlying biology with disease outcomes. The initiative is starting this effort on our Xenium platform and plans to expand to Atera over time.Ended the first quarter of 2026 with cash and cash equivalents and marketable securities of $539.8 million, representing a $112.9 million increase from March 31, 2025.

“We had a solid start to the year, with double-digit growth in Single Cell consumables reaction volumes and double-digit growth in Spatial consumables revenue,” said Serge Saxonov, Co-founder and CEO of 10x Genomics. “The biggest highlight is our recent launch of Atera, which represents the most significant product introduction in our history. We are extremely encouraged by the extraordinary early customer response.”

First Quarter 2026 Financial Results

Revenue was $150.8 million for the first quarter of 2026, a 3% decrease from the corresponding period of 2025. Excluding $16.8 million related to a patent litigation settlement recognized in the first quarter of 2025, revenue increased 9% over the corresponding period of 2025.

Gross margin was 70% for the first quarter of 2026, as compared to 68% for the corresponding prior year period. The increase in gross margin was primarily due to lower warranty costs and lower inventory write-downs, partially offset by a decrease in license and royalty revenue reflecting a non-recurring royalty benefit recognized in the first quarter of 2025.

Operating expenses were $123.2 million for the first quarter of 2026, a 15% decrease from $144.8 million for the corresponding prior year period. The decrease was primarily driven by lower outside legal expenses and personnel expenses, partially offset by a non-recurring gain on settlement of $9.2 million recognized in the first quarter of 2025.

Operating loss was $17.0 million for the first quarter of 2026, as compared to operating loss of $39.3 million for the corresponding prior year period.

Net loss was $13.5 million for the first quarter of 2026, as compared to a net loss of $34.4 million for the corresponding prior year period.

Cash and cash equivalents and marketable securities were $539.8 million as of March 31, 2026.

2026 Financial Guidance 

10x Genomics is maintaining its full year 2026 revenue guidance of $600 million to $625 million. Excluding the non-recurring license and royalty revenue related to patent litigation settlements in 2025, this represents 0% to 4% growth over full year 2025.

Webcast and Conference Call Information

10x Genomics will host a conference call to discuss the first quarter 2026 financial results, business developments and outlook after market close on Thursday, May 7, 2026 at 1:30 PM Pacific Time / 4:30 PM Eastern Time. A webcast of the conference call can be accessed at http://investors.10xgenomics.com. The webcast will be archived and available for replay at least 45 days after the event.

About 10x Genomics

10x Genomics is a life science technology company building products to accelerate the mastery of biology and advance human health. Our integrated research solutions include instruments, consumables and software for single cell and spatial biology, which help academic and translational researchers and biopharmaceutical companies understand biological systems at a resolution and scale that matches the complexity of biology. Our products are behind breakthroughs in oncology, immunology, neuroscience and more, fueling powerful discoveries that are transforming the world’s understanding of health and disease. To learn more, visit 10xgenomics.com or connect with us on LinkedIn, X, Facebook, Bluesky or YouTube.

Forward Looking Statements

This press release contains forward-looking statements within the meaning of the Private Securities Litigation Reform Act of 1995 as contained in Section 27A of the Securities Act of 1933, as amended, and Section 21E of the Securities Exchange Act of 1934, as amended, which are subject to the “safe harbor” created by those sections. All statements included in this press release, other than statements of historical facts, may be forward-looking statements. Forward-looking statements generally can be identified by the use of forward-looking terminology such as “may,” “might,” “will,” “should,” “expect,” “plan,” “outlook,” “anticipate,” “could,” “intend,” “target,” “project,” “contemplate,” “believe,” “see,” “estimate,” “predict,” “potential,” “would,” “likely,” “seek” or “continue” or the negatives of these terms or variations of them or similar terminology, but the absence of these words does not mean that a statement is not forward-looking. These forward-looking statements include statements regarding 10x Genomics, Inc.’s products, services, business strategy, collaborations and opportunities and 10x Genomics, Inc.’s financial performance and results of operations, including expectations regarding revenue and guidance. These statements are based on management’s current expectations, forecasts, beliefs, estimates, assumptions and information currently available to management. Actual outcomes and results could differ materially from these statements due to a number of factors and such statements should not be relied upon as representing 10x Genomics, Inc.’s views as of any date subsequent to the date of this press release. 10x Genomics, Inc. disclaims any obligation to update any forward-looking statements provided to reflect any change in 10x Genomics’ expectations or any change in events, conditions or circumstances on which any such statement is based, except as required by law. The material risks and uncertainties that could affect 10x Genomics, Inc.’s financial and operating results and cause actual results to differ materially from those indicated by the forward-looking statements made in this press release include those discussed under the captions “Risk Factors” and “Management’s Discussion and Analysis of Financial Condition and Results of Operations” in the company’s most recently-filed 10-K for the fiscal year ended December 31, 2025 filed on February 12, 2026 and the company’s quarterly report on Form 10-Q for the quarter ended March 31, 2026 to be filed with the U.S. Securities and Exchange Commission (“SEC”), and elsewhere in the documents 10x Genomics, Inc. files with the SEC from time to time.

Disclosure Information

10x Genomics uses filings with the Securities and Exchange Commission, its website (www.10xgenomics.com), press releases, public conference calls, public webcasts and its social media accounts as means of disclosing material non-public information and for complying with its disclosure obligations under Regulation FD.

Contacts

Investors: investors@10xgenomics.com

Media: media@10xgenomics.com

10x Genomics, Inc.

Condensed Consolidated Statements of Operations

(Unaudited)

(In thousands, except share and per share data)

Three Months Ended
March 31,

2026

2025

Products and services revenue

$      149,896

$      137,823

License and royalty revenue

947

17,060

Revenue (1)

150,843

154,883

Cost of products and services revenue (2)

44,665

49,438

Gross profit

106,178

105,445

Operating expenses:

Research and development (2)

56,847

64,245

Selling, general and administrative (2)

66,377

89,728

Gain on settlement

(9,200)

Total operating expenses

123,224

144,773

Loss from operations

(17,046)

(39,328)

Other income (expense):

Interest income

5,014

3,686

Other income (expense), net

(815)

2,136

Total other income

4,199

5,822

Loss before provision for income taxes

(12,847)

(33,506)

Provision for income taxes

623

852

Net loss

$      (13,470)

$      (34,358)

Net loss per share, basic and diluted

$         (0.10)

$         (0.28)

Weighted-average shares used to compute net loss per share, basic and diluted

128,291,153

122,606,091

__________________________

(1)

The following table represents total revenue by source for the periods indicated (in thousands). Spatial includes the Company’s Visium and Xenium products:

Three Months Ended
March 31,

2026

2025

Instruments

Single Cell

$         5,223

$         5,913

Spatial

6,039

8,902

Total instruments revenue

11,262

14,815

Consumables

Single Cell

88,894

84,109

Spatial

40,907

31,247

Total consumables revenue

129,801

115,356

Services

8,833

7,652

Products and services revenue

149,896

137,823

License and royalty revenue

947

17,060

Total revenue

$      150,843

$      154,883

(1)

The following table presents revenue by geography based on the location of the customer for the periods indicated (in thousands):

Three Months Ended
March 31,

2026

2025

Americas

United States*

$       76,693

$       86,818

Americas (excluding United States)

3,406

3,752

Total Americas

80,099

90,570

Europe, Middle East and Africa

36,852

31,895

Asia-Pacific

China

15,837

16,883

Asia-Pacific (excluding China)

18,055

15,535

Total Asia-Pacific

33,892

32,418

Total revenue

$      150,843

$      154,883

*

Includes license and royalty revenue.

(2)

Includes stock-based compensation expense as follows:

Three Months Ended
March 31,

(in thousands)

2026

2025

Cost of revenue

$         1,918

$         2,481

Research and development

10,695

14,106

Selling, general and administrative

10,029

14,489

Total stock-based compensation expense

$       22,642

$       31,076


10x Genomics, Inc.

Condensed Consolidated Balance Sheets

(Unaudited)

(In thousands)

March 31,
2026

December 31,
2025

Assets

Current assets:

Cash and cash equivalents

$      490,285

$      473,966

Marketable securities

49,563

49,443

Accounts receivable, net

39,031

47,013

Other receivables

17,106

35,480

Inventory

53,487

56,341

Prepaid expenses and other current assets

20,261

22,208

Total current assets

669,733

684,451

Property and equipment, net

220,591

226,711

Operating lease right-of-use assets

58,390

60,450

Goodwill

4,511

4,511

Intangible assets, net

59,910

62,329

Other noncurrent assets

2,624

2,913

Total assets

$    1,015,759

$    1,041,365

Liabilities and stockholders’ equity

Current liabilities:

Accounts payable

$       17,425

$       12,733

Accrued compensation and related benefits

21,506

42,500

Accrued expenses and other current liabilities

33,680

39,971

Deferred revenue

24,342

23,902

Operating lease liabilities

11,330

10,985

Contingent consideration, current

5,315

23,363

Total current liabilities

113,598

153,454

Contingent consideration, noncurrent

1,222

1,237

Operating lease liabilities, noncurrent

70,059

73,376

Deferred revenue, noncurrent

10,138

10,501

Other noncurrent liabilities

6,418

6,471

Total liabilities

201,435

245,039

Commitments and contingencies

Stockholders’ equity:

Preferred stock

Common stock

2

2

Additional paid-in capital

2,338,269

2,306,690

Accumulated deficit

(1,524,061)

(1,510,591)

Accumulated other comprehensive income

114

225

Total stockholders’ equity

814,324

796,326

Total liabilities and stockholders’ equity

$    1,015,759

$    1,041,365


View original content to download multimedia:https://www.prnewswire.com/news-releases/10x-genomics-reports-first-quarter-2026-financial-results-302766095.html

SOURCE 10x Genomics, Inc.

Continue Reading

Technology

OUTFRONT Media Announces Quarterly Dividend

Published

on

By

NEW YORK, May 7, 2026 /PRNewswire/ — OUTFRONT Media Inc. (NYSE: OUT) announced today that its board of directors has declared a quarterly cash dividend on the Company’s common stock of $0.30 per share payable on June 30, 2026, to shareholders of record at the close of business on June 5, 2026.

About OUTFRONT Media Inc.
OUTFRONT is one of the largest and most trusted out-of-home media companies in the U.S., helping brands connect with audiences in the moments and environments that matter most. As OUTFRONT evolves, it’s defining a new era of in-real-life (IRL) marketing, turning public spaces into platforms for creativity, connection, and cultural relevance. With a nationwide footprint across billboards, digital displays, transit systems, and other out-of-home formats, OUTFRONT turns creative into powerful real-world experiences. Its in-house agency, OUTFRONT STUDIOS, and award-winning innovation team, XLabs, deliver standout storytelling, supported by advanced technology and data tools that can drive measurable impact.

Contacts:

Investors

Media

Stephan Bisson

Courtney Richards

Investor Relations

Events & Communications

(212) 297-6573

(646) 876-9404

stephan.bisson@outfront.com 

courtney.richards@outfront.com 


View original content to download multimedia:https://www.prnewswire.com/news-releases/outfront-media-announces-quarterly-dividend-302766109.html

SOURCE OUTFRONT Media Inc.

Continue Reading

Technology

OUTFRONT Media Reports First Quarter 2026 Results

Published

on

By

Revenues of $429.6 million

Operating income of $55.9 million

 Net income attributable to OUTFRONT Media Inc. of $19.1 million

Adjusted OIBDA of $100.4 million

AFFO attributable to OUTFRONT Media Inc. of $61.0 million

Quarterly dividend of $0.30 per share, payable June 30, 2026

NEW YORK, May 7, 2026 /PRNewswire/ — OUTFRONT Media Inc. (NYSE: OUT) today reported results for the quarter ended March 31, 2026.

“Our first quarter results demonstrate our continued strong performance, with revenue, OIBDA, and AFFO all exceeding our guidance,” said Nick Brien, Chief Executive Officer of OUTFRONT Media. “Importantly, this exceptional performance was driven by strong results across our entire business, with billboard and transit both contributing to this success.”

Three Months Ended
March 31,

$ in Millions, except per share amounts

2026

2025

Revenues

$429.6

$390.7

Operating income

55.9

13.9

Adjusted OIBDA

100.4

64.2

Net income (loss) before allocation to redeemable and non-redeemable
 noncontrolling interests

19.3

(20.7)

Net income (loss)1

19.1

(20.6)

Net income (loss) per share1,2,3

$0.11

($0.14)

Funds From Operations (FFO)1

63.5

26.5

Adjusted FFO (AFFO)1

61.0

27.1

Shares outstanding3

177.1

166.4

Notes: See exhibits for reconciliations of non-GAAP financial measures; 1) References to “Net income (loss)”, “FFO” and “AFFO” mean “Net income (loss) attributable to OUTFRONT Media Inc.”, “FFO attributable to OUTFRONT Media Inc.” and “AFFO attributable to OUTFRONT Media Inc.,” respectively; 2) References to “per share” mean per common share for diluted earnings per weighted average share; 3) Diluted weighted average shares outstanding. 

First Quarter 2026 Results

Consolidated Results
Reported revenues of $429.6 million increased $38.9 million, or 10.0%, for the first quarter of 2026 as compared to the same prior-year period.

Total operating expenses of $227.5 million increased $6.2 million, or 2.8%, compared to the same prior-year period, due primarily to higher variable billboard property lease expenses, higher transit franchise costs, including higher guaranteed minimum annual payments to the New York Metropolitan Transportation Authority (the “MTA”) due to inflation, higher production expenses, and higher maintenance and utilities costs, partially offset by the impact of lost billboards in the period.

Selling, General and Administrative expenses (“SG&A”) of $107.3 million decreased $7.4 million, or 6.5%, compared to the same prior-year period, due primarily to lower compensation-related expenses, including severance and salaries, and lower credit card usage by customers, partially offset by higher professional fees, including software and technology expenses, a higher allowance for bad debt and higher client entertainment expenses.

Adjusted OIBDA of $100.4 million increased $36.2 million, or 56.4%, compared to the same prior-year period.

Segment Results

Billboard
Reported billboard segment revenues of $332.9 million increased $22.2 million, or 7.1%, compared to the same prior-year period, due primarily to higher proceeds from condemnations and an increase in average revenue per display (yield), including the impact of programmatic platforms on digital billboard revenues, partially offset by lost billboards in the period.

Operating expenses increased $3.5 million, or 2.4%, due primarily to higher variable billboard property lease costs, higher maintenance and utilities, higher site-related costs, and higher compensation-related expenses, partially offset by the impact of lost billboards in the period.

SG&A expenses increased $1.3 million, or 1.9%, due primarily to higher professional fees, including software and technology expenses, and a higher allowance for bad debt, partially offset by lower credit card usage by customers and lower compensation-related expenses.

Adjusted OIBDA of $116.4 million increased $17.4 million, or 17.6%, compared to the same prior-year period.

Transit
Reported transit segment revenues of $95.0 million increased $17.3 million, or 22.3%, compared to the same prior-year period, due primarily to an increase in average revenue per display (yield), partially offset by the impact of new and lost transit franchise contracts.

Operating expenses increased $3.0 million, or 4.0%, due primarily to higher guaranteed minimum annual payments to the MTA due to inflation, higher display production costs, and higher posting and rotation costs.

SG&A expenses increased $1.5 million, or 8.7%, due primarily to higher compensation-related expenses, including severance and commissions, higher professional fees, including higher software and technology expenses, partially offset by lower credit card usage by customers.

Adjusted OIBDA loss decreased $12.8 million, or 90.1%, compared to the same prior-year period.

Other
Reported revenues decreased $0.6 million, or 26.1%, operating expenses decreased $0.3 million, or 16.7%, and Adjusted OIBDA decreased $0.3 million, or 60.0%, compared to the same prior-year period, due primarily to a decrease in third-party digital equipment sales.

Corporate
Corporate expenses, excluding stock-based compensation, decreased $6.3 million, or 29.9%, compared to the same prior-year period to $14.8 million, due primarily to lower compensation-related expenses, including severance, and lower professional fees, including fees related to a management consulting project.

Interest Expense
Net interest expense in the first quarter of 2026 was $36.0 million, including amortization of deferred financing costs of $1.4 million, as compared to $36.0 million, including amortization of deferred financing costs of $1.5 million, in the same prior-year period. The weighted average cost of debt was 5.3% as of March 31, 2026 and 5.4% as of March 31, 2025.

Income Taxes
The provision for income taxes decreased $0.1 million, or 20.0%, in the first quarter of 2026 compared to the same prior-year period. Cash paid for income taxes in the three months ended March 31, 2026 was $0.4 million.

Net Income Attributable to OUTFRONT Media Inc.
Net income attributable to OUTFRONT Media Inc. was $19.1 million in the first quarter of 2026 compared to a Net loss attributable to OUTFRONT Media Inc. of $20.6 million in the same prior-year period. Diluted weighted average shares outstanding were 177.1 million for the first quarter of 2026 compared to 166.4 million for the same prior-year period. Net income per common share for diluted earnings per weighted average share was $0.11 in the first quarter of 2026 compared to a Net loss per common share for diluted earnings per weighted average share of $0.14 in the same prior-year period.

FFO
FFO attributable to OUTFRONT Media Inc. was $63.5 million in the first quarter of 2026, an increase of $37.0 million, or 139.6%, from the same prior-year period, driven primarily by higher Adjusted OIBDA.

AFFO
Starting at the end of 2025, we modified our calculation of AFFO to include amortization of direct lease acquisition costs instead of cash paid for direct lease acquisition costs, as management believes that this calculation of AFFO is a more appropriate measure of performance period-over-period and consistent with how we calculate FFO. Accordingly, relevant prior periods have been recast to conform to this presentation.

AFFO attributable to OUTFRONT Media Inc. was $61.0 million in the first quarter of 2026, an increase of $33.9 million, or 125.1%, from the same prior-year period, due primarily to higher Adjusted OIBDA and a higher non-cash effect of straight-line rent, partially offset by lower equity earnings.

Cash Flow & Capital Expenditures
Net cash flow provided by operating activities of $75.3 million for the three months ended March 31, 2026, increased $41.7 million, or 124.1%, compared to $33.6 million in the same prior-year period, due primarily to higher net income, as adjusted for non-cash items, the timing of accounts receivables and a decrease in accounts payable and accrued expenses, partially offset by a decrease in deferred revenues. Total capital expenditures increased $6.9 million, or 40.1%, to $24.1 million for the three months ended March 31, 2026, compared to the same prior-year period, due primarily to increased growth in digital displays, increased maintenance spending for billboard display upgrades and increased spending for safety-related projects.

Dividends
In the three months ended March 31, 2026, we paid cash dividends of $53.4 million on our common stock and vested restricted share units granted to employees. We announced on May 7, 2026, that our board of directors has approved a quarterly cash dividend on our common stock of $0.30 per share payable on June 30, 2026, to stockholders of record at the close of business on June 5, 2026.

Balance Sheet and Liquidity
As of March 31, 2026, our liquidity position included unrestricted cash of $67.2 million and $494.9 million of availability under our $500.0 million revolving credit facility, net of $5.1 million of issued letters of credit against the letter of credit facility sublimit under the revolving credit facility, and $150.0 million of additional availability under our accounts receivable securitization facility. During the three months ended March 31, 2026, no shares of our common stock were sold under our at-the-market equity offering program, of which $232.5 million remains available. Total indebtedness as of March 31, 2026 was $2.6 billion, excluding $14.8 million of deferred financing costs, and includes a $500.0 million term loan, $450.0 million of senior secured notes and $1.7 billion of senior unsecured notes.

Conference Call
We will host a conference call to discuss the results on May 7, 2026, at 4:30 p.m. Eastern Time. The conference call numbers are 833-461-5787 (U.S. callers) and 585-542-9983 (International callers) and the passcode for both is 404991578.  Live and replay versions of the conference call will be webcast in the Investor Relations section of our website, www.outfront.com.

Supplemental Materials
In addition to this press release, we have provided a supplemental investor presentation which can be viewed on our website, www.outfront.com.

About OUTFRONT Media Inc.
OUTFRONT is one of the largest and most trusted out-of-home media companies in the U.S., helping brands connect with audiences in the moments and environments that matter most. As OUTFRONT evolves, it’s defining a new era of in-real-life (IRL) marketing, turning public spaces into platforms for creativity, connection, and cultural relevance. With a nationwide footprint across billboards, digital displays, transit systems, and other out-of-home formats, OUTFRONT turns creative into powerful real-world experiences. Its in-house agency, OUTFRONT STUDIOS, and award-winning innovation team, XLabs, deliver standout storytelling, supported by advanced technology and data tools that can drive measurable impact.

Contacts:

Investors

Media

Stephan Bisson

Courtney Richards

Investor Relations

Events & Communications

(212) 297-6573

(646) 876-9404

stephan.bisson@outfront.com

courtney.richards@outfront.com

Non-GAAP Financial Measures
In addition to the results prepared in accordance with generally accepted accounting principles in the United States (“GAAP”) provided throughout this document, this document and the accompanying tables include non-GAAP financial measures as described below. We calculate and define “Adjusted OIBDA” as operating income (loss) before depreciation, amortization, net (gain) loss on dispositions and stock-based compensation. We calculate Adjusted OIBDA margin by dividing Adjusted OIBDA by total revenues. Adjusted OIBDA and Adjusted OIBDA margin are among the primary measures we use for managing our business, evaluating our operating performance and planning and forecasting future periods, as each is an important indicator of our operational strength and business performance. Our management believes users of our financial data are best served if the information that is made available to them allows them to align their analysis and evaluation of our operating results along the same lines that our management uses in managing, planning and executing our business strategy. Our management also believes that the presentations of Adjusted OIBDA and Adjusted OIBDA margin, as supplemental measures, are useful in evaluating our business because eliminating certain non-comparable items highlight operational trends in our business that may not otherwise be apparent when relying solely on GAAP financial measures.  It is management’s opinion that these supplemental measures provide users of our financial data with an important perspective on our operating performance and also make it easier for users of our financial data to compare our results with other companies that have different financing and capital structures or tax rates. When used herein, references to “FFO” and “AFFO” mean “FFO attributable to OUTFRONT Media Inc.” and “AFFO attributable to OUTFRONT Media Inc.,” respectively. We calculate FFO in accordance with the definition established by the National Association of Real Estate Investment Trusts (“NAREIT”). FFO reflects net income (loss) attributable to OUTFRONT Media Inc. adjusted to exclude gains and losses from the sale of real estate assets, depreciation and amortization of real estate assets, amortization of direct lease acquisition costs and the same adjustments for our equity-based investments and redeemable and non-redeemable noncontrolling interests, as well as the related income tax effect of adjustments, as applicable. We calculate AFFO as FFO adjusted to include amortization of direct lease acquisition costs as such costs are generally amortized over a period ranging from four weeks to one year and therefore are incurred on a regular basis. AFFO also includes cash paid for maintenance capital expenditures since these are routine uses of cash that are necessary for our operations. In addition, AFFO excludes certain non-cash items, including non-real estate depreciation and amortization, stock-based compensation expense, accretion expense, the non-cash effect of straight-line rent, amortization of deferred financing costs and the same adjustments for our redeemable and non-redeemable noncontrolling interests, along with the non-cash portion of income taxes, and the related income tax effect of adjustments, as applicable. We use FFO and AFFO measures for managing our business and for planning and forecasting future periods, and each is an important indicator of our operational strength and business performance, especially compared to other real estate investment trusts (“REITs”). Our management believes users of our financial data are best served if the information that is made available to them allows them to align their analysis and evaluation of our operating results along the same lines that our management uses in managing, planning and executing our business strategy. Our management also believes that the presentations of FFO and AFFO, as supplemental measures, are useful in evaluating our business because adjusting results to reflect items that have more bearing on the operating performance of REITs highlight trends in our business that may not otherwise be apparent when relying solely on GAAP financial measures. It is management’s opinion that these supplemental measures provide users of our financial data with an important perspective on our operating performance and also make it easier to compare our results to other companies in our industry, as well as to REITs. Since Adjusted OIBDA, Adjusted OIBDA margin, FFO and AFFO are not measures calculated in accordance with GAAP, they should not be considered in isolation of, or as a substitute for, operating income (loss) and net income (loss) attributable to OUTFRONT Media Inc., the most directly comparable GAAP financial measures, as indicators of operating performance. These measures, as we calculate them, may not be comparable to similarly titled measures employed by other companies. In addition, these measures do not necessarily represent funds available for discretionary use and are not necessarily a measure of our ability to fund our cash needs.

Please see Exhibits 4-5 of this release for a reconciliation of the above non-GAAP financial measures to the most directly comparable GAAP financial measures.

Cautionary Statement Regarding Forward-Looking Statements
We have made statements in this document that are forward-looking statements within the meaning of the federal securities laws, including the Private Securities Litigation Reform Act of 1995. You can identify forward-looking statements by the use of forward-looking terminology such as “believes,” “expects,” “could,” “would,” “may,” “might,” “will,” “should,” “seeks,” “likely,” “intends,” “plans,” “projects,” “predicts,” “estimates,” “forecast” or “anticipates” or the negative of these words and phrases or similar words or phrases that are predictions of or indicate future events or trends and that do not relate solely to historical matters. You can also identify forward-looking statements by discussions of strategy, plans or intentions related to our capital resources, portfolio performance and results of operations. Forward-looking statements involve numerous risks and uncertainties and you should not rely on them as predictions of future events. Forward-looking statements depend on assumptions, data or methods that may be incorrect or imprecise and may not be able to be realized. We do not guarantee that the transactions and events described will happen as described (or that they will happen at all). The following factors, among others, could cause actual results and future events to differ materially from those set forth or contemplated in the forward-looking statements: declines in advertising and general economic conditions; competition; government regulation; our ability to operate our digital display platform; losses and costs resulting from recalls and product liability, warranty and intellectual property claims; our ability to obtain and renew key municipal contracts on favorable terms; taxes, fees and registration requirements; decreased government compensation for the removal of lawful billboards; content-based restrictions on outdoor advertising; seasonal variations; acquisitions and other strategic transactions that we may pursue could have a negative effect on our results of operations; dependence on our management team and other key employees; experiencing a cybersecurity incident; changes in regulations and consumer concerns regarding privacy, information security and data, or any failure or perceived failure to comply with these regulations or our internal policies; asset impairment charges for our long-lived assets and goodwill; environmental, health and safety laws and regulations; expectations relating to environmental, social and governance considerations; our substantial indebtedness; restrictions in the agreements governing our indebtedness; incurrence of additional debt; interest rate risk exposure from our variable-rate indebtedness; our ability to generate cash to service our indebtedness; cash available for distributions; hedging transactions; the ability of our board of directors to cause us to issue additional shares of stock without common stockholder approval; certain provisions of Maryland law may limit the ability of a third party to acquire control of us; our rights and the rights of our stockholders to take action against our directors and officers are limited; our failure to remain qualified to be taxed as a REIT; REIT distribution requirements; availability of external sources of capital; we may face other tax liabilities even if we remain qualified to be taxed as a REIT; complying with REIT requirements may cause us to liquidate investments or forgo otherwise attractive investments or business opportunities; our ability to contribute certain contracts to a taxable REIT subsidiary (“TRS”); our planned use of TRSs may cause us to fail to remain qualified to be taxed as a REIT; REIT ownership limits; complying with REIT requirements may limit our ability to hedge effectively; the ability of our board of directors to revoke our REIT election at any time without stockholder approval; the Internal Revenue Service may deem the gains from sales of our outdoor advertising assets to be subject to a 100% prohibited transaction tax; establishing operating partnerships as part of our REIT structure; and other factors described in our filings with the Securities and Exchange Commission (the “SEC”), including but not limited to the section entitled “Risk Factors” in our Annual Report on Form 10-K for the year ended December 31, 2025, filed with the SEC on February 26, 2026. All forward-looking statements in this document apply as of the date of this document or as of the date they were made and, except as required by applicable law, we disclaim any obligation to publicly update or revise any forward-looking statement to reflect changes in underlying assumptions or factors, of new information, data or methods, future events or other changes.

EXHIBITS

Exhibit 1:  CONSOLIDATED STATEMENTS OF OPERATIONS
(Unaudited) See Notes on Page 14

Three Months Ended

March 31,

(in millions, except per share amounts)

2026

2025

Revenues

$         429.6

$         390.7

Expenses:

Operating

227.5

221.3

Selling, general and administrative

107.3

114.7

Net loss on dispositions

1.0

0.1

Depreciation

20.7

23.6

Amortization

17.2

17.1

Total expenses

373.7

376.8

Operating income

55.9

13.9

Interest expense, net

(36.0)

(36.0)

Income (loss) before provision for income taxes and equity in earnings of investee
 companies

19.9

(22.1)

Provision for income taxes

(0.4)

(0.5)

Equity in earnings of investee companies, net of tax

(0.2)

1.9

Net income (loss) before allocation to redeemable and non-redeemable noncontrolling
 interests

19.3

(20.7)

Net income (loss) attributable to redeemable and non-redeemable noncontrolling interests

0.2

(0.1)

Net income (loss) attributable to OUTFRONT Media Inc.

$           19.1

$         (20.6)

Net income (loss) per common share:

Basic

$           0.11

$         (0.14)

Diluted

$           0.11

$         (0.14)

Weighted average shares outstanding:

Basic

175.5

166.4

Diluted

177.1

166.4


Exhibit 2:  CONSOLIDATED STATEMENTS OF FINANCIAL POSITION
(Unaudited) See Notes on Page 14

As of

(in millions)

March 31,
2026

December 31,
2025

Assets:

Current assets:

Cash and cash equivalents

$           67.2

$           99.9

Receivables, less allowance ($25.0 in 2026 and $23.2 in 2025)

294.3

365.7

Prepaid lease and franchise costs

2.6

5.1

Prepaid MTA equipment deployment costs

0.2

Other prepaid expenses

25.6

21.9

Other current assets

11.6

11.1

Total current assets

401.5

503.7

Property and equipment, net

644.3

643.8

Goodwill

2,006.4

2,006.4

Intangible assets

603.6

612.0

Operating lease assets

1,553.8

1,521.5

Other assets

28.5

24.2

Total assets

$        5,238.1

$        5,311.6

Liabilities:

Current liabilities:

Accounts payable

$           33.3

$           50.2

Accrued compensation

42.4

72.3

Accrued interest

23.4

35.1

Accrued lease and franchise costs

62.7

72.2

Other accrued expenses

63.2

55.5

Deferred revenues

60.1

57.7

Short-term operating lease liabilities

179.5

172.9

Other current liabilities

27.6

29.4

Total current liabilities

492.2

545.3

Long-term debt, net

2,584.5

2,583.4

Asset retirement obligation

34.1

34.0

Operating lease liabilities

1,398.9

1,374.7

Other liabilities

39.2

40.3

Total liabilities

4,548.9

4,577.7

Commitments and contingencies

Redeemable noncontrolling interests

25.8

22.0

Stockholders’ equity:

Common stock (2026 – 450.0 shares authorized, and 176.1 shares issued and
 outstanding; 2025 – 450.0 shares authorized, and 175.2 issued and outstanding)

1.8

1.8

Additional paid-in capital

2,604.6

2,619.3

Distribution in excess of earnings

(1,944.6)

(1,910.8)

Accumulated other comprehensive loss

0.1

0.1

Total stockholders’ equity

661.9

710.4

Noncontrolling interests

1.5

1.5

Total liabilities and equity

$        5,238.1

$        5,311.6


Exhibit 3:  CONSOLIDATED STATEMENTS OF CASH FLOWS
(Unaudited) See Notes on Page 14

Three Months Ended

March 31,

(in millions)

2026

2025

Operating activities:

Net income (loss) attributable to OUTFRONT Media Inc.

$          19.1

$         (20.6)

Adjustments to reconcile net income (loss) to net cash flow provided by operating activities:

Net income (loss) attributable to redeemable and non-redeemable noncontrolling interests

0.2

(0.1)

Depreciation and amortization

37.9

40.7

Stock-based compensation

5.6

9.5

Provision for doubtful accounts

2.2

1.5

Accretion expense

0.7

0.7

Net loss on dispositions

1.0

0.1

Equity in earnings of investee companies, net of tax

0.2

(1.9)

Distributions from investee companies

0.3

0.3

Amortization of deferred financing costs and debt discount and premium

1.4

1.5

Change in assets and liabilities, net of investing and financing activities:

Decrease in receivables

69.2

45.3

Increase in prepaid MTA equipment deployment costs

(0.2)

(Increase) decrease in prepaid expenses and other current assets

(3.5)

0.8

Decrease in accounts payable and accrued expenses

(57.1)

(67.8)

Increase in operating lease assets and liabilities

0.5

2.1

Increase in deferred revenues

2.4

16.7

Increase (decrease) in income taxes

0.5

Other, net

(4.6)

4.3

Net cash flow provided by operating activities

75.3

33.6

Investing activities:

Capital expenditures

(24.1)

(17.2)

Acquisitions

(8.1)

(5.7)

MTA franchise rights

(1.8)

(4.0)

Net proceeds from dispositions

0.7

Investment in investee companies

(4.0)

Return of investments in investee companies

1.5

Net cash flow used for investing activities

(38.0)

(24.7)

Financing activities:

Proceeds from borrowings under short-term debt facilities

50.0

Repayments of borrowings under short-term debt facilities

(10.0)

Taxes withheld for stock-based compensation

(16.6)

(12.3)

Dividends

(53.4)

(53.0)

Net cash flow used for financing activities

(70.0)

(25.3)


Exhibit 3:  CONSOLIDATED STATEMENTS OF CASH FLOWS (Continued)
(Unaudited) See Notes on Page 14

Three Months Ended

March 31,

(in millions)

2026

2025

Net decrease in cash and cash equivalents

(32.7)

(16.4)

Cash and cash equivalents at beginning of period

99.9

46.9

Cash and cash equivalents at end of period

$          67.2

$          30.5

Supplemental disclosure of cash flow information:

Cash paid for income taxes

$           0.4

$            —

Cash paid for interest

47.1

46.2

Non-cash investing and financing activities:

Accrued purchases of property and equipment

3.3

13.4

Accrued MTA franchise rights

1.9

1.6

Taxes withheld for stock-based compensation

2.8

2.6


Exhibit 4:  SUPPLEMENTAL DISCLOSURES REGARDING NON-GAAP FINANCIAL INFORMATION
(Unaudited) See Notes on Page 14

Three Months Ended March 31, 2026

(in millions, except percentages)

Billboard

Transit

Other

Corporate

Consolidated

Revenues

$        332.9

$        95.0

$          1.7

$             —

$       429.6

Operating income (loss)

$         82.5

$         (6.4)

$          0.2

$          (20.4)

$         55.9

Net loss on dispositions

0.9

0.1

1.0

Depreciation

18.1

2.6

20.7

Amortization

14.9

2.3

17.2

Stock-based compensation

5.6

5.6

Adjusted OIBDA

$        116.4

$         (1.4)

$          0.2

$          (14.8)

$       100.4

Adjusted OIBDA margin

35.0 %

(1.5) %

11.8 %

*

23.4 %

Three Months Ended March 31, 2025

(in millions, except percentages)

Billboard

Transit

Other

Corporate

Consolidated

Revenues

$        310.7

$        77.7

$          2.3

$             —

$       390.7

Operating income (loss)

$         61.0

$       (17.0)

$          0.5

$          (30.6)

$         13.9

Net (gain) loss on dispositions

0.7

(0.6)

0.1

Depreciation

21.6

2.0

23.6

Amortization

15.7

1.4

17.1

Stock-based compensation

9.5

9.5

Adjusted OIBDA

$         99.0

$       (14.2)

$          0.5

$          (21.1)

$         64.2

Adjusted OIBDA margin

31.9 %

(18.3) %

21.7 %

*

16.4 %


Exhibit 5:  SUPPLEMENTAL DISCLOSURES REGARDING NON-GAAP FINANCIAL MEASURES  
(Unaudited) See Notes on Page 14

Three Months Ended

March 31,

(in millions)

2026

2025

Net income (loss) attributable to OUTFRONT Media Inc.

$           19.1

$         (20.6)

Depreciation of billboard advertising structures

16.2

18.8

Amortization of real estate-related intangible assets

14.3

15.1

Amortization of direct lease acquisition costs

13.0

13.2

Net loss on disposition of real estate assets

1.0

0.1

Adjustment related to redeemable and non-redeemable noncontrolling interests

(0.1)

(0.1)

FFO attributable to OUTFRONT Media Inc.

$           63.5

$           26.5

Non-cash portion of income taxes

0.5

Cash paid for direct lease acquisition costs

(13.0)

(13.2)

Maintenance capital expenditures

(7.0)

(6.3)

Other depreciation

4.5

4.8

Other amortization

2.9

2.0

Stock-based compensation

5.6

9.5

Non-cash effect of straight-line rent

2.4

1.1

Accretion expense

0.7

0.7

Amortization of deferred financing costs

1.4

1.5

AFFO attributable to OUTFRONT Media Inc.(a)

$           61.0

$           27.1


Exhibit 6:  SUPPLEMENTAL DISCLOSURES REGARDING NON-GAAP FINANCIAL MEASURES  
(Unaudited) See Notes on Page 14

Three Months Ended

March 31,

(in millions)

2026

2025

Adjusted OIBDA

$         100.4

$           64.2

Interest expense, net, less amortization of deferred financing costs

(34.6)

(34.5)

Cash paid for income taxes

(0.4)

Maintenance capital expenditures

(7.0)

(6.3)

Equity in earnings of investee companies, net of tax

(0.2)

1.9

Non-cash effect of straight-line rent

2.4

1.1

Accretion expense

0.7

0.7

Adjustment related to redeemable and non-redeemable noncontrolling interests

(0.3)

AFFO attributable to OUTFRONT Media Inc.(a)

$           61.0

$           27.1


Exhibit 7:  OPERATING EXPENSES

(Unaudited) See Notes on Page 14

Three Months Ended

March 31,

%

(in millions, except percentages)

2026

2025

Change

Operating expenses:

Billboard property lease

$         111.3

$         109.2

1.9 %

Transit franchise

59.7

58.0

2.9

Posting, maintenance and other

56.5

54.1

4.4

Total operating expenses

$         227.5

$         221.3

2.8


Exhibit 8:  EXPENSES BY SEGMENT

(Unaudited) See Notes on Page 14

Three Months Ended

March 31,

%

(in millions, except percentages)

2026

2025

Change

Billboard:

Billboard property lease

$         111.3

$         109.2

1.9 %

Billboard posting, maintenance and other

37.1

35.7

3.9

Billboard operating expenses

$         148.4

$         144.9

2.4

Billboard SG&A expenses

$           68.1

$           66.8

1.9

Transit:

Transit franchise

$           59.7

$           58.0

2.9

Transit posting, maintenance and other

17.9

16.6

7.8

Transit operating expenses

$           77.6

$           74.6

4.0

Transit SG&A expenses

$           18.8

$           17.3

8.7

NOTES TO EXHIBITS

PRIOR PERIOD PRESENTATION CONFORMS TO CURRENT REPORTING CLASSIFICATIONS.

(a)

Starting at the end of 2025, we modified our calculation of AFFO to include amortization of direct lease acquisition costs instead of the cash paid for direct lease acquisition costs, as management believes that this calculation of AFFO is a more appropriate measure of performance period-over-period and consistent with how we calculate FFO. Accordingly, relevant prior periods have been recast to conform to this presentation.

*     Calculation not meaningful.


View original content to download multimedia:https://www.prnewswire.com/news-releases/outfront-media-reports-first-quarter-2026-results-302766116.html

SOURCE OUTFRONT Media Inc.

Continue Reading

Trending