Connect with us

Technology

Jack Henry & Associates, Inc. Reports First Quarter Fiscal 2025 Results

Published

on


First quarter summary:

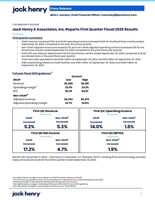
GAAP revenue increased 5.2% and GAAP operating income increased 14.0% for the fiscal three months ended September 30, 2024, compared to the prior fiscal year quarter.Non-GAAP adjusted revenue increased 5.3% and non-GAAP adjusted operating income increased 1.6% for the fiscal three months ended September 30, 2024, compared to the prior fiscal year quarter.1GAAP EPS was $1.63 per diluted share for the fiscal three months ended September 30, 2024, compared to $1.39 per diluted share in the prior fiscal year quarter.Cash and cash equivalents were $43 million at September 30, 2024, and $31 million at September 30, 2023.Debt outstanding related to credit facilities was $140 million at September 30, 2024, and $245 million at September 30, 2023.

Full year fiscal 2025 guidance:2

Current

GAAP

Low

High

Revenue

$2,369

$2,391

Operating margin3

23.0 %

23.2 %

EPS

$5.78

$5.87

Non-GAAP4

Adjusted revenue

$2,353

$2,375

Adjusted operating margin

22.7 %

22.8 %


MONETT, Mo., Nov. 5, 2024 /PRNewswire/ — Jack Henry & Associates, Inc. (Nasdaq: JKHY), a leading financial technology provider, today announced results for fiscal first quarter ended September 30, 2024.

According to Greg Adelson, President and CEO, “We are pleased to report another quarter of solid financial performance, which was slightly better than the outlook provided in August for FY Q1. Our sales team maintained positive momentum in the quarter with a new record sales attainment for Q1 and increased our sales pipeline to an all-time high. We had an outstanding Jack Henry Connect conference last month in Phoenix, where we strengthened relationships with clients and prospects and demonstrated our execution over the past year. We are energized and remain focused on our key differentiators: culture, service, and innovation.”

1 See tables below on page 4 reconciling non-GAAP financial measures to GAAP.
2 The full fiscal year guidance assumes no acquisitions or dispositions are made during fiscal year 2025.
3Operating margin is calculated by dividing operating income by revenue.
4 See tables below on page 7 reconciling fiscal year 2025 GAAP to non-GAAP guidance.
5See table below on page 12 reconciling net income to non-GAAP EBITDA.

Operating Results

Revenue, operating expenses, operating income, and net income for the three months ended September 30, 2024, compared to the three months ended September 30, 2023, were as follows:

Revenue

(Unaudited, In Thousands)

Three Months Ended

September 30,

%
Change

2024

2023

Revenue

Services and Support

$     356,679

$      342,205

4.2 %

Percentage of Total Revenue

59.3 %

59.9 %

Processing

244,303

229,163

6.6 %

Percentage of Total Revenue

40.7 %

40.1 %

REVENUE

$     600,982

$        571,368

5.2 %


Services and support revenue increased for the three months ended September 30, 2024, primarily driven by growth in data processing and hosting revenue of 12.6%, partially offset by a decrease in license and hardware revenue of 35.9%. Processing revenue increased for the three months ended September 30, 2024, primarily driven by growth in card revenue of 5.1% and transaction and digital revenue of 10.9%. Other drivers were increases in payment processing and remote capture and ACH revenues.For the three months ended September 30, 2024, core segment revenue increased 4.9%, payments segment revenue increased 6.3%, complementary segment revenue increased 6.4%, and corporate and other segment revenue decreased 10.2%. For the three months ended September 30, 2024, core segment non-GAAP adjusted revenue increased 5.2%, payments segment non-GAAP adjusted revenue increased 5.9%, complementary segment non-GAAP adjusted revenue increased 7.1%, and corporate and other non-GAAP adjusted segment revenue decreased 10.3% (see revenue lines of segment break-out tables on pages 5 and 6 below for a reconciliation of segment non-GAAP adjusted revenue to GAAP segment revenue).


Operating Expenses and Operating Income

(Unaudited, In Thousands)

Three Months Ended

September 30,

%
Change

2024

2023

Cost of Revenue

$     343,432

$      323,002

6.3 %

Percentage of Total Revenue6

57.1 %

56.5 %

Research and Development

39,686

36,892

7.6 %

Percentage of Total Revenue6

6.6 %

6.5 %

Selling, General, and Administrative

66,588

78,774

(15.5) %

Percentage of Total Revenue6

11.1 %

13.8 %

OPERATING EXPENSES

449,706

438,668

2.5 %

OPERATING INCOME

$       151,276

$        132,700

14.0 %

Operating Margin6

25.2 %

23.2 %


Cost of revenue increased for the three months ended September 30, 2024, primarily due to higher direct costs generally consistent with increases in the related lines of revenue, higher personnel costs including benefits expenses from an increase in employee headcount in the trailing twelve months, higher internal licenses and fees from increased deployments and prices, and a rise in amortization from capital development projects placed into service in the trailing twelve months.Research and development expense increased for the three months ended September 30, 2024, primarily due to higher personnel costs (net of capitalization) including benefits expenses from an increase in employee headcount in the trailing twelve months.Selling, general, and administrative expense decreased for the three months ended September 30, 2024, primarily due to the decrease in non-recurring costs when compared to the prior fiscal year quarter.

Net Income

(Unaudited, In Thousands,

Except Per Share Data)

Three Months Ended

September 30,

%
Change

2024

2023

Income Before Income Taxes

$         156,798

$          133,248

17.7 %

Provision for Income Taxes

37,607

31,569

19.1 %

NET INCOME

$            119,191

$            101,679

17.2 %

Diluted earnings per share

$                 1.63

$                 1.39

17.1 %


Effective tax rates for the three months ended September 30, 2024, and 2023, were 24.0% and 23.7%, respectively.


According to Mimi Carsley, CFO and Treasurer, “For the first quarter of the fiscal year, revenue and operating margins were aligned with our plan and expectations and we continue to expect stronger performance in the second half of our fiscal year. Our private cloud revenue grew over 11% and processing services continued to drive strong revenue growth at over 6%, each contributing to our overall revenue expansion of over 5% and operating income increase of 2% on a non-GAAP basis.”

6Operating margin is calculated by dividing operating income by revenue. Operating margin plus operating expense components as a percentage of total revenue may not equal 100% due to rounding.

Impact of Non-GAAP Adjustments

The tables below show our revenue, operating income, and net income for the three months ended September 30, 2024, compared to the three months ended September 30, 2023, excluding the impacts of deconversions and the VEDIP program expense.*

(Unaudited, In Thousands)

Three Months Ended
September 30,

%
Change

2024

2023

GAAP Revenue**

$       600,982

$          571,368

5.2 %

Adjustments:

Deconversion revenue

(3,697)

(4,136)

NON-GAAP ADJUSTED REVENUE**

$        597,285

$         567,232

5.3 %

GAAP Operating Income

$          151,276

$          132,700

14.0 %

Adjustments:

Operating income from deconversions

(3,495)

(3,755)

VEDIP program expense*

16,443

NON-GAAP ADJUSTED OPERATING INCOME

$          147,781

$         145,388

1.6 %

Non-GAAP Adjusted Operating Margin***

24.7 %

25.6 %

GAAP Net Income

$            119,191

$           101,679

17.2 %

Adjustments:

Net income from deconversions

(3,495)

(3,755)

VEDIP program expense*

16,443

Tax impact of adjustments****

839

(3,045)

NON-GAAP ADJUSTED NET INCOME

$         116,535

$            111,322

4.7 %

*The VEDIP program expense for the fiscal three months ended September 30, 2024, was related to a Company voluntary separation program offered to certain eligible employees beginning in July 2023.

**GAAP revenue is comprised of services and support and processing revenues (see page 2). Reducing services and support revenue by deconversion revenue for the three months ended September 30, 2024, and 2023 which was $3,697 for the current fiscal year quarter and $4,136 for the prior fiscal year quarter, results in non-GAAP adjusted services and support revenue growth of 4.4% quarter over quarter. There were no non-GAAP adjustments to processing revenue for the three months ended September 30, 2024, or 2023.

***Non-GAAP adjusted operating margin is calculated by dividing non-GAAP adjusted operating income by non-GAAP adjusted revenue.

****The tax impact of adjustments is calculated using a tax rate of 24% for the three months ended September 30, 2024, and 2023. The tax rate for non-GAAP adjustment items takes a broad look at our recurring tax adjustments and applies them to non-GAAP revenue that does not have its own specific tax impacts.

The tables below show the segment break-out of revenue and cost of revenue for each period presented, as adjusted for the items above, and include a reconciliation to non-GAAP adjusted operating income presented above.

Three Months Ended September 30, 2024

(Unaudited, In Thousands)

Core

Payments

Complementary

Corporate
and Other

Total

GAAP REVENUE

$ 195,624

$    211,923

$                  171,702

$       21,733

$ 600,982

Non-GAAP adjustments*

(1,287)

(1,914)

(473)

(23)

(3,697)

NON-GAAP ADJUSTED REVENUE

194,337

210,009

171,229

21,710

597,285

GAAP COST OF REVENUE

81,420

113,020

65,967

83,025

343,432

Non-GAAP adjustments*

(37)

(18)

(60)

(115)

NON-GAAP ADJUSTED COST OF REVENUE

81,383

113,002

65,907

83,025

343,317

GAAP SEGMENT INCOME

$   114,204

$   98,903

$                105,735

$    (61,292)

Segment Income Margin**

58.4 %

46.7 %

61.6 %

(282.0) %

NON-GAAP ADJUSTED SEGMENT INCOME

$   112,954

$    97,007

$                105,322

$     (61,315)

Non-GAAP Adjusted Segment Income Margin**

58.1 %

46.2 %

61.5 %

(282.4) %

Research and Development

39,686

Selling, General, and Administrative

66,588

Non-GAAP adjustments unassigned to a segment***

(87)

NON-GAAP TOTAL ADJUSTED OPERATING EXPENSES

449,504

NON-GAAP ADJUSTED OPERATING INCOME

$    147,781

*Revenue non-GAAP adjustments for all segments were deconversion revenue. Cost of revenue non-GAAP adjustments for all segments were deconversion costs.

**Segment income margin is calculated by dividing segment income by revenue for each segment. Non-GAAP adjusted segment income margin is calculated by dividing non-GAAP adjusted segment income by non-GAAP adjusted revenue for each segment.

***Non-GAAP adjustments unassigned to a segment were selling, general, and administrative deconversion costs.


Three Months Ended September 30, 2023

(Unaudited, In Thousands)

Core

Payments

Complementary

Corporate
and Other

Total

GAAP REVENUE

$  186,439

$  199,358

$                 161,366

$     24,205

$    571,368

Non-GAAP adjustments*

(1,665)

(1,006)

(1,451)

(14)

(4,136)

NON-GAAP ADJUSTED REVENUE

184,774

198,352

159,915

24,191

567,232

GAAP COST OF REVENUE

75,927

108,826

60,957

77,292

323,002

Non-GAAP adjustments*

(103)

(47)

(119)

(1)

(270)

NON-GAAP ADJUSTED COST OF REVENUE

75,824

108,779

60,838

77,291

322,732

GAAP SEGMENT INCOME

$     110,512

$    90,532

$               100,409

$   (53,087)

Segment Income Margin

59.3 %

45.4 %

62.2 %

(219.3) %

NON-GAAP ADJUSTED SEGMENT INCOME

$  108,950

$    89,573

$                 99,077

$    (53,100)

Non-GAAP Adjusted Segment Income Margin

59.0 %

45.2 %

62.0 %

(219.5) %

Research and Development

36,892

Selling, General, and Administrative

78,774

Non-GAAP adjustments unassigned to a segment** ***

(16,554)

NON-GAAP TOTAL ADJUSTED OPERATING EXPENSES

421,844

NON-GAAP ADJUSTED OPERATING INCOME

$    145,388

*Revenue non-GAAP adjustments for all segments were deconversion revenues. Cost of revenue non-GAAP adjustments for all segments were deconversion costs.

**Non-GAAP adjustments unassigned to a segment were selling, general, and administrative deconversion costs of $(111) and VEDIP program expense of $(16,443).

***The VEDIP program expense for the fiscal three months ended September 30, 2023, was related to a Company voluntary separation program offered to certain eligible employees beginning in July 2023.

The table below shows our GAAP to non-GAAP guidance for the fiscal year ending June 30, 2025. Fiscal year 2025 non-GAAP guidance excludes the impacts of deconversion revenue and related operating expenses and assumes no acquisitions or dispositions are made during the fiscal year.

GAAP to Non-GAAP GUIDANCE (In Millions, except per share data)

Annual FY25

Low

High

GAAP REVENUE

$  2,369

$   2,391

     Growth

6.9 %

7.9 %

Deconversions*

$         16

$         16

NON-GAAP ADJUSTED REVENUE**

$  2,353

$  2,375

     Non-GAAP Adjusted Growth

7.0 %

8.0 %

GAAP OPERATING EXPENSES

$   1,823

$   1,836

     Growth

5.6 %

6.4 %

Deconversion costs*

$          3

$          3

NON-GAAP ADJUSTED OPERATING EXPENSES**

$   1,820

$   1,833

     Non-GAAP Adjusted Growth

6.7 %

7.4 %

GAAP OPERATING INCOME

$     546

$     555

     Growth

11.6 %

13.3 %

GAAP OPERATING MARGIN

23.0 %

23.2 %

NON-GAAP ADJUSTED OPERATING INCOME**

$     533

$     542

     Non-GAAP Adjusted Growth

8.2 %

9.9 %

NON-GAAP ADJUSTED OPERATING MARGIN

22.7 %

22.8 %

GAAP EPS***

$     5.78

$     5.87

     Growth

10.6 %

12.3 %

Non-GAAP EPS***

$    5.65

$    5.74

Growth

7.3 %

9.0 %

*Deconversion revenue and related operating expenses are based on actual results for the three months ended September 30, 2024, and estimates for the remainder of fiscal year 2025, based on the lowest actual recent historical results. See the Company’s Form 8-K filed with the Securities and Exchange Commission on October 28, 2024.

**GAAP to Non-GAAP revenue, operating expenses, and operating income may not foot due to rounding.

***The GAAP to Non-GAAP EPS reconciliation table is below on page 13.

Balance Sheet and Cash Flow Review


Cash and cash equivalents were $43 million at September 30, 2024, and $31 million at September 30, 2023.Trade receivables were $307 million at September 30, 2024, compared to $289 million at September 30, 2023.The Company had $140 million of borrowings at September 30, 2024 compared to $245 million of borrowings at September 30, 2023.Deferred revenue decreased to $320 million at September 30, 2024, compared to $333 million at September 30, 2023.Stockholders’ equity increased to $1,925 million at September 30, 2024, compared to $1,660 million at September 30, 2023.


*See table below for Net Cash Provided by Operating Activities and on page 12 for Return on Average Shareholders’ Equity. Tables reconciling the non-GAAP measures Free Cash Flow and Return on Invested Capital (ROIC) to GAAP measures are also on page 12. See the Use of Non-GAAP Financial Information section below for the definitions of Free Cash Flow and ROIC.

The following table summarizes net cash from operating activities:

(Unaudited, In Thousands)

Three Months Ended September 30,

2024

2023

Net income

$                          119,191

$                         101,679

Depreciation

11,273

12,052

Amortization

39,221

37,183

Change in deferred income taxes

(4,087)

(10,178)

Other non-cash expenses

6,678

7,037

Change in receivables

26,373

72,519

Change in deferred revenue

(69,358)

(66,322)

Change in other assets and liabilities*

(12,395)

3,169

NET CASH FROM OPERATING ACTIVITIES

$                       116,896

$                         157,139

*For the year ended September 30, 2024, includes the change in income taxes of $38,576, the change in accrued expenses of $(23,067), and the change in prepaid expenses, prepaid cost of product and other of $(18,788). For the year ended September 30, 2023, includes the change in income taxes of $39,044, the change in prepaid expenses, prepaid cost of product and other of $(17,356), and the change in accrued expenses of $(17,285).

The following table summarizes net cash from investing activities:

(Unaudited, In Thousands)

Three Months Ended September 30,

2024

2023

Capital expenditures

(12,801)

(7,612)

Proceeds from dispositions

852

Purchased software

(2,676)

(2,280)

Computer software developed

(42,259)

(41,486)

Purchase of investments

(2,000)

Proceeds from investments

1,000

NET CASH FROM INVESTING ACTIVITIES

$                      (58,736)

$                       (50,526)

The following table summarizes net cash from financing activities:

(Unaudited, In Thousands)

Three Months Ended September 30,

2024

2023

Borrowings on credit facilities

$                      75,000

$                     135,000

Repayments on credit facilities and financing leases

(85,000)

(165,000)

Purchase of treasury stock

(20,000)

Dividends paid

(40,104)

(37,863)

Net cash from issuance of stock and tax related to stock-based compensation

(3,128)

474

NET CASH FROM FINANCING ACTIVITIES

$                    (53,232)

$                     (87,389)

Use of Non-GAAP Financial Information

Generally Accepted Accounting Principles (GAAP) is the term used to refer to the standard framework of guidelines for financial accounting in the United States. GAAP includes the standards, conventions, and rules accountants follow in recording and summarizing transactions in the preparation of financial statements. In addition to reporting financial results in accordance with GAAP, we have provided certain non-GAAP financial measures, including adjusted revenue, adjusted operating income, adjusted segment income, adjusted cost of revenue, adjusted operating expenses, adjusted operating margin, adjusted segment income margin, non-GAAP earnings before interest, taxes, depreciation, and amortization (non-GAAP EBITDA), free cash flow, return on invested capital (ROIC), non-GAAP adjusted net income, and non-GAAP earnings per share (EPS).

We believe non-GAAP financial measures help investors better understand the underlying fundamentals and true operations of our business. Adjusted revenue, adjusted operating income, adjusted operating margin, adjusted  segment income, adjusted segment income margin, adjusted cost of revenue, adjusted operating expenses, adjusted net income, and non-GAAP EPS eliminate one-time deconversion revenue and associated costs and the effects of the VEDIP program expense, which management believes are not indicative of the Company’s operating performance. Such adjustments give investors further insight into our performance. Non-GAAP EBITDA is defined as net income attributable to the Company before the effect of interest expense, taxes, depreciation, and amortization, adjusted for net income before the effect of interest expense, taxes, depreciation, and amortization attributable to eliminated one-time deconversions and the VEDIP program expense. Free cash flow is defined as net cash from operating activities, less capitalized expenditures, internal use software, and capitalized software, plus proceeds from the sale of assets. ROIC is defined as net income divided by average invested capital, which is the average of beginning and ending long-term debt and stockholders’ equity for a given period. Management believes that non-GAAP EBITDA is an important measure of the Company’s overall operating performance and excludes certain costs and other transactions that management deems one time or non-operational in nature; free cash flow is useful to measure the funds generated in a given period that are available for debt service requirements and strategic capital decisions; and ROIC is a measure of the Company’s allocation efficiency and effectiveness of its invested capital. For these reasons, management also uses these non-GAAP financial measures in its assessment and management of the Company’s performance.

Non-GAAP financial measures used by the Company may not be comparable to similarly titled non-GAAP measures used by other companies. Non-GAAP financial measures have no standardized meaning prescribed by GAAP and therefore, are unlikely to be comparable with calculations of similar measures for other companies.

Any non-GAAP financial measures should be considered in context with the GAAP financial presentation and should not be considered in isolation or as a substitute for GAAP measures. Reconciliations of the non-GAAP financial measures to related GAAP measures are included.

Quarterly Conference Call

The Company will hold a conference call on November 6, 2024, at 7:45 a.m. Central Time, and investors are invited to listen at www.jackhenry.com. A webcast replay will be available approximately one hour after the event at ir.jackhenry.com/corporate-events-and-presentations and will remain available for one year.

About Jack Henry & Associates, Inc.®
    
Jack Henry™ (Nasdaq: JKHY) is a well-rounded financial technology company that strengthens connections between financial institutions and the people and businesses they serve. We are an S&P 500 company that prioritizes openness, collaboration, and user centricity — offering banks and credit unions a vibrant ecosystem of internally developed modern capabilities as well as the ability to integrate with leading fintechs. For more than 48 years, Jack Henry has provided technology solutions to enable clients to innovate faster, strategically differentiate, and successfully compete while serving the evolving needs of their accountholders. We empower approximately 7,500 clients with people-inspired innovation, personal service, and insight-driven solutions that help reduce the barriers to financial health. Additional information is available at www.jackhenry.com.

Statements made in this news release that are not historical facts are “forward-looking statements” within the meaning of the Private Securities Litigation Reform Act of 1995, Section 27A of the Securities Act of 1933 and Section 21E of the Securities Exchange Act of 1934. Because forward-looking statements relate to the future, they are subject to inherent risks and uncertainties that could cause actual results to differ materially from those expressed or implied by such statements. Such risks and uncertainties include, but are not limited to, those discussed in the Company’s Securities and Exchange Commission filings, including the Company’s most recent reports on Form 10-K and Form 10-Q, particularly under the heading Risk Factors. Any forward-looking statement made in this news release speaks only as of the date of the news release, and the Company expressly disclaims any obligation to publicly update or revise any forward-looking statement, whether because of new information, future events or otherwise.


Condensed Consolidated Statements of Income (Unaudited)

(In Thousands, except per share data)

Three Months Ended
September 30,

%
Change

2024

2023

REVENUE

$         600,982

$            571,368

5.2 %

Cost of Revenue

343,432

323,002

6.3 %

Research and Development

39,686

36,892

7.6 %

Selling, General, and Administrative

66,588

78,774

(15.5) %

EXPENSES

449,706

438,668

2.5 %

OPERATING INCOME

151,276

132,700

14.0 %

Interest income

8,347

4,745

75.9 %

Interest expense

(2,825)

(4,197)

(32.7) %

Interest Income (Expense), net

5,522

548

907.7 %

INCOME BEFORE INCOME TAXES

156,798

133,248

17.7 %

Provision for Income Taxes

37,607

31,569

19.1 %

NET INCOME

$             119,191

$             101,679

17.2 %

Diluted net income per share

$                 1.63

$                   1.39

Diluted weighted average shares outstanding

73,078

73,014

Consolidated Balance Sheet Highlights (Unaudited)

(In Thousands)

September 30,

%
Change

2024

2023

Cash and cash equivalents

$             43,212

$              31,467

37.3 %

Receivables

306,660

288,733

6.2 %

Total assets

2,928,511

2,734,223

7.1 %

Accounts payable and accrued expenses

$            231,713

$          208,909

10.9 %

Current and long-term debt

140,000

245,000

(42.9) %

Deferred revenue

319,574

333,407

(4.1) %

Stockholders’ equity

1,925,028

1,659,948

16.0 %


Calculation of Non-GAAP Earnings Before Income Taxes, Depreciation and Amortization (Non-GAAP EBITDA)

Three Months Ended
September 30,

%
Change

(in thousands)

2024

2023

Net income

$             119,191

$             101,679

Net interest

(5,522)

(548)

Taxes

37,607

31,569

Depreciation and amortization

50,494

49,235

Less: Net income before interest expense, taxes, depreciation and

amortization attributable to eliminated one-time adjustments*

(3,495)

12,688

NON-GAAP EBITDA

$          198,275

$           194,623

1.9 %

*The fiscal first quarter 2025 adjustments for net income before interest expense, taxes, depreciation and amortization were for deconversions. The fiscal first quarter 2024 adjustments were for deconversions and the VEDIP program expense and were $(3,755) and $16,443, respectively.


Calculation of Free Cash Flow (Non-GAAP)

Three Months Ended
September 30,

(in thousands)

2024

2023

Net cash from operating activities

$           116,896

$             157,139

Capitalized expenditures

(12,801)

(7,612)

Internal use software

(2,676)

(2,280)

Proceeds from sale of assets

852

Capitalized software

(42,259)

(41,486)

FREE CASH FLOW

$            59,160

$           106,613

Calculation of the Return on Average Shareholders’ Equity

September 30,

(in thousands)

2024

2023

Net income (trailing four quarters)

$         399,328

$            361,776

Average stockholder’s equity (period beginning and ending balances)

1,792,488

1,560,543

RETURN ON AVERAGE SHAREHOLDERS’ EQUITY

22.3 %

23.2 %

Calculation of Return on Invested Capital (ROIC) (Non-GAAP)

September 30,

(in thousands)

2024

2023

Net income (trailing four quarters)

$         399,328

$            361,776

Average stockholder’s equity (period beginning and ending balances)

1,792,488

1,560,543

Average current maturities of long-term debt and financing leases

(period beginning and ending balances)

45,000

21

Average long-term debt (period beginning and ending balances)

147,500

245,000

Average invested capital

$      1,984,988

$        1,805,564

ROIC

20.1 %

20.0 %


GAAP to Non-GAAP EPS Reconciliation Table

FY25 Guidance

GAAP EPS

$5.78-$5.87

Excluded Activity, net of Tax:

Deconversion*

$0.13

Non-GAAP EPS

$5.65-$5.74

*We are not aware of any other discreet adjustments at this time. Deconversion revenue and related operating expenses are based on actual results for fiscal first quarter 2025 and estimates for the remainder of fiscal year 2025, based on the lowest actual recent historical results. See the Company’s Form 8-K filed with the Securities and Exchange Commission on October 28, 2024.


View original content to download multimedia:https://www.prnewswire.com/news-releases/jack-henry–associates-inc-reports-first-quarter-fiscal-2025-results-302296898.html

SOURCE Jack Henry & Associates, Inc.

Continue Reading
Click to comment

Leave a Reply

Your email address will not be published. Required fields are marked *

Technology

BTQ Technologies’ QSSN Selected as Core Security Infrastructure for South Korea’s First Bank-Led KRW Stablecoin Proof-of-Concept

Published

on

By

BTQ provides strategic advisory support and QSSN as core PQC security infrastructure for the iM Bank initiative on the Kaia mainnet, advancing post-quantum migration across global financial infrastructure

BTQ has been selected as the core post-quantum cryptography security technology provider for South Korea’s first bank-led KRW stablecoin proof-of-concept, delivering its Quantum Secure Stablecoin Settlement Network (“QSSN”) for the initiative.
 BTQ is providing strategic advisory support and helping coordinate implementation across the partnership with iM Bank and Finger, supporting the integration of post-quantum protections into regulated digital money infrastructure.
 Built on the Kaia mainnet, the proof-of-concept is connected to the blockchain ecosystems originally developed by Kakao and LINE, linking the initiative to two of the largest messaging and digital platform ecosystems in Korea and Japan.

VANCOUVER, BC, May 6, 2026 /PRNewswire/ – BTQ Technologies Corp. (“BTQ” or the “Company”) (Nasdaq: BTQ) (CBOE CA: BTQ), a global quantum technology company focused on securing mission-critical networks, today announced that it it has been selected as the core PQC security technology provider through its Quantum Secure Stablecoin Settlement Network (“QSSN”) in a proof-of-concept with its Korean strategic partner, Finger Inc. (“Finger”), and iM Bank, a leading Korean commercial bank, for South Korea’s first bank-led Korean won stablecoin infrastructure incorporating post-quantum cryptography (“PQC”).

The proof-of-concept represents more than a technical pilot. It marks an important step in bringing next-generation quantum security into banking infrastructure within Korea’s regulated financial system. In addition to providing QSSN as the core PQC security framework, BTQ is contributing consulting and strategic coordination across the three-way partnership, helping align the project’s security architecture, implementation approach, and long-term post-quantum migration objectives.

“Post-quantum migration requires more than a cryptographic upgrade. It requires coordination across infrastructure, implementation, and institutional stakeholders,” said Olivier Roussy Newton, Chief Executive Officer of BTQ Technologies. “In this initiative, BTQ is providing both strategic advisory support and QSSN as the post-quantum security architecture, while helping lead coordination across the three-way partnership. We believe this proof-of-concept demonstrates how financial institutions can begin integrating quantum-resilient protections into digital money systems in a practical and operationally viable way.”

South Korea’s First Bank-Led PQC Stablecoin Infrastructure Initiative

BTQ is working alongside iM Bank and Finger on a three-way initiative to validate the issuance and distribution infrastructure for a Korean won stablecoin. In addition to supplying QSSN as the PQC security layer, BTQ is providing consulting support and helping to guide coordination across the partnership as the parties evaluate how to integrate post-quantum protections into bank-led digital asset infrastructure.

The proof-of-concept will validate several key components, including real-time reconciliation between bank reserves and blockchain-issued supply, a global-standard smart contract architecture, connectivity to global infrastructure for overseas distribution, and the integration of a PQC-based dual-signature security structure. By applying BTQ’s PQC signature architecture alongside the existing ECDSA cryptographic framework, the system is designed to preserve operational continuity for financial institutions while proactively addressing future quantum computing threats.

Built on Kaia Mainnet

A notable feature of the proof-of-concept is that it will be implemented on the Kaia mainnet, one of Korea’s leading Layer 1 blockchain networks. Kaia was created through the merger of Klaytn, the blockchain originally developed by Kakao, and Finschia, the blockchain associated with LINE. Kakao and LINE sit at the center of two of the largest messaging and digital platform ecosystems in Korea and Japan, respectively, making Kaia a significant piece of regional digital infrastructure.

Klaytn previously participated in the Bank of Korea’s CBDC pilot ecosystem, and the Bank of Korea has continued to advance CBDC testing through initiatives such as Project Hangang.

By combining BTQ’s PQC technology with blockchain infrastructure tied to the Kakao and LINE ecosystems, the proof-of-concept is intended to establish a model that aligns institutional-grade security, blockchain scalability, and evolving regulatory requirements for digital money infrastructure.

QSSN as the Security Layer

The PQC security foundation for the initiative is BTQ’s Quantum Secure Stablecoin Settlement Network, or QSSN, a quantum-secure network architecture designed for stablecoin, tokenized deposit, payment, and digital asset infrastructure. QSSN is designed to protect critical issuer functions, including stablecoin issuance, burning, transfer authority, upgrade control, and administrative permissions, by integrating PQC-based signatures while maintaining existing user experience and operational workflows.

BTQ has previously announced that QSSN was highlighted in the U.S. Post-Quantum Financial Infrastructure Framework (“PQFIF”) as a model architecture for post-quantum digital money infrastructure. The Company has also positioned QSSN as a standards-oriented initiative advanced through QuINSA and aligned with emerging post-quantum financial infrastructure requirements.

Addressing the Harvest-Now, Decrypt-Later Risk

The timing of the proof-of-concept reflects the growing urgency surrounding the “Harvest-Now, Decrypt-Later” risk, in which attackers may collect encrypted financial data today and decrypt it later once sufficiently advanced quantum capabilities emerge. Global institutions are already accelerating post-quantum migration. The U.S. National Institute of Standards and Technology (“NIST”) has finalized its first set of post-quantum cryptography standards, including ML-DSA, ML-KEM, and SLH-DSA, while major technology companies and financial institutions continue to define their own post-quantum transition timelines.

BTQ’s QSSN addresses this challenge through a dual-signature design that allows existing ECDSA-based infrastructure to operate in parallel with NIST-aligned PQC signatures such as ML-DSA. This approach enables banks and payment infrastructure providers to begin a phased transition toward quantum-safe security without disrupting existing systems.

Expanding BTQ’s Korean Ecosystem

BTQ continues to expand its Korean ecosystem across digital assets, payments, banking infrastructure, and hardware-based security. In October 2025, BTQ announced that Finger had joined Danal as an early participant in BTQ’s QSSN pilot program, with the initiative expected to progress from proof-of-concept toward commercialization under QuINSA-aligned guidelines and broader industry frameworks such as PQFIF.

The commencement of the iM Bank proof-of-concept represents an important commercial signal for BTQ, indicating that demand for post-quantum migration among Korean financial institutions is beginning to move from policy discussion toward infrastructure-level implementation. As Korea advances both quantum technology policy and stablecoin-related regulatory discussions, BTQ believes QSSN is well positioned at the intersection of regulated finance, digital asset infrastructure, and post-quantum security.

About iM Bank
iM Bank is a South Korean commercial bank and a subsidiary of DGB Financial Group. Headquartered in Daegu, iM Bank presents itself as a financial companion for customers and traces its roots to Daegu Bank, which was established in 1967 as Korea’s first regional bank. For more information, please visit https://www.imbank.co.kr/

About Finger Inc. Group
Finger supplies and develops financial IT solutions to provide optimized money management strategies for employees and corporate customers. Providing “Smartphone Financial Services”, “Corporate Cash Management Services” for businesses, “Private Wealth Management Services” for private consumers.

Since the year 2000, Finger has accumulated a number of awards and patents regarding its businesses. Based on its Mobile Enterprise Application Platform(MEAP) Orchestra and its funds management system using screen-scrapping technologies, Finger was the first company in Korea to deliver a smartphone banking banking-service. For more information, please visit http://www.finger.co.kr/

About BTQ
BTQ Technologies Corp. (Nasdaq: BTQ | Cboe CA: BTQ) is a quantum technology company focused on accelerating the transition from classical networks to the quantum internet. Backed by a broad patent portfolio and deep technical expertise, BTQ is advancing a full-stack, neutral-atom quantum computing platform spanning hardware, middleware, and post-quantum security solutions for finance, telecommunications, logistics, life sciences, and defense.

Connect with BTQ: Website | LinkedIn | X/Twitter

ON BEHALF OF THE BOARD OF DIRECTORS
Olivier Roussy Newton
CEO, Chairman
Neither Cboe Canada nor its Regulation Services Provider accepts responsibility for the adequacy or accuracy of this release.

Forward Looking Information

Certain statements herein contain forward-looking statements and forward-looking information within the meaning of applicable securities laws. Such forward-looking statements or information include but are not limited to statements or information with respect to the business plans of the Company, including with respect to its research partnerships, and anticipated markets in which the Company may be listing its common shares. Forward-looking statements or information often can be identified by the use of words such as “anticipate”, “intend”, “expect”, “plan” or “may” and the variations of these words are intended to identify forward-looking statements and information.

The Company has made numerous assumptions including among other things, assumptions about general business and economic conditions, the development of post-quantum algorithms and quantum vulnerabilities, and the quantum computing industry generally. The foregoing list of assumptions is not exhaustive.

Although management of the Company believes that the assumptions made and the expectations represented by such statements or information are reasonable, there can be no assurance that forward-looking statements or information herein will prove to be accurate. Forward-looking statements and information are based on assumptions and involve known and unknown risks which may cause actual results to be materially different from any future results, expressed or implied, by such forward-looking statements or information. These factors include risks relating to: the availability of financing for the Company; business and economic conditions in the post-quantum and encryption computing industries generally; the speculative nature of the Company’s research and development programs; the supply and demand for labour and technological post-quantum and encryption technology; unanticipated events related to regulatory and licensing matters and environmental matters; changes in general economic conditions or conditions in the financial markets; changes in laws (including regulations respecting blockchains); risks related to the direct and indirect impact of COVID-19 including, but not limited to, its impact on general economic conditions, the ability to obtain financing as required, and causing potential delays to research and development activities; and other risk factors as detailed from time to time. The Company does not undertake to update any forward-looking information, except in accordance with applicable securities laws.

View original content to download multimedia:https://www.prnewswire.com/news-releases/btq-technologies-qssn-selected-as-core-security-infrastructure-for-south-koreas-first-bank-led-krw-stablecoin-proof-of-concept-302763840.html

SOURCE BTQ Technologies Corp.

Continue Reading

Technology

Zimmer Biomet to Present at the BofA Securities 2026 Health Care Conference

Published

on

By

WARSAW, Ind., May 6, 2026 /PRNewswire/ — Zimmer Biomet Holdings, Inc. (NYSE and SIX: ZBH), a global medical technology leader, today announced that members of the Zimmer Biomet management team will participate in the Bank of America Securities Health Care Conference on Wednesday, May 13, 2026, with a fireside chat at 8:40 a.m. PT (11:40 a.m. ET).

A live audio webcast can be accessed via Zimmer Biomet’s Investor Relations website at https://investor.zimmerbiomet.com. It will be available for replay following the fireside chat.

About Zimmer Biomet 
Zimmer Biomet is a global medical technology leader with a comprehensive portfolio designed to maximize mobility and improve health. We seamlessly transform the patient experience through our innovative products and suite of integrated digital and robotic technologies that leverage data, data analytics and artificial intelligence.

With 90+ years of trusted leadership and proven expertise, Zimmer Biomet is positioned to deliver the highest quality solutions to patients and providers. Our legacy continues to come to life today through our progressive culture of evolution and innovation. 

For more information about our product portfolio, our operations in 25+ countries and sales in 100+ countries or about joining our team, visit www.zimmerbiomet.com or follow on LinkedIn at www.linkedin.com/company/zimmerbiomet or X at www.x.com/zimmerbiomet.

Contacts:


Media

Investors

Troy Kirkpatrick

David DeMartino

614-284-1926

646-531-6115

troy.kirkpatrick@zimmerbiomet.com

david.demartino@zimmerbiomet.com

Kirsten Fallon

Zach Weiner

781-779-5561

908-591-6955

kirsten.fallon@zimmerbiomet.com

zach.weiner@zimmerbiomet.com

View original content to download multimedia:https://www.prnewswire.com/news-releases/zimmer-biomet-to-present-at-the-bofa-securities-2026-health-care-conference-302763299.html

SOURCE Zimmer Biomet Holdings, Inc.

Continue Reading

Technology

NextLadder Ventures Announces Co-Founder Leadership Team, Investment Focus Areas For Over $1 Billion Initiative Empowering Americans with Personalized, Tech-Enabled Support Tools

Published

on

By

New senior hires from Google and The Collaborative Fund to lead product strategy and venture investing

Fund unveils first investment focus areas to catalyze new ‘Navigation Technology’ market, equipping Americans with cutting-edge tools to achieve economic security, opportunity and empowerment

ST. LOUIS, May 6, 2026 /PRNewswire/ — NextLadder Ventures, a new fund backed by more than $1 billion in capital, today announced its priority investment areas for building a new market for “Navigation Technology” (NavTech) — tools that provide Americans with personalized solutions to navigate life’s challenges and achieve greater economic mobility — and announced its co-founding team, including two new senior hires.

The fund’s active focus areas are based on extensive research identifying the key experiences and high-stakes decision points that have an outsized impact on American families’ economic mobility. Launched investment areas include financial health, career navigation, and benefits and social services access, with further exploration underway around housing, legal aid, justice and re-entry, and mental and physical health. 

The organization is also today welcoming two senior leaders: Lauren Loktev is joining NextLadder as Managing Director of Investments and Brigitte Hoyer Gosselink as Managing Director of Product. Loktev was most recently a partner at the Collaborative Fund, where she backed several breakout companies in early child development, education, and sustainability. Gosselink comes to NextLadder from Google, where she led the company’s AI and social impact portfolio. They join a growing team which has deep expertise at the intersection of economic mobility, technology, public policy, and philanthropy.

NextLadder’s Focus Areas for Investment

Today, the fund is kicking off a plan to deploy $1 billion over the next seven years to accelerate the design, development, and deployment of accessible NavTech tools that aim to help families more successfully navigate the major life experiences that determine whether they get ahead or fall behind. As NextLadder’s inaugural frontier AI lab partner, Anthropic is supporting the build-out of the organization’s AI-native capabilities and is offering technical assistance to NextLadder’s portfolio organizations. 

As an increasing proportion of Americans across income levels find themselves overextended and overwhelmed, NavTech tools are designed to help individuals and families understand their options, connect to information and resources, and take action to recover from a setback or take advantage of an opportunity and reclaim their economic futures.

“Life is getting harder, and too many Americans are stuck facing some of the most complex and consequential moments of their lives without much support,” said Ryan Rippel, CEO of NextLadder Ventures. “Every day, millions in this country face fork-in-the-road decisions that have major implications on whether they climb up the economic ladder or fall farther behind. AI has understandably intensified many Americans’ anxieties about their jobs and their security in the economy. But these technologies are now also making it possible to deliver highly personalized, affordable tools to meet the needs of tens of millions of Americans in a way that has never been practically achievable or financially viable before. With NavTech tools, built for the reality of families’ everyday experiences, we can empower Americans to overcome setbacks, navigate life’s toughest financial decisions, and build more secure futures.”

NavTech tools, built with the needs of individuals, families, and trusted community partners at the center of their design, have the potential to ease burdens most acutely faced by 90 million Americans who live in households that have difficulty in paying for usual home expenses, and turbocharge the capacity of the 1.6 million community workers in non-profit or local, state, and federal government roles who serve them. This growing category of digital technologies includes tools that help families access opportunities such as personalized financial advice and legal aid, get connected with available resources and programs, and manage unexpected hurdles like losing a job or facing an eviction – while freeing social workers and service providers to spend more time on people and less time on red tape and paperwork.

The fund’s active investment areas include:

Financial Health: Developing highly personalized, AI-powered financial health tools that can provide tailored, sustained counsel to help users build savings and protect and recover from financial shocks;
Career Navigation: Building tools to support career navigation, manage and support career transitions, and help workers, case managers, and employers identify pathways to living wage work — all designed to help people successfully find the right jobs for them.
Benefits & Social Services Access: Helping eligible Americans seamlessly identify and enroll in all the benefits and social services available to them, particularly those that support career navigation and transitions, help them navigate critical life moments, and achieve stability toward economic opportunity.

NextLadder is exploring additional focus areas, including housing, legal aid, justice and re-entry, caregiving, and mental and physical health. More on the organization’s vision of these focus areas is available HERE.

In addition to backing direct NavTech solutions, NextLadder is investing in the developers, partners, and standards required to build a durable, self-sustaining market. Across all focus areas, the fund is prioritizing efforts to ensure NavTech tools are reliable, protect users’ privacy, and are trusted by the families who depend on them.

NextLadder’s Co-Founder Leadership Team

NextLadder’s five co-founders will be CEO Ryan Rippel, Chief Strategy and Operations Officer Rhett Dornbach-Bender, Chief of Staff Callie Schwartz, and the two new senior hires: Managing Director of Investments Lauren Loktev and Managing Director of Product Brigitte Hoyer Gosselink, rounding out the fund’s expertise in investing, technology, and impact.

“We’re thrilled to welcome Lauren and Brigitte to the NextLadder team,” said Rippel. “Brigitte has spent her career proving that when applied purposefully, AI and technology can deliver meaningful benefits for communities, and she’ll set the bar for what NavTech tools can deliver for American families today and in the years to come. And with her deep experience backing mission-driven founders, Lauren is the perfect leader to build our venture practice from the ground up and accelerate the growth of the NavTech field. With this team in place, we’re positioned to make NavTech tools easier to build, fund, and access so they reach the people who need them most.”

Loktev brings 15 years of venture capital experience investing at the intersection of for-profit and for-good. Most recently at Collaborative Fund, she backed several companies to significant scale and launched Collab+Sesame, a first-of-its-kind thematic seed fund in partnership with Sesame Workshop focused on early childhood education. At NextLadder, she will build and lead the fund’s venture practice, sourcing and scaling investments in the founders building the next generation of NavTech tools.

“We have a once in a generation opportunity to help steer AI solutions toward those who need them most,” said Loktev. “Many amazing, accomplished founders see this too, and they are on a mission to build scalable, transformative businesses in the critical verticals that help people navigate life-changing moments. I couldn’t be more excited to join NextLadder and to support the most inspiring leaders building this market from the ground up. Thanks to our unique, long-term mandate, we can be creative and flexible in investing across stage and check size to partner with the entrepreneurs and leaders we believe will change the world.”

Prior to her role at NextLadder, Gosselink spent over a decade at Google in several roles including Director of AI and Social Impact, directing more than $500 million in funding for organizations applying AI to address challenges including crisis response, education, and economic opportunity. At NextLadder, she will lead AI and product strategy across the fund’s portfolio, backing solutions and setting market-wide standards for how NavTech tools are designed, evaluated, and improved over time.

“If we collectively harness the AI transformation strategically and purposefully, we can transform the way Americans are empowered to access greater economic mobility,” said Gosselink. “We believe that people-centered products, combined with shifts in the market and the services available to families, can fundamentally reshape how millions of Americans navigate critical moments and achieve prosperity on their own terms.”

To request interviews from the NextLadder Ventures leadership team, contact media@nextladder.com.

About NextLadder Ventures

NextLadder Ventures is a time-bound venture with one goal: empower millions of Americans to reach their potential by 2040. Backed by over $1 billion in capital, the organization invests in breakthrough technologies that remove barriers to economic success and put people in control of their futures. NextLadder Ventures is trailblazing a new market for tech-enabled Navigation Technology tools that help people access the resources they need to navigate pivotal moments — offering flexible, risk-tolerant capital to entrepreneurs building these transformative tools today, while creating a pipeline of tech, talent, and capital for the long run.

View original content:https://www.prnewswire.com/news-releases/nextladder-ventures-announces-co-founder-leadership-team-investment-focus-areas-for-over-1-billion-initiative-empowering-americans-with-personalized-tech-enabled-support-tools-302764095.html

SOURCE NextLadder Ventures

Continue Reading

Trending