
Technology
outboundIQ Unveils Game-Changing Business Insights Tool to Revolutionize Contact Center Decision-Making

Published
2 years agoon
By

Unlock Your Secrets to Success with Pulse, powered by outboundIQ
LAUDERDALE LAKES, Fla., Nov. 18, 2024 /PRNewswire/ — www.outboundiq.com, today announced the release of Pulse; business insights at your fingertips. This innovative addition to our technology suite transforms our customers’ ability to track critical outcomes, informing business decisions while driving performance and process improvement.
“Pulse provides a 360 degree view of the most valuable information and insights for the contact center world. Pulse eliminates the need to run dozens of reports from multiple systems, perform intricate steps to marry the data, and hire a forensic data analyst to interpret the data output. What you get is clean, easily interpreted insights that allow you to measure your data, agent and system performances through a single pane of glass. Best of all, it’s customizable, enabling you to measure all of these things using the KPIs that matter to YOU most! And, all of this is provided at a fraction of the cost of BI platforms and other comparable tools.”
– Jessica Clay, VP Support and Services
Benefits of Pulse:
Turnkey, same day integration with all major contact center technologiesSimple and user-friendly portalInstantly incorporate inbound and outbound omnichannel interactions and outcomes in one user interface, across any desired time frameInsights into performance based on customizable attributes and personalized data points that matter to your business. Examples include lead source, market, region, division, product line, agent, time of day, day of week, and so much moreHigh-value feature for individuals who need to keep tabs on things remotelyLong-term data storage and retrieval in the app, or externally via REST API
Contact center operators, business analysts, and sales, marketing, revenue ops, and customer experience leaders alike can expect immediate benefits in their operational efficiency and overall performance, staying ahead of the competition and driving growth.
“Pulse has been a game-changer for managing our call center’s performance. The ability to break down major KPIs by campaign and agent, with all the filtering options I could need, has completely transformed how we track and optimize our outreach. It gives me a real-time pulse on every facet of our operations, enabling us to make quick, informed decisions that drive our contact rate and overall success. I can’t imagine managing our campaigns without this tool—it’s simply invaluable!”
– Kelly Shapley, GM of Purple Financial
Pulse is everything you’ve always wanted in real time reporting, turn key, and is available NOW. For more information about how it can benefit your operation, visit outboundiq.com or contact our Vice President of Sales, Sandy Tafur:
Phone: 404-660-5314 | Email: sandy@outboundiq.com
About outboundIQ:
outboundIQ is a contact center performance optimization company specializing in intelligent, automated solutions. Our innovative technologies, including outboundANI and Pulse, leverage machine learning and business intelligence to deliver detailed analytics and actionable insights, helping contact centers boost performance and reach their goals, while placing consumer experience at the forefront. Paired with our comprehensive consulting services, from engagement strategy to CCaaS optimizations and implementations – outboundIQ offers solutions to address every unique challenge in modern customer outreach.
View original content to download multimedia:https://www.prnewswire.com/news-releases/outboundiq-unveils-game-changing-business-insights-tool-to-revolutionize-contact-center-decision-making-302308898.html
SOURCE outboundIQ

You may like
Technology
Tucows Reports Third Quarter Results In Line with Expectations with Progress on Balance Sheet Obligations
Published
3 seconds agoon
November 5, 2026By

TORONTO, Nov. 5, 2026 /PRNewswire/ — Tucows Inc. (NASDAQ: TCX) (TSX: TC), a global internet services leader, today reported its unaudited financial results for the third quarter ended September 30, 2026. All figures are in U.S. dollars.
“Adjusted EBITDA and gross profit grew year over year, and we remain on track for our 2026 guidance,” said David Woroch, President and Chief Executive Officer of Tucows. “We also retired the Ting preferred units valued at $149.3 million, and repaid $6 million on our syndicated loan facility. After quarter end, we agreed to assign Ting’s Colorado Springs lease, which is expected to release Tucows’ parent guaranty in the spring. Each of these steps makes the business simpler and more flexible than it was a quarter ago.”
Financial Results
Consolidated net revenue increased 1.4% year over year to $100.0 million in the third quarter of 2026, driven by revenue growth at Ting.
Gross profit for the third quarter of 2026 increased 20.5% to $29.1 million from the third quarter of 2025, and improved 13% sequentially. Both the year-over-year and sequential expansion was driven primarily by a large, non-recurring re-rate from the renegotiation of our mobile contract within the Corporate segment, as well as year-over-year growth from Ting.
Net Loss for the third quarter was $10.3 million (EPS of $(0.92), compared with a net loss of $23.0 million (EPS of $(2.08)), in Q3 2025. Adjusted net loss¹ was $5.8 million (adjusted EPS¹ of $(0.52)) in Q3 2026 versus an Adjusted net loss¹ of $15.8 million (adjusted EPS¹ of $(1.42)) in Q3 2025.
Adjusted EBITDA¹ for the third quarter of 2026 rose 39.8% to $18.6 million from the third quarter of 2025, and improved 51% sequentially. The Ting segment had strong Adjusted EBITDA performance both year over year and sequentially, but the main driver was the impact in our Corporate segment from our mobile contract re-rate.
We ended the third quarter of 2026 with cash and cash equivalents, and restricted cash and restricted cash equivalents of $41.0 million. This compares with $60.2 million at the end of the second quarter of 2026 and $70.8 million at the end of the third quarter of 2025.
Summary Financial Results
(In Thousands of US Dollars, except Per Share data)
Three Months Ended
September 30,
Nine Months Ended
September 30,
2026
(unaudited)
2025
(unaudited)
% Change
(unaudited)
2026
(unaudited)
2025
(unaudited)
% Change
(unaudited)
Net Revenues
99,975
98,558
1 %
297,188
291,630
2 %
Gross Profit
29,127
24,181
20 %
79,041
69,822
13 %
Income Earned on Sale of Transferred Assets, net
2,381
3,020
(21) %
7,375
8,873
(17) %
Net Income (Loss)
(10,273)
(23,019)
55 %
(48,851)
(53,789)
9 %
Adjusted Net Income (Loss)¹
(5,804)
(15,788)
63 %
(40,170)
(46,979)
14 %
Basic earnings (Loss) per common share
(0.92)
(2.08)
56 %
(4.38)
(4.87)
10 %
Adjusted Basic earnings (Loss) per common share¹
(0.52)
(1.42)
64 %
(3.60)
(4.25)
15 %
Adjusted EBITDA¹
18,554
13,269
40 %
42,518
39,517
8 %
Net cash provided by (used in) operating activities
(4,615)
1,534
(401) %
845
(3,151)
127 %
1 Non-GAAP financial measures are described below and reconciled to GAAP measures in the accompanying tables.
Summary of Revenues, Gross Profit and Adjusted EBITDA
(In Thousands of US Dollars)
Revenue
Gross Profit
Adj. EBITDA¹
3 Months Ended
September 30
3 Months Ended
September 30
3 Months Ended
September 30
2026
(unaudited)
2025
(unaudited)
2026
(unaudited)
2025
(unaudited)
2026
(unaudited)
2025
(unaudited)
DOMAINS AND WAVELO SERVICES
Tucows Domain Services:
Wholesale
Domain Services
48,875
51,888
Value Added Services
5,088
6,107
Total Wholesale
53,963
57,995
Retail
9,945
9,842
Total Tucows Domain Services
63,908
67,837
17,832
19,105
11,064
12,097
Wavelo Services:
11,725
11,856
7,070
7,674
4,569
4,285
Total Domains and Wavelo Services
75,633
79,693
24,902
26,779
15,633
16,382
TING INTERNET SERVICES
Fiber Internet Services
18,021
16,976
Construction Services
4,282
—
Total Ting
22,303
16,976
2,700
339
1,506
(882)
CORPORATE & OTHER
Mobile Services and Eliminations
2,039
1,889
1,525
(2,937)
1,415
(2,231)
Total
99,975
98,558
29,127
24,181
18,554
13,269
1 Non-GAAP financial measures are described below and reconciled to GAAP measures in the accompanying tables.
2 Beginning in the third quarter of 2025, the Company revised its presentation of segment gross profit to reflect amounts net of network expenses. This change provides a more consistent view of segment-level profitability and aligns with how management evaluates operating performance. The revision did not impact gross profit, Adjusted EBITDA or revenue.
Notes:
1. Tucows reports all financial information required in conformity with United States generally accepted accounting principles (GAAP).
Along with this information, to assist financial statement users in an assessment of our historical performance, the Company discloses non-GAAP financial measures in press releases and on investor conference calls and related events, as the Company believes that the non-GAAP information enhances investors’ overall understanding of our financial performance, and should be read in addition to, rather than instead of, the financial statements prepared in accordance with GAAP.
Non-GAAP financial measures do not reflect a comprehensive system of accounting and may differ from non-GAAP financial measures with the same or similar captions that are used by other companies and/or analysts and may differ from period to period. The Company endeavors to compensate for these limitations by providing the relevant disclosure of the items excluded in the calculation of Adjusted EBITDA to net income based on U.S. GAAP; Adjusted net income to GAAP net income; and adjusted basic earnings per share to GAAP basic earnings per share, which should be considered when evaluating the Company’s results. Tucows strongly encourages investors to review its financial information in its entirety and not to rely on a single financial measure.
Adjusted EBITDA
The Company believes that the provision of this supplemental non-GAAP measure allows investors to evaluate the operational and financial performance of the Company’s core business using similar evaluation measures to those used by management. The Company uses Adjusted EBITDA to measure its performance and prepare its budgets. Since Adjusted EBITDA is a non-GAAP financial performance measure, the Company’s calculation of Adjusted EBITDA may not be comparable to other similarly titled measures of other companies; and should not be considered in isolation, as a substitute for, or superior to measures of financial performance prepared in accordance with GAAP. Because Adjusted EBITDA is calculated before certain recurring cash charges, including interest expense and taxes, and is not adjusted for capital expenditures or other recurring cash requirements of the business, it should not be considered as a liquidity measure.
The Company’s Adjusted EBITDA definition excludes depreciation, impairment and loss on disposition of property and equipment, amortization of intangible assets, income tax provision, interest expense (net), stock-based compensation, asset impairment, gains and losses from unrealized foreign currency transactions, loss on debt extinguishment and costs that are not indicative of on-going performance (profitability), including acquisition and transition costs. Gains and losses from unrealized foreign currency transactions removes the unrealized effect of the change in the mark-to-market values on outstanding unhedged foreign currency contracts, as well as the unrealized effect from the translation of monetary accounts denominated in non-U.S. dollars to U.S. dollars.
The following table reconciles net loss to Adjusted EBITDA (in thousands of US dollars):
3 Months Ended
September 30
9 Months Ended
September 30
2026
(unaudited)
2025
(unaudited)
2026
(unaudited)
2025
(unaudited)
Net income (Loss) for the period
(10,273)
(23,019)
(48,851)
(53,789)
Less:
Provision (recovery) for income taxes
1,988
2,456
7,510
6,887
Depreciation of property and equipment
10,212
10,405
30,425
31,404
Impairment of property and equipment
—
10,885
614
11,524
Loss (gain) on disposition of property and equipment
(1)
(3,965)
827
(5,753)
Amortization of intangible assets
696
1,072
2,497
3,393
Interest expense, net
10,689
13,901
39,004
41,135
Stock-based compensation
962
1,387
3,220
4,278
Unrealized loss (gain) on foreign exchange revaluation of foreign denominated monetary assets and liabilities
(189)
(164)
32
(601)
Acquisition, transaction and transition costs*
4,470
311
7,240
1,039
Adjusted EBITDA
18,554
13,269
42,518
39,517
* Acquisition, transaction and transition costs represent transaction-related expenses and transitional expenses. Expenses include severance or transitional costs associated with department, operational or overall company restructuring efforts, including geographic alignments.
Adjusted Net Income and Adjusted Basic Earnings Per Common Share (Adjusted EPS)
The Company believes that the provision of this supplemental non-GAAP measure allows investors to best evaluate our operating results and understand the operating trends of our core business without the effect of acquisition and transition costs, impairment expenses and losses on extinguishment of debt. Acquisition and transition costs represent transaction-related expenses and transitional expenses. Expenses include severance or transitional costs associated with department, operational or overall company restructuring efforts, including geographic alignments. Since adjusted net income and adjusted EPS are non-GAAP financial performance measures, the Company’s calculation of adjusted net income and adjusted EPS may not be comparable to other similarly titled measures of other companies; and should not be considered in isolation, as a substitute for, or superior to measures of financial performance prepared in accordance with GAAP.
The Company’s adjusted net income and adjusted EPS definitions exclude from the calculation of reported GAAP net income and GAAP EPS, the effect of the following items: impairment of property, acquisition and transition costs (including restructuring charges), and loss on debt extinguishment.
The following table reconciles adjusted net income and adjusted EPS to GAAP net income (In thousands of US dollars, except Per Share data):
3 Months Ended
September 30
9 Months Ended
September 30
2026
(unaudited)
2025
(unaudited)
2026
(unaudited)
2025
(unaudited)
Net Income (Loss) for the period
(10,273)
(23,019)
(48,851)
(53,789)
Less:
Acquisition and transition costs*
4,470
311
7,240
1,039
Impairment of property and equipment
—
10,885
614
11,524
Loss (gain) on disposition of property and equipment
(1)
(3,965)
827
(5,753)
Adjusted Net Income (Loss)¹ for the period
(5,804)
(15,788)
(40,170)
(46,979)
Adjusted Basic Earnings (Loss) Per Common Share¹
(0.52)
(1.42)
(3.60)
(4.25)
* Acquisition and transition costs represent transaction-related expenses and transitional expenses. Expenses include severance or transitional costs associated with department, operational or overall company restructuring efforts, including geographic alignments.
Management Commentary
Concurrent with the dissemination of its quarterly financial results news release at 5:05 p.m. ET on Thursday, November 5, 2026, management’s pre-recorded audio commentary (and transcript), discussing the quarter and outlook for the Company will be posted to the Tucows website at http://www.tucows.com/investors/financials.
Following management’s prepared commentary, for the subsequent seven days, until Thursday, November 12, 2026, shareholders, analysts and prospective investors can submit questions to Tucows’ management at ir@tucows.com. Management will post responses to questions in an audio recording and transcript to the Company’s website at http://www.tucows.com/investors/financials, on Wednesday, November 18, 2026, at approximately 5 p.m. ET. All questions will receive a response, however, questions of a more specific nature may be responded to directly.
About Tucows
Tucows helps connect more people to the benefit of internet access through domain services, communications service technology, and fiber-optic infrastructure. Tucows Domains (https://tucowsdomains.com) manages over 21 million domain names and millions of value-added services through a global reseller network of 32,000 web hosts and ISPs. Hover (https://hover.com) makes it easy for individuals and small businesses to manage their domain names and email addresses. Wavelo (https://wavelo.com) is a telecommunications software suite for service providers that simplifies the management of mobile and internet network access; provisioning, billing and subscription; developer tools; and more. Ting (https://ting.com) delivers fixed fiber Internet access with outstanding customer support. More information can be found on Tucows’ corporate website (https://tucows.com).
Tucows, Hover, Wavelo, and Ting are registered trademarks of Tucows Inc. or its subsidiaries.
This release includes forward-looking statements as that term is defined in the U.S. Private Securities Litigation Reform Act of 1995, including statements regarding our expectations regarding our future financial results. These statements are based on management’s current expectations and are subject to a number of uncertainties and risks that could cause actual results to differ materially from those described in the forward-looking statements. Information about other potential factors that could affect Tucows’ business, results of operations and financial condition is included in the Risk Factors sections of Tucows’ filings with the Securities and Exchange Commission. All forward-looking statements should be evaluated with the understanding of their inherent uncertainty. All forward-looking statements are based on information available to Tucows as of the date they are made. Tucows assumes no obligation to update any forward-looking statements, except as may be required by law.
View original content to download multimedia:https://www.prnewswire.com/news-releases/tucows-reports-third-quarter-results-in-line-with-expectations-with-progress-on-balance-sheet-obligations-302931315.html
SOURCE Tucows Inc.
Technology
Greenlane Renewables Announces Third Quarter 2026 Financial Results
Published
5 seconds agoon
November 5, 2026By
~On track with execution of strategic plan; quarter highlighted by second highest positive Adjusted EBITDA result and solid progress toward completing production readiness for new products by year-end~
VANCOUVER, BC, Nov. 5, 2026 /CNW/ — Greenlane Renewables Inc. (“Greenlane” or the “Company”) (TSX: GRN) (FSE: 52G) (OTC: GRNWF) today announced its financial results for the third quarter ended September 30, 2026. For further information on these results please see the Company’s Condensed Consolidated Interim Financial Statements and Management’s Discussion and Analysis filed under the Company’s profile on SEDAR+ at www.sedarplus.ca. All amounts reported are in Canadian dollars and in accordance with International Financial Reporting Standards as issued by the International Accounting Standards Board (“IFRS Accounting Standards”) unless otherwise stated.
Third Quarter Highlights from Continuing Operations Include:
Revenue of $12.3 million;Gross profit of $5.5 million, Gross Margin1 before amortization of $5.7 million (46% of revenue);Adjusted EBITDA2 of $2.0 million;Net income and comprehensive income of $0.4 million;Sales Order Backlog3 of $21.6 million as at September 30, 2026;Cash and cash equivalents of $12.2 million and no debt, other than payables resulting from normal course operations, as at September 30, 2026;Announced during the quarter Cascade H₂S order and service work order from an existing customer in the United States totalling $2.5 million; andExtended its $20 million standby letter of credit facility to September 30, 2027, secured by a guarantee from Export Development Canada.
“Greenlane delivered an outstanding third quarter, generating $2.0 million in Adjusted EBITDA, representing the Company’s second-highest quarterly Adjusted EBITDA result,” said Brad Douville, CEO of Greenlane. “The strong result reflects disciplined execution of our strategic plan which involves continuing sales growth in our most profitable business areas, ramping down our legacy low-margin biogas upgrading system contracts to ramp back up centered on our next-generation proprietary Cascade LF and Cascade MS product lines to add step-change profitable growth potential.”
“Panasonic is making solid progress toward achieving production readiness in Brazil, our launch market for our new product lines, by the end of the year, subject to receiving its permits. Upgrades to one of its factories is nearly complete. They have issued purchase orders for manufacturing equipment and long-lead-time bill of materials items for the first production units. They are also continuing to add new team members to support their ramp up. In the meantime, the Greenlane sales team is advancing a number of opportunities through the sales funnel, with some now in the late stages of the process. Quoting of the new products began about a year ago after the product reveal. Sales cycles in our industry are long and can be one to two years. With Brazil being the launch market, sales efforts have focused there, but a number of opportunities for the North American market are advancing through the sales funnel too. We expect to complete production readiness to serve the North American market in 2027.”
“We believe that our next generation Cascade LF and Cascade MS product lines will deliver attractive return-on-investment results to our customers with the best combination of product, price and performance. During the development cycle, our team has been agile and quick to innovate and respond to customer needs and changing market dynamics. We are fortifying our sustainable comparative advantage by capturing and protecting a growing portfolio of intellectual property. Our partnership with Panasonic enables local production in Brazil to allow our customers to avoid import tariffs and secure project financing at attractive rates. We have estimated the annual total addressable market for these new product lines in Brazil, the United States and Canada at $1.3 billion, of which we think we can capture a substantial share. With a strong balance sheet and no debt, we believe Greenlane is well positioned to realize the opportunities in front of us.”
“Our strong third-quarter financial performance was driven by increased parts and service and biogas desulfurization activity as well as improved margins on system sales,” said Stephanie Mason, CFO of Greenlane. “Revenue increased 7% compared to the same quarter last year to $12.3 million, supported by a 55% increase in parts and service revenue to $5.0 million partially driven by a significant order from an existing RNG project developer customer in the United States. Gross margin before amortization improved to 46%, compared with 39% in the prior-year quarter, reflecting a favourable project mix driven by higher parts and service and biogas desulfurization system sales, our most profitable business areas. Our biogas desulfurization systems are produced in our factory in Italy and delivered globally through our wholly-owned subsidiary Airdep S.r.l. Biogas upgrading system sales decreased in the quarter as three contracts were completed releasing approximately $0.7 million in project contingency.
“Adjusted EBITDA increased to $2.0 million up from $0.5 million in the third quarter of 2025, benefiting from higher gross profit and lower operating expenses. Operating expenses also reflected the capitalization of $0.7 million in development expenditures following the achievement of key milestones for our next-generation Cascade LF and MS product lines. These results demonstrate the positive contribution from our most profitable business areas as we continue investing in new product development and commercialization.”
“We ended the quarter with $12.2 million in cash, no debt and a $20 million standby letter of credit facility, providing financial flexibility to support ongoing operations, product commercialization and future growth opportunities.”
The Market Outlook
In North America, regulatory developments continue to support the renewable natural gas (“RNG”) industry. The American Biogas Council recently welcomed new guidance from the Internal Revenue Service (“IRS”) providing certainty for RNG producers to utilize the Section 45Z Clean Fuel Production Tax Credit. The guidance incorporates several provisions intended to encourage investment in new biogas systems that convert organic waste into RNG for use as a clean transportation fuel. Previous uncertainty surrounding the application of the credit to RNG and different organic waste feedstocks had contributed to delayed investment and project development.
In Europe, biomethane continues to gain recognition as a strategic component of energy security and decarbonization. Speaking at European Biomethane Week 2026 in Brussels, EU Commissioner for Energy and Housing Dan Jørgensen emphasized the importance of renewable molecules, including biogas and biomethane, in strengthening Europe’s energy independence while supporting climate objectives.
As noted in the Brazilian media, infrastructure investment entered a more volatile phase as the first round of the presidential election approached at the beginning of October. Market participants remained cautious as a tight presidential race drove interest and foreign exchange rate volatility, while some saw post-election asymmetries. Investors were preparing for a period in which even small shifts in perceptions of the race could trigger outsized movements. Following President Lula’s re-election, Brazil’s energy sector anticipates continued support for the country’s energy transition policies. Among the expected developments is greater coordination among government ministries and agencies to advance the energy transition, including a deepening of government support for biofuels such as biomethane.
Management’s Discussion on Financial Results
The public is invited to watch Brad Douville, Chief Executive Officer, and Stephanie Mason, Chief Financial Officer present the results through a video presentation on the Company’s Events and Presentations page located HERE.
SPECIFIED FINANCIAL MEASURES
Management evaluates the Company’s performance using a variety of measures, including “Gross Margin before amortization”, “Adjusted EBITDA” and “Sales Order Backlog”. The specified financial measures, including non-IFRS Accounting Standards measures and supplementary financial measures should not be considered as an alternative to or more meaningful than revenue, gross profit or net income. These measures do not have a standardized meaning prescribed by IFRS Accounting Standards and therefore they may not be comparable to similarly titled measures presented by other publicly traded companies and should not be construed as an alternative to other financial measures determined in accordance with IFRS Accounting Standards. The Company believes these specified financial measures provide useful information to both management and investors in measuring the financial performance and financial condition of the Company. Management uses these specified financial measures to exclude the impact of certain expenses and income that must be recognized under IFRS Accounting Standards when analyzing consolidated underlying operating performance, as the excluded items are not necessarily reflective of the Company’s underlying operating performance and make comparisons of underlying financial performance between periods difficult. From time to time, the Company may exclude additional items if it believes doing so would result in a more effective analysis of underlying operating performance. The exclusion of certain items does not imply that they are non-recurring.
Note 1 – Gross Margin before amortization is a non-IFRS measure and is defined by the Company as gross profit before amortization of intangible assets and property and equipment.
Note 2 – Adjusted EBITDA is a non-IFRS measure and is defined by the Company as earnings before interest, taxes, foreign exchange, depreciation and amortization, as well as adjustments for other income (expense), value assigned to options, restricted share units and performance restricted share units granted, and transaction costs.
Reconciliation of net loss and comprehensive loss to Adjusted EBITDA from Continuing Operations:
(in $000s)
Three months ended
September 30
2026
2025
Net Income (loss) and comprehensive income (loss) from
continuing operations
408
103
Add (deduct):
Exchange difference on translating
foreign operations
47
(87)
Provision for income taxes
919
502
Other (income) loss
11
(23)
Foreign exchange (gain) loss
157
(359)
Finance income
(42)
(70)
Finance expense
46
40
Share-based compensation
174
107
Amortization of office equipment
45
45
Amortization of property and equipment
111
91
Amortization of intangible assets
154
154
Adjusted EBITDA
2,030
503
Note 3 – Sales Order Backlog is a non-IFRS measure and is defined by the Company as the balance of unrecognized revenue from sales contracts. The Company’s Sales Order Backlog is a snapshot in time which varies from period-to-period. The Sales Order Backlog increases by the value of new system supply contracts and is drawn down over time as these projects progress towards completion with amounts recognized in revenue (by reference to the stage of completion of each contract). Sales Order Backlog includes no amounts in connection with parts and service, given the smaller individual order values, and no amounts in connection with royalty contracts.
About Greenlane Renewables
Greenlane is driving change: accelerating the energy transition. We are cleaning up two of the largest and most difficult to decarbonize sectors of the global energy system: the natural gas grid and commercial transportation. As a pioneer and leading global technology provider and supplier of biogas desulfurization and upgrading systems, we have been actively contributing to the decarbonization of our planet for over 35 years with more than 355 systems supplied into 28 countries. We transform biogas generated from organic waste into high-value grid-ready renewable natural gas (“RNG”) from a wide range of sources such as landfills, sugar mills, dairy farms, wastewater, and food waste. Greenlane is transforming energy production and creating new, sustainable revenue streams for its customers – all while dramatically reducing carbon emissions. Partner with us, let’s accelerate the energy transition together. For further information, please visit www.greenlanerenewables.com.
Forward Looking Information Advisory –
This news release contains “forward-looking information” within the meaning of applicable securities laws. All statements contained herein that are not historical in nature contain forward-looking information. Forward-looking information can be identified by words or phrases such as “may”, “expect”, “will”, “would”, “likely”, “could”, “plan”, “expects” or “is expected to”, “believe”, “continue to”, “remains” or “continually”, “is pursuing”, “proposed”, “aiming to” or the negative of these terms, or other similar words, expressions and grammatical variations thereof, or statements that certain events or conditions “may” or “will” happen or that current events or conditions will continue or be repeated. The forward-looking information contained in this press release, includes, but is not limited to: management’s expectations regarding the disciplined execution of the Company’s strategic plan, continuing sales growth in the most profitable business areas, the ramping down of legacy low-margin contracts and the ramping up based on next-generation Cascade LF and Cascade MS product lines to add step change profitable growth potential; Panasonic’s progress towards achieving production readiness in Brazil by end of the year; the advancement of sales opportunities in Brazil and the North American market; expectations regarding completion of production readiness to serve North American market in 2027; expectations that Cascade LF and Cascade MS will deliver attractive return-on investment results with the best combination of product, price and performance; expectations of Company’s ability to capture substantial share of the $1.4 billion annual total addressable market across Brazil, the United States and Canada; expectations of benefits of Panasonic partnership in facilitating local production in Brazil to avoid import tariffs and secure attractive project financing; expectations that North America regulatory developments support the RNG industry and provides certainty for RNG producers to utilize Section 45Z Clean Fuel Production Tax Credit. The forward-looking information contained herein is made as of the date of this press release and is based on assumptions management believes to be reasonable at the time such statements were made, including Panasonic’s ability to timely obtain permits and achieve manufacturing readiness in Brazil by 2026; the Company’s ability to achieve North America production readiness in 2027, commercial viability of Cascade LF and Cascade MS, management’s perceptions of future growth, expectations regarding demand for RNG and biogas upgrading systems; the continued availability of government support and favorable regulatory frameworks for renewable energy; the state of competition in the RNG industry; the $0.7 million capitalization of development costs assuming that the Cascade LF and Cascade MS product lines achieved the requisite key milestones; the Company’s ability to manage costs and maintain operating efficiencies. While management considers these assumptions to be reasonable based on information currently available to management, there is no assurance that such expectations will prove to be correct. By their nature, forward-looking information is subject to inherent risks and uncertainties that may be general or specific and which give rise to the possibility that expectations, forecasts, predictions, projections or conclusions will not prove to be accurate, that assumptions may not be correct and that objectives, strategic goals and priorities will not be achieved. A variety of factors, including known and unknown risks, many of which are beyond Greenlane’s control, could cause actual results to differ materially from the forward-looking information in this press release. Such factors include, without limitation risks relating to: performance and market acceptance of the Cascade LF technology and related intellectual property; the Company’s ability to convert sales order backlog into revenue; fluctuations in customer demand, project schedules or contract margins; changes in government policies, incentives, or regulations affecting the RNG and biogas sectors; competitive pressures; supply chain disruptions; and general economic and geopolitical conditions. Additional risk factors can also be found in the Company’s Management Discussion and Analysis and its Annual Information Form, all of which have been filed under the Company’s SEDAR+ profile at www.sedarplus.ca. Readers are cautioned not to put undue reliance on forward-looking information. The Company undertakes no obligation to update or revise any forward-looking information, whether as a result of new information, future events or otherwise, except as required by applicable law. Forward-looking statements contained in this news release are expressly qualified by this cautionary statement.
FINANCIAL OUTLOOK INFORMATION – This news release contains “financial outlook information” regarding Greenlane’s prospective revenue and results, which is subject to the same assumptions, risk factors, limitations, and qualifications as set forth in the above. Revenue and other estimates contained in this news release were made by Greenlane management as of the date of this news release and are provided for the purpose of describing anticipated changes, and are not an estimate of profitability or any other measure of financial performance. Investors are cautioned that the financial outlook information contained in this news release should not be used for purposes other than for which it is disclosed herein. The Company’s revenues are largely derived from a relatively small number of biogas upgrader orders accounted for on a stage of completion basis over typically a nine to eighteen-month period. Timing of new contract awards varies due to customer-related factors such as finalizing technical specifications and securing project funding, permits and RNG off-take and feedstock agreements. Some contracts contain termination provisions that allow the customer to terminate with no penalty or with minimum prescribed threshold payments based on the length of time since the contract was entered into. Some projects have built-in pause periods to allow customers to complete concurrent activities such as civil work. As a result, the Company’s revenue varies from month to month and quarter-to-quarter. THE COMPANY QUALIFIES ALL THE FORWARD LOOKING STATEMENTS AND FINANCIAL OUTLOOK INFORMATION CONTAINED IN THIS NEWS RELEASE BY THE FOREGOING CAUTIONARY STATEMENTS.
Neither the TSX Exchange nor its Regulation Services Provider (as that term is defined in the policies of the TSX Exchange) accepts responsibility for the adequacy or accuracy of this release or has in any way approved or disapproved of the contents of this news release.
SOURCE Greenlane Renewables Inc.

―Third Quarter Marks Return to Year-on-Year Revenue Growth―
―Revenue from Federal Government Clients Increased 3.4% Sequentially―
―Margin Expansion Benefited from Efficient Contract Delivery and Favorable Contract Mix―
―Maintains 2026 Non-GAAP EPS Guidance Midpoint on Lower Revenue―
Third Quarter Highlights:
Revenue Increased 1% to $470 MillionNet Income Was $32 Million; GAAP EPS Was $1.76Non-GAAP EPS1 Increased 19% to $1.98EBITDA1 Was $53.6 Million; Adjusted EBITDA1 Was $54.2 Million, or 11.5% of Total RevenuesContract Awards Were $746 Million, 4.5% Ahead of Last Year and Representing a Quarterly Book-to-Bill Ratio of 1.59 and a TTM Book-to-Bill Ratio of 1.11
RESTON, Va., Nov. 5, 2026 /PRNewswire/ — ICF (NASDAQ: ICFI), a global consulting and technology services provider, reported results for the third quarter ended September 30, 2026.
Management Commentary
John Wasson, chair and chief executive officer, said, “Our third quarter performance demonstrated the return to year-on-year revenue growth that we anticipated would begin in the second half of this year and benefited from our diversified and integrated business model. Revenues from our federal government clients continued to show solid sequential growth in line with our expectations, and revenues from state and local and non-U.S. government clients increased 7.6% and 12.0% year-on-year, respectively.
“A key highlight of the third quarter was our strong margin performance, benefiting from efficient contract delivery and favorable contract mix. Our Adjusted EBITDA margin was 11.5%, expanding by 10 basis points year-on-year and representing a notable sequential increase. Fixed-price contracts accounted for 50.2% of our third quarter revenues, up from 48.7% in the similar period last year, and together with time & material contracts represented 94.3% of this quarter’s revenues. We are closely managing corporate costs, while continuing to invest in technology and professional staff to support client programs and capture new business opportunities.
“Third quarter revenues from commercial energy clients were considerably below our expectations due to a confluence of factors, most notably a sharp fall-off in contract add-on activity that historically has bolstered second half revenues in our utility programs category. There was a material increase in political and regulatory pressure on utilities in Q3 to develop affordable solutions for their customers, which has caused a slowdown and/or shift in incremental spending priorities for certain existing utility programs. Also, we experienced slower than expected ramp-ups on new contracts. As a result, ICF’s revenues from commercial energy clients are expected to increase at a low- to mid-single-digit rate for 2026. We continue to see commercial energy as a long-term growth driver for ICF. Our year-to-date contract awards have been strong, our win rates are increasing, and we are building a meaningful pipeline in areas where we see utility spending expanding, including audits/weatherization, demand response and virtual power plants.
“This also was a strong quarter for companywide contract awards, which increased 4.5% year-on-year to $746 million. Over 60% of our third quarter awards represented new business, a good indication of how well ICF’s capabilities and expertise are aligned with our clients’ priorities. Following this solid performance, our business development pipeline stood at $8.2 billion at the end of the third quarter and was well diversified across our client set.”
Third Quarter Business Highlights in Key Long-Term Growth Markets
Commercial Energy
ICF manages over 300 energy efficiency programs for 60 utilities in 28 states. Revenues from this part of the company’s commercial energy business were similar to last year’s levels due to the near-term challenges described above. We continue to see positive underlying momentum supported by year-to-date contract wins and client demand for our expertise as they address affordability issues together with operational imperatives around electrification and data center requirements. Energy advisory revenues increased 14.1% in the quarter and 10.5% year-to-date, with particular strength in our work on grid engineering and planning, transmission and interconnection, integrated power and gas planning, resource adequacy, technical due diligence, and storage. Additionally, our work with hyperscalers is expanding, and we are advising on a broader set of issues created by the scale of data center development, including energy efficiency, community impacts, power supply and reliability. As anticipated, other commercial energy comparisons declined year-on-year due to the wind-down of several wind energy projects through last year’s third quarter.
Commercial energy awards represented approximately 26% of year-to-date contract awards, and commercial energy opportunities represent more than $1.6 billion of our pipeline at the end of the third quarter.
ICF’s energy work includes programs for federal and state agencies that provide us with greater insight into the regulatory and stakeholder environment, which strengthens our ability to meet and often exceed the milestones of our commercial energy contracts.
Technology Modernization
ICF has built out its technology modernization capabilities over the last six years, which in the third quarter represented approximately 50% of our revenues from federal government clients. Over 80% of ICF’s technology modernization work is performed under outcome-based, fixed-price contracts, the preferred contract vehicles for government technology projects. Additionally, we continue to align our federal portfolio around administration priorities, with increased focus on expanding our footprint in the defense and national security arena, while building our brand in government-wide application modernization.
While primarily serving federal agency clients, our technology modernization capabilities are deployed across the company’s client categories. Technology modernization opportunities represented approximately $2.4 billion of our pipeline at the end of the third quarter.
State and Local Government/Disaster Recovery
The 7.6% revenue growth from state and local government clients in the third quarter illustrates ICF’s ability to leverage its deep domain expertise and robust technology capabilities across its client sets. Several of the projects driving growth in this client category include developing and managing energy efficiency programs in the Northeast and California, providing advanced technology solutions to several states and territories, and offering our rural health services.
During the quarter, ICF supported more than 50 active disaster recovery programs in more than 20 states and territories. While we view the disaster management market as a driver of long-term growth, funding delays and the slower pace of major events have constrained near-term activity in this arena. ICF continues to execute substantial rebuilding and mitigation projects utilizing our environmental and climate expertise, and we are helping our clients prepare to take on a larger role in rebuilding and resilience, having significantly increased our on-call contracts with state and local governments. State and local government opportunities represented approximately $1.1 billion of the total pipeline at the end of the third quarter.
Third Quarter 2026 Financial Results
Third quarter 2026 total revenue was $470.5 million, up 1.1% from the $465.4 million reported in the third quarter of 2025. Subcontractor and other direct costs were 23.6% of total revenues, compared to 24.2% in last year’s third quarter. Gross margin was 38.1%, 50 basis points above the prior year period. Operating income was $43.6 million, up 13.6% from $38.4 million, and operating margin expanded by 100 basis points to 9.3% from 8.3% in the prior year period. Net income totaled $31.7 million, or $1.76 per diluted share, up from net income of $23.8 million, or $1.28 per share reported in the third quarter of 2025, benefiting from a tax rate of 15.0% and a lower share count. In the prior year quarter, the company’s tax rate was 22.7%.
Non-GAAP EPS increased 18.6% to $1.98 per share, benefiting from the lower tax rate and share count mentioned above. EBITDA was $53.6 million, up from $52.8 million reported in the year-ago quarter. Adjusted EBITDA was $54.2 million, and Adjusted EBITDA margin on total revenues was 11.5%, compared to 11.4% in the third quarter of 2025.
Cash flows from operations were $35.2 million in this year’s third quarter. Excluding restricted cash mainly tied to energy efficiency programs, which fluctuates with the timing of incentive payments to utility customers, operating cash flow was $45.5 million, up from $17.3 million reported in the comparable prior year period. For the first nine months of 2026, cash flows from operations were $131.7 million. Excluding restricted cash, year-to-date operating cash flows were $88.7 million, up from $30.2 million in the first nine months of 2025, on a similarly adjusted basis.
Backlog and New Business
Total backlog was $3.5 billion at the end of the third quarter of 2026. Funded backlog was $1.8 billion, or approximately 52% of the total backlog. The total value of contracts awarded in the 2026 third quarter was $746 million for a quarterly book-to-bill ratio of 1.59 and trailing twelve-month contract awards totaled $2.0 billion for a book-to-bill ratio of 1.11.
Commercial Revenue Third Quarter 2026 Highlights
Commercial revenue was $158.8 million during the quarter, up 1.5% year-over-year.
Commercial revenue accounted for 33.8% of total revenue, similar to 33.6% of total revenue in the 2025 third quarter.Commercial energy revenues represented 88.6% of commercial revenue.
Key Commercial Contracts Awarded in the Third Quarter of 2026
Notable commercial contract awards won in the third quarter of 2026 included:
A contract modification with a Canadian electricity system organization to continue implementing a North American midstream lighting program to expand adoption of energy-efficient technologies by commercial and industrial customers.A new contract with a Mid-Atlantic U.S. electric utility to provide detailed engineering for transmission infrastructure.A new contract with a Mid-Atlantic U.S. utility to provide marketing and customer engagement services supporting its energy efficiency and energy management programs.A recompete contract with a Mid-Atlantic U.S. utility to provide ICF Sightline technology supporting its energy efficiency programs.A new contract with a Mid-Atlantic U.S. utility to provide marketing and customer engagement services supporting its customer programs.A new contract with a Northeastern U.S. utility to support its virtual power plant and battery energy storage program.
Government Revenue Third Quarter 2026 Highlights
Revenue from government clients was $311.7 million during the quarter.
U.S. federal government revenue was $191.3 million, 3.4% above the $185.1 million in the second quarter of 2026, and 3.5% below the $198.3 million reported in the year-ago third quarter. Year-on-year revenue comparisons were impacted by contract cancellations that occurred in 2025, and a slower pace of new RFPs. Federal government revenue accounted for 40.7% of total revenue, compared to 42.6% of total revenue in the third quarter of 2025.U.S. state and local government revenue was $87.9 million, 7.6% above the $81.7 million reported in the year-ago quarter. State and local government clients represented 18.7% of total revenue, compared to 17.6% in the third quarter of 2025.International government revenue was $32.5 million, up 12.0% from the $29.0 million reported in the year-ago quarter. International government revenue represented 6.9% of total revenue, compared to 6.2% in the third quarter of 2025.
Key Government Contracts Awarded in the Third Quarter of 2026
Notable government contract awards won in the third quarter of 2026 included:
A recompete contract with a value of $77.8 million with a federal health agency to provide technical assistance, training and capacity-building services to support the effective administration and delivery of state and territory childcare programs.Two new, multiyear work orders under the County of Los Angeles Energy Support Services Master Agreement with a combined ceiling value of $70.9 million to serve as one of three implementers supporting the Southern California Regional Energy Network’s public sector energy efficiency programs.Two new contracts with a combined value of $55.9 million with a federal national security agency to modernize technology systems supporting personnel security and vetting operations.Three contracts, one new and two recompetes, with a combined value of $36.4 million with a federal health agency to provide communications, marketing and strategic planning for nutrition and physical activity; prostate cancer awareness; and diabetes health education and support.A new contract with a value of $36.3 million with a federal agency to modernize a survey instrument by transitioning to digital collection, dashboards and AI-assisted tools while maintaining data security and statistical integrity.A recompete contract with a value of $22.6 million with a federal health agency to provide training and technical assistance to strengthen the delivery and effectiveness of early childhood programs serving children and families.A new contract with a value of $17.3 million with a federal public safety agency to modernize call center and case management technologies through platform-as-a-service solutions that enhance customer service and mission operations.A new contract with a value of $17.1 million with a federal law enforcement agency to modernize its human resources case management and hiring systems.A recompete contract with a ceiling value of $27.6 million with a federal environmental agency to provide laboratory, field sampling, data validation and quality assurance services.A recompete contract with a value of $15.4 million with a federal health and human services agency to provide compliance auditing, quality assurance and technical assistance services supporting federally funded care facilities.
Dividend Declaration
On November 5, 2026, ICF declared a quarterly cash dividend of $0.14 per share, payable on January 8, 2027, to shareholders of record on December 4, 2026.
Summary and Outlook
“ICF is on the path to second half year-on-year revenue growth, and we see positive momentum as we head into 2027. The adjusted EBITDA margin expansion we achieved in the third quarter was notable, our new contract awards were strong, and our business development pipeline is robust, all indications of the underlying strength of our business and effective cost management. Additionally, given ICF’s diversified portfolio, we see the midterm election results as a tailwind for our business.
“For full year 2026, we are expecting revenues to be similar to 2025 levels, with GAAP EPS of approximately $5.95, inclusive of $.11 of special charges. We are maintaining the midpoint of our Non-GAAP EPS guidance range of $7.10, representing 4.9% year-on-year growth and benefiting from improved margins, a lower interest rate and reduced share count. Operating cash flow is expected to range from $135 million to $150 million, excluding the impact of restricted cash.
“We continue to benefit from the energy of our people, who have shown tremendous dedication and commitment to our clients and embody the strong corporate culture that ICF is known for,” Mr. Wasson concluded.
1 Non-GAAP EPS, EBITDA and Adjusted EBITDA are non-GAAP measurements. A reconciliation of all non-GAAP measurements to the most applicable GAAP number is set forth below. Special charges are items that were included within our consolidated statements of comprehensive income but are not indicative of ongoing performance and have been presented net of applicable U.S. GAAP taxes. The presentation of non-GAAP measurements may not be comparable to other similarly titled measures used by other companies.
About ICF
ICF is a leading global solutions and technology provider. At ICF, business analysts and policy specialists work together with digital strategists, data scientists and creatives. We combine unmatched industry expertise with cutting-edge engagement capabilities to help organizations solve their most complex challenges. Since 1969, public and private sector clients have worked with ICF to navigate change and shape the future. Learn more at icf.com.
Caution Concerning Forward-looking Statements
Statements that are not historical facts and involve known and unknown risks and uncertainties are “forward-looking statements” as defined in the Private Securities Litigation Reform Act of 1995, as amended. Such statements may concern our current expectations about our future results, plans, operations and prospects and involve certain risks, including those related to: the government contracting industry generally; our dependence on contracts with U.S. federal, state and local, and international government clients for the majority of our revenue; failure by Congress or other governmental bodies to approve budgets and appropriations in a timely fashion, reductions in government spending, and the impact of a lengthy federal government shutdown; the current Administration’s policy changes, executive orders, and failure to spend Congressionally mandated appropriations, including the resulting effect on government audits and contract terminations; changes in federal government budgeting and spending priorities; our ability to estimate and control costs under our fixed-price contracts; the realization of our backlog; the dependence of our commercial work on sectors of the global economy that are highly cyclical; and our ability to acquire and successfully integrate businesses. These and other factors that could cause our actual results to differ materially from those indicated in our forward-looking statements are described in the “Risk Factors” section of our Annual Report on Form 10-K for the year ended December 31, 2025, and in our subsequent filings with the Securities and Exchange Commission. The forward-looking statements included herein are made only as of the date hereof, and we specifically disclaim any obligation to update these statements in the future.
Note on Forward-Looking Non-GAAP Measures
The company does not reconcile its forward-looking non-GAAP financial measures to the corresponding U.S. GAAP measures, due to the variability and difficulty in making accurate forecasts and projections and because not all of the information necessary for a quantitative reconciliation of these forward-looking non-GAAP financial measures (such as the effect of share-based compensation or the impact of future extraordinary or non-recurring events like acquisitions) is available to the company without unreasonable effort. For the same reasons, the company is unable to estimate the probable significance of the unavailable information. The company provides forward-looking non-GAAP financial measures that it believes will be achievable, but it cannot accurately predict all of the components of the adjusted calculations, and the U.S. GAAP financial measures may be materially different than the non-GAAP financial measures.
Investor Contacts:
Lynn Morgen, ADVISIRY PARTNERS, lynn.morgen@advisiry.com +1.212.750.5800
David Gold, ADVISIRY PARTNERS, david.gold@advisiry.com +1.212.750.5800
Company Information Contact:
Lauren Dyke, ICF, lauren.dyke@ICF.com +1.571.373.5577
ICF International, Inc. and Subsidiaries
Consolidated Statements of Comprehensive Income
(Unaudited)
Three Months Ended
Nine Months Ended
September 30,
September 30,
(in thousands, except per share amounts)
2026
2025
2026
2025
Revenue
$ 470,497
$ 465,405
$ 1,382,492
$ 1,429,178
Direct Costs
291,310
290,545
859,803
891,512
Operating costs and expenses:
Indirect and selling expenses
125,632
122,261
367,787
377,169
Depreciation and amortization
9,908
14,168
36,512
43,665
Total operating costs and expenses
135,540
136,429
404,299
420,834
Operating income
43,647
38,431
118,390
116,832
Interest, net
(6,372)
(7,861)
(19,846)
(23,620)
Other income (expense)
58
176
(1,041)
(2,515)
Income before income taxes
37,333
30,746
97,503
90,697
Provision for income taxes
5,600
6,980
18,300
16,419
Net income
$ 31,733
$ 23,766
$ 79,203
$ 74,278
Earnings per Share:
Basic
$ 1.77
$ 1.29
$ 4.38
$ 4.03
Diluted
$ 1.76
$ 1.28
$ 4.36
$ 4.01
Weighted-average Shares:
Basic
17,939
18,432
18,063
18,447
Diluted
18,055
18,526
18,174
18,542
Cash dividends declared per common share
$ 0.14
$ 0.14
$ 0.42
$ 0.42
Other comprehensive income (loss), net of tax
3,299
(1,733)
3,908
1,712
Comprehensive income, net of tax
$ 35,032
$ 22,033
$ 83,111
$ 75,990
ICF International, Inc. and Subsidiaries
Reconciliation of Non-GAAP financial measures (2)
(Unaudited)
Three Months Ended
Nine Months Ended
September 30,
September 30,
(in thousands, except per share amounts)
2026
2025
2026
2025
Reconciliation of EBITDA and Adjusted EBITDA (3)
Net income
$ 31,733
$ 23,766
$ 79,203
$ 74,278
Interest, net
6,372
7,861
19,846
23,620
Provision for income taxes
5,600
6,980
18,300
16,419
Depreciation and amortization
9,908
14,168
36,512
43,665
EBITDA
53,613
52,775
153,861
157,982
Acquisition and divestiture-related expenses (4)
290
25
984
479
Severance and other costs related to staff realignment (5)
255
359
614
2,909
Charges and adjustments related to facility consolidations and office closures (6)
11
—
983
(138)
Total Adjustments
556
384
2,581
3,250
Adjusted EBITDA
$ 54,169
$ 53,159
$ 156,442
$ 161,232
Net Income Margin Percent on Revenue (7)
6.7 %
5.1 %
5.7 %
5.2 %
EBITDA Margin Percent on Revenue (8)
11.4 %
11.3 %
11.1 %
11.1 %
Adjusted EBITDA Margin Percent on Revenue (8)
11.5 %
11.4 %
11.3 %
11.3 %
Reconciliation of Non-GAAP Diluted EPS (3)
U.S. GAAP Diluted EPS
$ 1.76
$ 1.28
$ 4.36
$ 4.01
Acquisition and divestiture-related expenses
0.02
—
0.05
0.02
Severance and other costs related to staff realignment
0.01
0.02
0.02
0.16
Charges and adjustments related to facility consolidations and office closures
—
—
0.06
(0.01)
Amortization of intangible assets acquired in business combinations (9)
0.23
0.49
1.07
1.50
Income tax effects of the adjustments (10)
(0.04)
(0.12)
(0.22)
(0.38)
Non-GAAP Diluted EPS
$ 1.98
$ 1.67
$ 5.34
$ 5.30
(2) These tables provide reconciliations of Non-GAAP financial measures to the most applicable U.S. GAAP numbers. While we believe that these Non-GAAP financial measures may be useful in evaluating our financial information, they should be considered supplemental in nature and not as a substitute for financial information prepared in accordance with U.S. GAAP. Other companies may define similarly titled Non-GAAP measures differently and, accordingly, care should be exercised in understanding how we define these measures.
(3) Reconciliations of EBITDA, Adjusted EBITDA, and Non-GAAP Diluted EPS were calculated using numbers as reported in U.S. GAAP.
(4) These are primarily third-party costs related to potential and/or closed acquisitions and integration of closed acquisitions.
(5) These costs are due to involuntary employee termination benefits for (i) our officers and (ii) a group of employees who have been notified that they will be terminated as part of a business reorganization or exit.
(6) These charges and adjustments are related to previously exited leased facilities and the closure of certain international offices.
(7) Net Income Margin Percent on Revenue was calculated by dividing net income by revenue.
(8) EBITDA Margin Percent and Adjusted EBITDA Margin Percent on Revenue were calculated by dividing the Non-GAAP measure by the corresponding revenue.
(9) The amortization of intangible assets acquired from business combinations totaled $4.2 million and $9.2 million for the three months ended September 30, 2026 and 2025, respectively, and $19.4 million and $27.9 million for the nine months ended September 30, 2026 and 2025, respectively.
(10) Income tax effects were calculated using the effective tax rate, adjusted for certain discrete items, if any, of 15.0% and 22.7% for the three months ended September 30, 2026 and 2025, respectively, and 18.8% and 23.0% for the nine months ended September 30, 2026 and 2025, respectively.
ICF International, Inc. and Subsidiaries
Consolidated Balance Sheets
September 30, 2026
December 31, 2025
(in thousands, except share amounts)
(Unaudited)
ASSETS
Cash and cash equivalents
$ 5,138
$ 5,297
Restricted cash
89,955
47,984
Accounts receivable, net
229,810
237,996
Contract assets
213,384
186,684
Prepaid expenses and other current assets
28,273
18,390
Income tax receivable
20,656
18,087
Total Current Assets
587,216
514,438
Property and equipment, net
52,057
58,357
Goodwill
1,251,534
1,252,207
Other intangible assets, net
65,329
81,555
Operating lease – right-of-use assets
98,489
106,274
Other assets
47,257
37,340
Total Assets
$ 2,101,882
$ 2,050,171
LIABILITIES AND STOCKHOLDERS’ EQUITY
Accounts payable
$ 90,814
$ 123,524
Contract liabilities
39,361
43,444
Lease liabilities – current
18,137
21,491
Accrued salaries and benefits
88,629
95,578
Accrued subcontractors and other direct costs
59,659
48,900
Accrued expenses and other current liabilities
121,879
71,340
Total Current Liabilities
418,479
404,277
Debt
372,122
401,355
Lease liabilities – non-current
136,097
148,493
Deferred income taxes
29,928
6,837
Other long-term liabilities
58,874
60,727
Total Liabilities
1,015,500
1,021,689
Commitments and Contingencies
Stockholders’ Equity:
Preferred stock, par value $.001; 5,000,000 shares authorized; none issued
—
—
Common stock, par value $.001; 70,000,000 shares authorized; 24,560,674 and 24,378,749 shares
issued at September 30, 2026 and December 31, 2025, respectively; 17,942,455 and 18,247,837
shares outstanding at September 30, 2026 and December 31, 2025, respectively
25
24
Additional paid-in capital
481,249
465,779
Retained earnings
1,027,716
956,077
Treasury stock, 6,618,219 and 6,130,912 shares at September 30, 2026 and December 31, 2025,
respectively
(413,088)
(379,970)
Accumulated other comprehensive loss
(9,520)
(13,428)
Total Stockholders’ Equity
1,086,382
1,028,482
Total Liabilities and Stockholders’ Equity
$ 2,101,882
$ 2,050,171
ICF International, Inc. and Subsidiaries
Consolidated Statements of Cash Flows
(Unaudited)
Nine Months Ended
September 30,
(in thousands)
2026
2025
Cash Flows from Operating Activities
Net income
$ 79,203
$ 74,278
Adjustments to reconcile net income to net cash provided by operating activities:
Provision for (recovery of) credit losses
458
(305)
Deferred income taxes and unrecognized income tax benefits
18,882
20,186
Non-cash equity compensation
13,314
12,915
Depreciation and amortization
36,512
43,665
Other operating adjustments, net
1,932
3,837
Changes in operating assets and liabilities, net of the effects of acquisitions:
Net contract assets and liabilities
(32,368)
(22,676)
Accounts receivable
7,334
26,829
Prepaid expenses and other current assets
(7,996)
(2,470)
Operating lease assets and liabilities, net
(6,197)
(6,774)
Accounts payable
(32,460)
(21,099)
Accrued salaries and benefits
(6,773)
(22,143)
Accrued subcontractors and other direct costs
11,405
(25)
Accrued expenses and other current liabilities
50,598
(9,804)
Income tax receivable and payable
(2,583)
(30,566)
Other liabilities
487
396
Net Cash Provided by Operating Activities
131,748
66,244
Cash Flows from Investing Activities
Payments for purchase of property and equipment and capitalized software
(14,080)
(14,745)
Other investing, net
(322)
403
Net Cash Used in Investing Activities
(14,402)
(14,342)
Cash Flows from Financing Activities
Advances from Credit Facility
1,191,161
1,048,671
Payments on Credit Facility
(1,220,728)
(1,011,838)
Other short-term borrowings, net
295
(5,822)
Dividends paid
(7,605)
(7,775)
Stock repurchases
(33,118)
(42,036)
Issuance of common stock under employee stock purchase plan
2,156
2,524
Payments of debt issuance costs
(4,442)
—
Repayment of finance lease obligations
(2,020)
(1,950)
Net Cash Used in Financing Activities
(74,301)
(18,226)
Effect of Exchange Rate Changes on Cash, Cash Equivalents, and Restricted Cash
(183)
1,433
Net Change in Cash, Cash Equivalents, and Restricted Cash
42,862
35,109
Cash, Cash Equivalents, and Restricted Cash, Beginning of Period
56,324
18,817
Cash, Cash Equivalents, and Restricted Cash, End of Period
$ 99,186
$ 53,926
Supplemental Disclosure of Cash Flow Information
Cash paid during the period for:
Interest
$ 17,948
$ 20,045
Income tax payments, net of refunds
$ 2,575
$ 27,431
ICF International, Inc. and Subsidiaries
Supplemental Schedule (11)
Revenue by client market
Three Months Ended
Nine Months Ended
September 30,
September 30,
2026
2025
2026
2025
Energy, environment, infrastructure, and disaster recovery
54 %
53 %
53 %
51 %
Health and social programs
32 %
33 %
33 %
34 %
Security and other civilian & commercial
14 %
14 %
14 %
15 %
Total
100 %
100 %
100 %
100 %
Revenue by client type
Three Months Ended
Nine Months Ended
September 30,
September 30,
2026
2025
2026
2025
U.S. federal government
41 %
43 %
40 %
45 %
U.S. state and local government
18 %
17 %
18 %
17 %
International government
7 %
6 %
8 %
6 %
Total Government
66 %
66 %
66 %
68 %
Commercial
34 %
34 %
34 %
32 %
Total
100 %
100 %
100 %
100 %
Revenue by contract mix
Three Months Ended
Nine Months Ended
September 30,
September 30,
2026
2025
2026
2025
Time-and-materials
44 %
44 %
44 %
44 %
Fixed-price
50 %
49 %
50 %
49 %
Cost-based
6 %
7 %
6 %
7 %
Total
100 %
100 %
100 %
100 %
(11) As is shown in the supplemental schedule, we track revenue by key metrics that provide useful information about the nature of our operations. Client market provide insight into the breadth of our expertise. Client type is an indicator of the diversity of our client base. Revenue by contract mix provides insight in terms of the degree of performance risk that we have assumed.
View original content to download multimedia:https://www.prnewswire.com/news-releases/icf-reports-third-quarter-2026-results-302931259.html
SOURCE ICF

Residences at the Stoneleigh Celebrates Forbes Travel Guide VERIFIED™ Luxury Residences Recognition

Tucows Reports Third Quarter Results In Line with Expectations with Progress on Balance Sheet Obligations
Greenlane Renewables Announces Third Quarter 2026 Financial Results

Send Rakhi to UK swiftly with UK Gifts Portal

Whiteboard Series with NEAR | Ep: 45 Joel Thorstensson from ceramic.network

Nullmax and Renesas Forge Strategic Partnership to Deliver Competitive ADAS Solutions for the Global Market

Why You Should Build on #NEAR – Co-founder Illia Polosukhin at CV Labs
Whiteboard Series with NEAR | Ep: 45 Joel Thorstensson from ceramic.network

NEAR End of Year Town Hall 2021: The Open Web World, MetaBUILD 2 Hackathon and 2021 recap
Trending
-

 Technology5 days ago
From IFA Berlin to CES 2027: OlloBot Continues Its Journey in Emotional Companionship
-

 Technology5 days ago
Context Labs AI Distillery™ Lets Enterprises Run Sovereign AI on Data They Own
-

 Technology5 days ago
A new way to explore Japan with AI: Naviu AR Travel Companion for Japan Launches November 1 2026
-

 Coin Market4 days ago
Binance net outflows surge to $5.8B as withdrawals resume after record hack
-

 Coin Market4 days ago
THORChain halts swaps after block reorg bug, slowing Binance hackers
-
 Technology4 days ago
RD Technologies Upgrades Its Cross-Border Payments and Digital Finance Ecosystem
-

 Technology4 days ago
Thunes and UnionPay International Transform Payments to China’s Mainland, Launching High-Capacity Instant Payouts
-
 Technology3 days ago
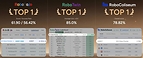
AGIBOT Unveils GO-3 Preview, Takes Top Spot on Three Embodied AI Benchmarks