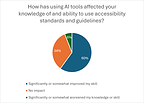
Connect with us

Technology

Zoomcar Reports its Fiscal Third Quarter Financial 2024 Results

Published

on

Contribution Profit continues to increase in FQ3, reaching all time high

Bookings growth of 19% vs prior year

Achieved record Repeat User Rates and High Quality Host Retention Rates

Debt restructuring under way

BANGALORE, India, Feb. 14, 2025 /PRNewswire/ — Zoomcar Holdings, Inc. (Nasdaq: ZCAR) (“Zoomcar,” or “we,” or “our”), the leading marketplace for car sharing in India, today announced results for its fiscal third quarter ended December 31, 2024.

Hiroshi Nishijima, CEO of Zoomcar stated,. “We’re seeing the improvements we’ve made in the customer experience bearing fruit, with repeat users doubling this quarter, high quality Host retention rates continuing to rise, and contribution profit reaching an all time high in FQ3. Combining a greater customer experience and our efforts to increase supply, the number of Hosts on our platform continues to increase along with high quality Host retention. These improvements enable us to continue optimizing our marketing spend, and, in addition to other cost reduction projects, have led to achieving record contribution profit this quarter, making this the fifth consecutive quarter of positive contribution profit.”

Key Highlights:

Contribution profit reached a record high of $1.28 million (52% of revenue), a significant improvement from $0.21 million (9% of revenue) in the same quarter last year, and was $1.21 million (54% of revenue) in the previous quarter.  This is the fifth consecutive quarter of positive contribution profit. On a per booking basis, our Contribution profit increased to $12.39 during the three months ended December 31, 2024 as compared to $2.40 per booking during the three months ended December 31, 2023.The number of bookings rose by 19%, from 86,917 in the prior year period to 103,599, during  the three months ended December 31, 2024, driven by 2.0x increase in the repeat user booking rate.Cost optimization efforts resulted in a 28% reduction in Cost of Revenue, a 41% reduction in technology expenses (such as cloud services and tech vendor related expenses), and an 80% decrease in marketing costs. All reductions are a comparison of the three months ended December 31, 2024 vs the same period last year.Adjusted EBITDA loss decreased significantly from $10.17 million during the three months ended December 31, 2023 to $3.15 million during the three months ended December 31, 2024.Average Guest trip ratings saw a significant improvement, rising from 4.16 (out of 5) on March 31, 2024, to 4.70 on December 31, 2024, reflecting our ongoing commitment to enhancing the customer experience.Active high quality cars (with an average rating of more than 4.5 out of 5) increased by 24% from 5,830 cars at the end of September 30, 2024  to 7,247 cars  as on  December 31, 2024, signaling the improvement of Host retention rate.

We will dive deeper into the results during our FQ3 2024 Earnings call:
We would like to invite all shareholders to our FQ3 2024 Earnings Call, scheduled for February 14, 2025, at 8:00 AM Eastern Time. Please register through this link – https://us06web.zoom.us/meeting/register/usrVrgzlTjCS72sQkjwV8w 

For more details, you may access the Q3 earnings presentation and other materials found on our Investor Relations website at https://investor-relations.zoomcar.com/in/.

About Zoomcar:

Founded in 2013 and headquartered in Bengaluru, India, Zoomcar is a leading marketplace for car sharing focused in India. The Zoomcar community connects Hosts with Guests, who choose from a selection of cars for use at affordable prices, promoting sustainable, smart transportation solutions in India.

Forward Looking Statement:

Certain statements contained in this press release are not historical facts and may be forward-looking statements within the meaning of the Private Securities Litigation Reform Act of 1995. Words such as “plans,” “expects,” “believes,” “anticipates,” and similar words are intended to identify forward-looking statements. These forward-looking statements include, but are not limited to, statements concerning our expected revenue growth and improved profitability, and our financial forecasts. Forward-looking statements are based on our current expectations and beliefs, and involve a number of risks and uncertainties that are difficult to predict and that could cause actual results to differ materially from those stated or implied by the forward-looking statements. A description of certain of these risks, uncertainties and other matters can be found in filings we make with the U.S. Securities and Exchange Commission, all of which are available at www.sec.gov. Because forward-looking statements involve risks and uncertainties, actual results and events may differ materially from results and events currently expected by us, readers are cautioned not to place undue reliance on these forward-looking statements, which speak only as of the date hereof. We undertake no obligation to publicly update these forward-looking statements to reflect events or circumstances that occur after the date hereof or to reflect any change in its expectations with regard to these forward-looking statements or the occurrence of unanticipated events.

Non-GAAP Financial Measure:

To supplement our financial statements, which are presented on the basis of U.S. generally accepted accounting principles (GAAP), the following non-GAAP measures of financial performance are included in this release: contribution margin, and adjusted EBITDA. A reconciliation of GAAP to adjusted non-GAAP financial measures is included as an attachment to this press release. We believe these non-GAAP financial measures are useful to investors in assessing our operating performance. We use these financial measures internally to evaluate our operating performance and for planning and forecasting of future periods. We also believe it is in the best interests of investors to provide this non-GAAP information. While we believe these non-GAAP financial measures provide useful supplemental information to investors, there are limitations associated with the use of these non-GAAP financial measures. These non-GAAP financial measures may not be reported by competitors, and they may not be directly comparable to similarly titled measures of other companies due to differences in calculation methodologies. The non-GAAP financial measures are not an alternative to GAAP information and are not meant to be considered in isolation or as a substitute for comparable GAAP financial measures. They should be used only as a supplement to GAAP information and should be considered only in conjunction with our consolidated financial statements prepared in accordance with GAAP.

Reconciliation of GAAP to Non-GAAP Metrics

The following is the reconciliation of adjusted EBITDA to the most comparable GAAP measure for three months and nine months ending December 31, Net Loss.

Three months ended December 31,

Nine months ended December 31,

2024

2023

2024

2023

Net (Loss) / Income

$          (6,061,727)

$     14,425,439

$        (11,945,281)

$  (26,757,978)

Add/ (deduct)

Stock-based compensation

1,265,828

1,883,733

Depreciation and amortization

90,522

244,053

305,658

754,660

Finance costs

4,866,242

8,392,470

6,942,547

13,628,832

Finance costs to related parties

12,426

38,203

Other income, net

(1,917,896)

(34,503,014)

(2,705,019)

(10,377,735)

Other income from related parties

(5,548)

(11,224)

Gain on troubled debt restructuring

(124,299)

(476,746)

Adjusted EBITDA

$          (3,147,158)

$   (10,168,346)

$          (7,878,841)

$  (20,841,509)

Adjusted EBITDA is a non-GAAP financial measure that represents our net income or loss adjusted for (i) provision for income taxes; (ii) other income and (expense), net; (iii) depreciation and amortization; (iv) stock-based compensation expense; (v) finance costs; and (vi) Gain on troubled debt restructuring.

Contribution Profit/(Loss)

The following is the calculation of Contribution Profit/(Loss) to the most comparable GAAP measure for three months and nine months ending December 31 Net Revenue.

Three months ended December 31,

Nine months ended December 31,

2024

2023

2024

2023

Net revenue

$           2,449,368

$        2,421,438

$            6,937,250

$       7,717,064

Cost of revenue

1,499,282

2,093,057

4,224,993

8,441,525

Gross Profit/(Loss)

950,086

328,381

2,712,257

(724,461)

Add: Depreciation and amortization in COR

73,683

205,260

222,862

624,630

Add: Stock-based compensation in COR

51,848

134,883

Add: Overhead costs in COR  (rent, software
support, insurance, travel)

286,639

249,651

636,960

988,946

Less: Host Incentives and Marketing costs
(excl. brand marketing)

26,414

626,267

621,158

2,104,360

Less: Host incentives

32,800

73,216

110,664

348,261

Less: Marketing costs (excl. brand marketing)

(6,386)

553,051

510,494

1,756,099

Contribution Profit / (Loss)

$           1,283,994

$           208,873

$           2,950,921

$           (1,080,363)

Contribution margin

52 %

9 %

43 %

-14 %

We define contribution profit (loss) as our gross profit plus (a) depreciation expense included in cost of revenue, (b) stock-based compensation expense included in cost of revenue, (c) other general costs included in cost of revenue (rent, software support, insurance, travel); less (i) Host incentive payments and (ii) marketing and promotional expenses (excluding brand marketing).

Logo – https://mma.prnewswire.com/media/2517562/5014195/Zoomcar_Logo.jpg

Contact: 
Akarshit Gulati: akarshitg@avianwe.com 
Bhagyashree Rewatkar: bhagyashree.rewatkar@zoomcar.com

View original content:https://www.prnewswire.com/news-releases/zoomcar-reports-its-fiscal-third-quarter-financial-2024-results-302377136.html

SOURCE Zoomcar

Continue Reading
Click to comment

Leave a Reply

Your email address will not be published. Required fields are marked *

Technology

BOE continues to launch new products and solutions in the field of high-end displays

Published

on

By

LOS ANGELES, May 9, 2026 /PRNewswire/ — 

1、Redefine Visual Experience with Scientific Standards! BOE Releases Core Research Findings on OLED Display Clarity-Legibility Index, Paving the Way for the Industry’s First Transparent Pro Standard to Deliver Supreme Visual Experience

With the rapid popularization of OLED display technology, basic screen indicators including resolution, color gamut and brightness keep improving. Meanwhile, display transparency — a core experience metric that determines visual comfort , image authenticity and premium visual quality — has drawn growing attention across the industry.

Recently, BOE has empowered the launch of the industry’s first flagship high-transparency OLED display panel, setting an industry-leading benchmark in four key dimensions: color, depth , clarity and dynamic range. It ushers high-end display into a new era, shifting from purely numerical technical specifications to ultimate user-centric visual experience.

In addition, BOE officially unveiled its in-depth research achievements on OLED display transparency. It has identified the core underlying factors affecting visual transparency through scientific research, pioneered the industry’s first display transparency index formula, and facilitated the release of the first authoritative evaluation standard for OLED display transparency. This marks an industry’s transformation from specs-oriented to experience-driven development. This marks a full-process breakthrough covering underlying technical analysis, scientifically guided image quality development and mass production application.

At present, the group standard 《Standard of Associations Organic light emitting diode display —Evaluation method for display clarity》, led and formulated by BOE based on relevant research outcomes, has been officially issued. As the world’s first dedicated evaluation standard focusing on OLED display transparency, it fills the long-standing industry gap in correlating subjective visual perception with objective image quality parameters.

Leveraging this standard and transparency research results, BOE has assisted partners in developing the industry’s first flagship high-transparency OLED screen. The company has built a comprehensive technical system for OLED visual transparency. Supported by cutting-edge technologies such as tandem, LTPO and high-precision Demura crosstalk optimization algorithms, BOE and its partners have carried out full-link optimization from display panels to end devices.

Going forward, BOE will continue to deepen research on display human factors engineering and visual experience. Through technological innovation and standard leadership, it will bring more ultimate, high-transparency premium display experiences to users worldwide.

2、BOE Beneficial “Natural” Light Technology (BNL): Solving Visual Health Pain Points and Leading the Display Industry Trend

In an era of ubiquitous displays, users are spending increasingly longer hours on screens. Nevertheless, the luminous properties of conventional displays poorly align with the human visual system, sparking widespread consumer concerns over visual health. To address such challenges, BOE draws inspiration from natural light. By deeply analyzing natural light and extracting beneficial features highly consistent with health and comfort, BOE established the Beneficial “Natural” Light Technology (BNL) architecture. Evolving from single technical upgrades to a systematic solution, BNL replicates the merits of natural light across four core dimensions: Depolarization Adjustment, Spectrum Optimization, Light Profile Optimization and Time-varying Adaptation, advancing display technology toward healthy viewing.

BNL & Visual Health

Depolarization Adjustment: The linearly polarized light of traditional displays causes targeted stimulation to retinal lutein, resulting in dry eyes, eyelid redness and other discomforts. Based on the mainstream Circular Polarization (QWP) solution, BOE BNL has developed a series of technologies like BSF/RDF Random Depolarization technology and un-Polarization,which convert linearly polarized light into randomly polarized light, enabling balanced lutein utilization across the entire visual field, and deliver natural-light-level eye protection.

Spectrum Optimization: Conventional narrow-band RGB spectra feature poor continuity and imbalanced energy distribution, with excessive high-energy blue light that induces eye strain and increases risks of macular damage. Beyond Low Blue Light solutions, BOE BNL has developed Natural-like Spectrum, Beneficial Red Light, Infrared Light and Circadian Rhythm technologies. Multiple clinical studies have verified that Beneficial Red Light and Infrared Light can effectively inhibit axial elongation and accelerate eye microcirculation.  BOE takes the lead in integrating such optics into displays,achieving a spectral distribution matching degree of over 60%, an energy ratio of Beneficial Red Light (650–670 nm) exceeding 50%, and independent on/off switching and energy adjustment of Infrared Light. Meanwhile, Circadian Rhythm technology regulates melatonin secretion to safeguard sleep quality. Shifting from passive harm reduction to active eye benefits, BOE BNL delivers all-round visual health protection.

Light Profile Optimization: Conventional screens are prone to surface reflection and glare, which interfere with visual recognition and cause cumulative eye fatigue. Powered by industry-leading Anti-Glare, Low Reflection and Wide Viewing Angle technologies, BOE BNL accurately simulates the diffuse reflection of natural light to deliver consistent visual comfort across diverse viewing angles. For instance, BOE UB Cell technology achieves a DGR value below 5 with negligible glare and reflection, ensuring sustained visual comfort.

Time-varying Adaptation: Conventional displays tend to produce low-frequency flicker and fixed brightness and color temperature that fail to adapt to ambient changes, forcing frequent eye muscle adjustments and leading to discomfort. By adopting Flicker Free and Light Self-adaptive technologies, BOE BNL delivers stable, ultra-smooth visuals that replicate the comfort of natural light.

SID 2026: BOE Launches New BNL Display Products

At SID Display Week 2026, BOE launched new BNL health display products. The highlight product is the industry’s first 13.8-inch BNL health display tablet. It integrates all four core dimensions,supported by 7 core BNL technologies, to deliver a healthy and comfortable visual experience.

As a global leader in the display industry, BOE has led the development and officially issued the world’s first “Natural Light” display standard via the Zhongguancun Standardization Association,and has jointly issued the White Paper on Natural Light Display Technologies (Engineering Considerations, Application Value and Challenges) with TÜV Rheinland to drive standardized and high-quality industrial development. In the future, BOE will continue to iterate on technologies, diversify product forms and application scenarios, advance the grading standards for Beneficial “Natural” Light displays, and protect users’ visual health.

View original content to download multimedia:https://www.prnewswire.com/news-releases/boe-continues-to-launch-new-products-and-solutions-in-the-field-of-high-end-displays-302767491.html

SOURCE BOE Technology Group Co., Ltd.

Continue Reading

Technology

BitradeX BXC First Two Subscription Rounds Sell Out, Total Subscriptions Exceed 14M USDT

Published

on

By

LONDON, May 9, 2026 /PRNewswire/ — BitradeX Capital’s ecosystem equity token, BXC, has completed its first and second subscription rounds, selling a total of 50 million BXC with subscriptions exceeding 14 million USDT. The first round sold out in 90 seconds, while the second closed within 48 hours.

While the fundraising size is not unusually large by crypto standards, the structure of the sale has attracted market attention. The first two rounds were not open to the public, but limited to high-tier BitradeX users. The first round was available only to V5 users and above, while the second round expanded access to V3 users and above.

According to BitradeX’s tier system, V3+ users typically have higher recurring investment activity through AiBot, longer platform usage history, and stronger ecosystem participation. This means the early BXC allocation was absorbed mainly by the platform’s internal high-value user base, rather than short-term speculative participants.

This approach differs from many token fundraising campaigns that prioritize broad public participation and market hype. BitradeX instead adopted a more selective, staged model, gradually lowering the participation threshold while keeping the sale within its active ecosystem community.

BXC is positioned as more than a standard platform token. Its value framework is linked to BitradeX Capital’s broader ecosystem, including its exchange business, AiBot quantitative strategies, BTX Card payments, and Labs incubation platform. Public information indicates that BXC holders may receive staking rewards, benefit from ecosystem buybacks and burns, and gain priority access to Launchpad projects and governance participation.

The third subscription round is launched on April 30 at $0.35 USDT per BXC, with a total supply of 100 million BXC. It is now open to users participating in AiBot recurring investment. The fourth round price is expected to rise to $0.45 USDT.

The long-term value of BXC will ultimately depend on the growth of BitradeX’s underlying businesses, including exchange profitability, AiBot user expansion, and BTX Card adoption. However, the rapid sellout of the first two rounds suggests that BitradeX’s core user base has already shown strong confidence in the ecosystem’s future.

View original content:https://www.prnewswire.com/news-releases/bitradex-bxc-first-two-subscription-rounds-sell-out-total-subscriptions-exceed-14m-usdt-302767467.html

SOURCE BitradeX Capital

Continue Reading

Technology

South and East Asia identified as hotspots of global warming related impacts on male fertility

Published

on

By

BEIJING, May 9, 2026 /PRNewswire/ — A major new study has shown that South and East Asia dominate patterns of global warming related decline in male fertility with the strongest and most consistent evidence coming from India, Pakistan and the southern parts of China.

The effects of increased environmental temperatures on male reproductive health include declining sperm concentration and motility and increased sperm DNA fragmentation, or genetic damage that can hinder fertilisation and embryo development.

Male related factors account for around 50 per cent of infertility cases around the world and the impact of rising ambient heat on semen parameters raises serious implications across wide areas of Asia where total fertility rates are in serious decline.

Outcomes of the study undertaken by the Taiwan IVF Group and Ton Yen General Hospital, Taiwan (China) in collaboration with Stanford University (USA) are being presented at the 2026 Congress of the Asia Pacific Initiative on Reproduction (ASPIRE) in Beijing.

Research principal and Adjunct Clinical Assistant Professor at Stanford University, Dr Jack Yu Jen Huang, MD, PhD, FACOG said: “Given the temperature sensitivity of spermatogenesis, even modest increases in ambient temperature could have cumulative, population-level effects over time.

“As global warming accelerates, male reproductive health may represent an emerging climate sensitive public health concern.”

The testes function optimally at temperatures lower than the internal body heat level, and previous studies have shown elevated scrotal or ambient temperatures can impair sperm production.

The latest research explored global patterns to reveal comparative data across regions. It is based on a systematic review of international studies on temperature exposure and semen parameter trends between 2000 and 2024. Artificial intelligence algorithms and machine learning tools were applied to extract key variables including geographic regions and semen outcomes.

Dr Huang said studies examining occupational heat exposure alone were excluded from the analysis as they reflected localised, job-specific conditions rather than broader climatic trends.

“Our findings therefore represent population level climate associated temperature effects including consistent seasonal variations showing poor semen quality parameters in warmer periods.”

The global patterns on temperature associated lower sperm concentration and motility show South and East Asia as major hot spots of concern followed by the Middle East, Europe and North America.

“South and East Asia are likely more affected due to a combination of factors including higher baseline ambient temperatures and rapid urbanisation that contribute to greater cumulative heat stress on spermatogenesis,” Dr Huang explained.

“With ongoing global warming, chronic heat exposure may increasingly impact male reproductive health.”

Dr Huang said potential approaches to address the issue include:

increasing public awareness of heat exposure and reproductive health;encouraging protective behaviours;expanding research integrating climate and reproductive health data; andexploring clinical and lifestyle interventions to mitigate heat-related effects.

The research team was assisted by research intern Jeffrey Zi Kang Huang from Taipei American School, particularly in the application of artificial intelligence in biomedical research including AI-assisted data analysis and pattern recognition across global datasets.

“Further longitudinal and mechanistic studies will be important to better define causality and guide interventions,” he added.

The ASPIRE Congress is being held at the China National Convention Centre in Beijing. More than 3,000 scientists, clinicians, nurses and counsellors in assisted reproduction from around the world are attending the Congress.

For further information, go to https://www.aspire2026.com


View original content to download multimedia:https://www.prnewswire.com/apac/news-releases/south-and-east-asia-identified-as-hotspots-of-global-warming-related-impacts-on-male-fertility-302767469.html

SOURCE ASPIRE

Continue Reading

Trending