
Technology
Hello Group Inc. Announces Unaudited Financial Results for the Fourth Quarter and Fiscal Year 2024

Published
1 year agoon
By

BEIJING, March 12, 2025 /PRNewswire/ — Hello Group Inc. (NASDAQ: MOMO) (“Hello Group” or the “Company”), a leading player in mainland China’s online social networking space, today announced its unaudited financial results for the fourth quarter and the full year ended December 31, 2024.
Fourth Quarter of 2024 Highlights
Net revenues decreased by 12.2% year over year to RMB2,636.5 million (US$361.2 million*) in the fourth quarter of 2024.Net income attributable to Hello Group Inc. decreased to RMB187.2 million (US$25.6 million) in the fourth quarter of 2024, from RMB452.5 million in the same period of 2023.Non-GAAP net income attributable to Hello Group Inc. (note 1) decreased to RMB230.5 million (US$31.6 million) in the fourth quarter of 2024, from RMB514.7 million in the same period of 2023.Diluted net income per American Depositary Share (“ADS”) was RMB1.05 (US$0.14) in the fourth quarter of 2024, compared to RMB2.32 in the same period of 2023.Non-GAAP diluted net income per ADS (note 1) was RMB1.30 (US$0.18) in the fourth quarter of 2024, compared to RMB2.63 in the same period of 2023.Monthly Active Users (“MAU”) on Tantan app were 10.8 million in December 2024, compared to 13.7 million in December 2023.For the Momo app total paying users was 5.7 million for the fourth quarter of 2024, compared to 7.4 million for the same period last year. Tantan had 0.9 million paying users for the fourth quarter of 2024 compared to 1.2 million from the year ago period.
Full Year 2024 Highlights
Net revenues decreased by 12.0% year over year to RMB10,563.0 million (US$1,447.1 million) for the full year of 2024.Net income attributable to Hello Group Inc. was RMB1,039.6 million (US$142.4 million) for the full year of 2024, compared to RMB1,957.6 million during the same period of 2023.Non-GAAP net income attributable to Hello Group Inc. (note 1) was RMB1,232.9 million (US$168.9 million) for the full year of 2024, compared to RMB2,224.7 million during the same period of 2023.Diluted net income per ADS was RMB5.57(US$0.76) for the full year of 2024, compared to RMB9.84 during the same period of 2023.Non-GAAP diluted net income per ADS (note 1) was RMB6.60(US$0.90) for the full year of 2024, compared to RMB11.17 during the same period of 2023.
“2024 was a year fraught with challenges and opportunities. Our team maneuvered through external uncertainties well and delivered satisfactory financial and operational results.” commented Yan Tang, Chairman and CEO of Hello Group. “Momo cash cow business continues to be productive, with an ecosystem that is healthier in comparison to the previous year. Our overseas business maintained its robust growth momentum and made more meaningful contributions to the group’s financial standing. This impels us to take bolder measures to propel growth and innovation in international markets in the future.”
* This press release contains translations of certain Renminbi amounts into U.S. dollars at specified rate solely for the convenience of readers. Unless otherwise noted, all translations from Renminbi to U.S. dollars, in this press release, were made at a rate of RMB7.2993 to US$1.00, the effective noon buying rate for December 31, 2024 as set forth in the H.10 statistical release of the Federal Reserve Board.
Fourth Quarter of 2024 Financial Results
Net revenues
Total net revenues were RMB2,636.5 million (US$361.2 million) in the fourth quarter of 2024, a decrease of 12.2% from RMB3,002.9 million in the fourth quarter of 2023.
Live video service revenues were RMB1,264.9 million (US$173.3 million) in the fourth quarter of 2024, a decrease of 17.0% from RMB1,523.9 million during the same period of 2023. The decrease was primarily attributable to our proactive operational adjustments to de-emphasize large scale competition events in the Momo app and a soft consumer sentiment in the current macro environment, and to a lesser degree, Tantan pivoting away from the less dating-centric live video service.
Value-added service revenues mainly include virtual gift revenues and membership subscription revenues. Total value-added service revenues were RMB1,326.8 million (US$181.8 million) in the fourth quarter of 2024, a decrease of 6.9% from RMB1,424.9 million during the same period of 2023. The decrease was primarily due to our product adjustments to improve Momo app’s ecosystem as well as the impact of the macro economy on consumer sentiment, and to a lesser extent, the decline in Tantan’s paying users which was in turn due to the decline in user base. The decrease was partially offset by the revenue growth from the new standalone apps.
Mobile marketing revenues were RMB43.6 million (US$6.0 million) in the fourth quarter of 2024, compared to RMB44.9 million during the same period of 2023.
Net revenues from the Momo segment decreased from RMB2,728.7 million in the fourth quarter of 2023 to RMB2,423.1 million (US$332.0 million) in the fourth quarter of 2024, primarily due to the decrease in net revenues from live video service and value-added service on Momo app. The decrease was partially offset by the revenue growth of the new standalone apps. Net revenues from the Tantan segment decreased from RMB272.2 million in the fourth quarter of 2023 to RMB213.4 million (US$29.2 million) in the fourth quarter of 2024, mainly due to the decrease in net revenues from live video service and value-added service.
Cost and expenses
Cost and expenses were RMB2,407.8 million (US$329.9 million) in the fourth quarter of 2024, a decrease of 1.0% from RMB2,431.8 million in the fourth quarter of 2023. The decrease was primarily attributable to: (a) a decrease in revenue sharing with broadcasters related to live video service on Momo app and Tantan app, and a decrease in revenue sharing with virtual gift recipients of virtual gift service on Momo app. The decrease was partially offset by an increase in revenue sharing with virtual gift recipients for new standalone apps; and (b) a decrease in salary expenses and share-based compensation expenses, due to our continuous optimization in personnel costs and the newly granted share options which had lower fair value. The decrease was partially offset by an increase of RMB 94.1 million (US$12.9 million) in production costs in connection with films.
Non-GAAP cost and expenses (note 1) were RMB2,364.6 million (US$323.9 million) in the fourth quarter of 2024, compared to RMB2,369.5 million during the same period of 2023.
Other operating income, net
Other operating income was RMB8.0 million (US$1.1 million) in the fourth quarter of 2024, compared to RMB30.8 million during the fourth quarter of 2023. The decrease was primarily due to reduced government incentives and input VAT super deduction in the fourth quarter of 2024.
Income from operations
Income from operations was RMB236.7 million (US$32.4 million) in the fourth quarter of 2024, compared to RMB602.0 million during the same period of 2023. Income from operations of the Momo segment was RMB226.4 million (US$31.0 million) in the fourth quarter of 2024, which decreased from RMB576.9 million in the fourth quarter of 2023. Income from operations of the Tantan segment was RMB11.1 million (US$1.5 million) in the fourth quarter of 2024, which decreased from RMB26.8 million in the fourth quarter of 2023.
Non-GAAP income from operations (note 1) was RMB279.9 million (US$38.4 million) in the fourth quarter of 2024, compared to RMB664.2 million during the same period of 2023. Non-GAAP income from operations of the Momo segment was RMB269.4 million (US$36.9 million) in the fourth quarter of 2024, which decreased from RMB638.9 million in the fourth quarter of 2023. Non-GAAP income from operations of the Tantan segment was RMB11.4 million (US$1.6 million) in the fourth quarter of 2024, compared to RMB27.0 million in the fourth quarter of 2023.
Income tax expenses
Income tax expenses were RMB89.5 million (US$12.3 million) in the fourth quarter of 2024, compared to RMB183.4 million in the fourth quarter of 2023. The decrease in income tax expenses was primarily due to the lower profit in the third quarter of 2024, and to a lesser extent, lower withholding tax rate due to our eligibility for a preferential tax rate since the beginning of the year.
Net income
Net income was RMB187.2 million (US$25.6 million) in the fourth quarter of 2024, compared to RMB452.5 million during the same period of 2023. Net income from the Momo segment was RMB176.3 million (US$24.2 million) in the fourth quarter of 2024, compared to RMB430.0 million in the same period of 2023. Net income from the Tantan segment was RMB11.8 million (US$1.6 million) in the fourth quarter of 2024, compared to RMB24.2 million in the fourth quarter of 2023.
Non-GAAP net income (note 1) was RMB230.5 million (US$31.6 million) in the fourth quarter of 2024, compared to RMB514.7 million during the same period of 2023. Non-GAAP net income from the Momo segment was RMB219.3 million (US$30.1 million) in the fourth quarter of 2024, which decreased from RMB492.1 million in the fourth quarter of 2023. Non-GAAP net income of the Tantan segment was RMB12.0 million (US$1.7 million) in the fourth quarter of 2024, compared to RMB24.4 million in the fourth quarter of 2023.
Net income attributable to Hello Group Inc.
Net income attributable to Hello Group Inc. was RMB187.2 million (US$25.6 million) in the fourth quarter of 2024, compared to RMB452.5 million during the same period of 2023.
Non-GAAP net income (note 1) attributable to Hello Group Inc. was RMB230.5 million (US$31.6 million) in the fourth quarter of 2024, compared to RMB514.7 million during the same period of 2023.
Net income per ADS
Diluted net income per ADS was RMB1.05 (US$0.14) in the fourth quarter of 2024, compared to RMB2.32 in the fourth quarter of 2023.
Non-GAAP diluted net income per ADS (note 1) was RMB1.30 (US$0.18) in the fourth quarter of 2024, compared to RMB2.63 in the fourth quarter of 2023.
Cash and cash flow
As of December 31, 2024, the Company’s cash, cash equivalents, short-term deposits, long-term deposits, short-term restricted cash and long-term restricted cash totaled RMB14,728.5 million (US$2,017.8 million), compared to RMB13,478.5 million as of December 31, 2023.
Net cash provided by operating activities in the fourth quarter of 2024 was RMB423.6 million (US$58.0 million), compared to RMB415.9 million in the fourth quarter of 2023.
Full Year 2024 Financial Results
Net revenues for the full year of 2024 were RMB10,563.0 million (US$1,447.1 million), a decrease of 12.0% from RMB12,002.3 million in the same period of 2023.
Net income attributable to Hello Group Inc. was RMB1,039.6 million (US$142.4 million) for the full year of 2024, compared to RMB1,957.6 million during the same period of 2023.
Non-GAAP net income attributable to Hello Group Inc. (note 1) was RMB1,232.9 million (US$168.9 million) for the full year of 2024, compared to RMB2,224.7 million during the same period of 2023.
Diluted net income per ADS was RMB5.57 (US$0.76) during the full year of 2024, compared to RMB9.84 in the same period of 2023.
Non-GAAP diluted net income per ADS (note 1) was RMB6.60 (US$0.90) during the full year of 2024, compared to RMB11.17 in the same period of 2023.
Net cash provided by operating activities was RMB1,640.0 million (US$224.7 million) during the full year of 2024, compared to RMB2,277.2 million in the same period of 2023.
Recent Development
Declaration of a special cash dividend
Hello Group’s board of directors has declared a special cash dividend in the amount of US$0.30 per ADS, or US$0.15 per ordinary share. The cash dividend will be paid on April 30, 2025 to shareholders of record at the close of business on April 11, 2025. The ex-dividend date will be April 11, 2025. The aggregate amount of cash dividends to be paid is approximately US$50 million, which will be funded by available cash on the Company’s balance sheet.
Share repurchase program
On June 7, 2022, Hello Group’s board of directors authorized a share repurchase program under which the Company may repurchase up to US$200 million of its shares up to June 6, 2024 (the “Share Repurchase Program”). On March 14, 2024, Hello Group’s board of directors approved to amend the Share Repurchase Program to (i) extend the term of the Share Repurchase Program up to June 30, 2026, and (ii) upsize the Share Repurchase Program to US$286.1 million. On March 12, 2025, Hello Group’s board of directors approved an additional amendment to the Share Repurchase Program, to (i) extend the term of the Share Repurchase Program up to March 31, 2027, and (ii) upsize the Share Repurchase Program by another $200 million, so that the Company is authorized to, from time to time, acquire up to an aggregate of US$486.1 million worth of its shares in the form of ADSs and/or the ordinary shares of the Company in the open market and through privately negotiated transactions, in block trades and/or through other legally permissible means, depending on market conditions and in accordance with applicable rules and regulations. As of March 12, 2025, after the upsizing of the Share Repurchase Program, the remaining size of the program is US$222 million.
As of March 12, 2025, the Company has repurchased 43.5 million ADSs for US$264.0 million on the open market under Share Repurchase Program announced on June 7, 2022 and amended on March 14, 2024, at an average purchase price of US$6.05 per ADS.
Business Outlook
For the first quarter of 2025, the Company expects total net revenues to be between RMB2.4 billion to RMB2.5 billion, representing a decrease of 6.3% to 2.4% year over year. This forecast reflects the Company’s current and preliminary views on the market and operational conditions, which are subject to change.
Note 1: Non-GAAP measures
To supplement our consolidated financial statements presented in accordance with U.S. generally accepted accounting principles (“GAAP”), we, Hello Group, use various non-GAAP financial measures that are adjusted from the most comparable GAAP results to exclude share-based compensation and amortization of intangible assets from business acquisitions, and such adjustments has no impact on income tax.
Reconciliations of our non-GAAP financial measures to our U.S. GAAP financial measures are shown in tables at the end of this earnings release, which provide more details about the non-GAAP financial measures.
Our non-GAAP financial information is provided as additional information to help investors compare business trends among different reporting periods on a consistent basis and to enhance investors’ overall understanding of the historical and current financial performance of our continuing operations and our prospects for the future. Our non-GAAP financial information should be considered in addition to results prepared in accordance with GAAP, but should not be considered a substitute for or superior to the GAAP results. In addition, our calculation of the non-GAAP financial measures may be different from the calculation used by other companies, and therefore comparability may be limited.
Our non-GAAP information (including non-GAAP cost and operating expenses, income from operations, net income, net income attributable to Hello Group Inc., and diluted net income per ADS) is adjusted from the most comparable GAAP results to exclude share-based compensation and amortization of intangible assets from business acquisitions, and such adjustments has no impact on income tax. A limitation of using these non-GAAP financial measures is that share-based compensation and amortization of intangible assets from business acquisitions have been and will continue to be for the foreseeable future significant recurring expenses in our results of operations. We compensate for such limitation by providing reconciliations of our non-GAAP measures to our U.S. GAAP measures. Please see the reconciliation tables at the end of this earnings release.
Conference Call
Hello Group’s management will host an earnings conference call on Wednesday, March 12, 2025, at 8:00 a.m. U.S. Eastern Time (8:00 p.m. Beijing / Hong Kong Time on March 12, 2025).
Participants can register for the conference call by navigating to:
https://s1.c-conf.com/diamondpass/10045617-nl4uc8.html.
Upon registration, each participant will receive details for the conference call, including dial-in numbers, conference call passcode and a unique access PIN. Please dial in 10 minutes before the call is scheduled to begin.
A telephone replay of the call will be available after the conclusion of the conference call through March 19, 2025. The dial-in details for the replay are as follows:
U.S. / Canada: 1-855-883-1031
Hong Kong: 800-930-639
Passcode: 10045617
Additionally, a live and archived webcast of the conference call will be available on the Investor Relations section of Hello Group’s website at https://ir.hellogroup.com.
About Hello Group Inc.
We are a leading player in mainland China’s online social networking space. Through Momo, Tantan and other properties within our product portfolio, we enable users to discover new relationships, expand their social connections and build meaningful interactions. Momo is a mobile application that connects people and facilitates social interactions based on location, interests and a variety of online recreational activities. Tantan, which was added into our family of applications through acquisition in May 2018, is a leading social and dating application. Tantan is designed to help its users find and establish romantic connections as well as meet interesting people. Starting from 2019, we have incubated a number of other new apps, such as Hertz, Soulchill, and Duidui, which target more niche markets and more selective demographics.
For investor and media inquiries, please contact:
Hello Group Inc.
Investor Relations
Phone: +86-10-5731-0538
Email: ir@hellogroup.com
Christensen
In China
Ms. Xiaoyan Su
Phone: +86-10-5900-1548
E-mail: Xiaoyan.Su@christensencomms.com
In U.S.
Ms. Linda Bergkamp
Phone: +1-480-614-3004
Email: linda.bergkamp@christensencomms.com
Safe Harbor Statement
This news release contains “forward-looking” statements within the meaning of Section 27A of the Securities Act of 1933, as amended, and Section 21E of the Securities Exchange Act of 1934, as amended, and as defined in the Private Securities Litigation Reform Act of 1995. These forward-looking statements include but are not limited to our management quotes, our financial outlook for the first quarter of 2025, as well as the amount of, timing, methods and funding sources for repurchases of our shares under the share repurchase program.
Our forward-looking statements are not historical facts but instead represent only our belief regarding expected results and events, many of which, by their nature, are inherently uncertain and outside of our control. Our actual results and other circumstances may differ, possibly materially, from the anticipated results and events indicated in these forward-looking statements. Announced results for the fourth quarter of 2024 are preliminary, unaudited and subject to audit adjustment. In addition, we may not meet our financial outlook for the first quarter of 2025 and may be unable to grow our business in the manner planned. We may also modify our strategy for growth. Moreover, there are other risks and uncertainties that could cause our actual results to differ from what we currently anticipate, including those relating to our ability to retain and grow our user base, our ability to attract and retain sufficiently trained professionals to support our operations, our ability to anticipate and develop new services and enhance existing services to meet the demand of our users or customers, the market price of the Company’s stock prevailing from time to time, the nature of other investment opportunities presented to the Company from time to time, the Company’s cash flows from operations, general economic conditions, and other factors. For additional information on these and other important factors that could adversely affect our business, financial condition, results of operations, and prospects, please see our filings with the U.S. Securities and Exchange Commission.
All information provided in this press release and in the attachments is as of the date of the press release. We undertake no obligation to update any forward-looking statement, whether as a result of new information, future events or otherwise, after the date of this release, except as required by law. Such information speaks only as of the date of this release.
Hello Group Inc.
Unaudited Condensed Consolidated Statement of Operations
(All amounts in thousands, except share and per share data)
Three months
Year
Ended December 31
Ended December 31
2023
2024
2024
2023
2024
2024
RMB
RMB
US$
RMB
RMB
US$
Net revenues:
Live video service
1,523,885
1,264,851
173,284
6,072,871
5,092,854
697,718
Value-added service
1,424,893
1,326,764
181,766
5,752,571
5,322,726
729,210
Mobile marketing
44,915
43,630
5,977
133,677
142,950
19,584
Mobile games
5,441
–
–
19,610
432
59
Other services
3,798
1,251
171
23,594
4,009
550
Total net revenues
3,002,932
2,636,496
361,198
12,002,323
10,562,971
1,447,121
Cost and expenses:
Cost of revenues
(1,770,117)
(1,724,821)
(236,300)
(7,025,394)
(6,447,341)
(883,282)
Research and development
(231,445)
(222,684)
(30,508)
(884,590)
(804,425)
(110,206)
Sales and marketing
(304,696)
(316,699)
(43,388)
(1,414,949)
(1,329,780)
(182,179)
General and administrative
(125,498)
(143,621)
(19,676)
(502,479)
(507,658)
(69,549)
Total cost and expenses
(2,431,756)
(2,407,825)
(329,872)
(9,827,412)
(9,089,204)
(1,245,216)
Other operating income, net
30,821
8,015
1,098
130,105
59,003
8,083
Income from operations
601,997
236,686
32,424
2,305,016
1,532,770
209,988
Interest income
124,354
124,045
16,994
436,253
510,964
70,002
Interest expense
(20,552)
(36,846)
(5,048)
(62,223)
(127,846)
(17,515)
Other gain or loss, net
(31,250)
(46,639)
(6,390)
(26,685)
(90,509)
(12,400)
Income before income tax and share of (loss) income on equity
method investments
674,549
277,246
37,980
2,652,361
1,825,379
250,075
Income tax expenses
(183,377)
(89,497)
(12,261)
(630,023)
(845,022)
(115,768)
Income before share of (loss) income on equity method
investments
491,172
187,749
25,719
2,022,338
980,357
134,307
Share of (loss) income on equity method investments
(38,703)
(514)
(70)
(70,643)
59,216
8,113
Net income
452,469
187,235
25,649
1,951,695
1,039,573
142,420
Less: net loss attributable to non-controlling interest
–
–
–
(5,886)
–
–
Net income attributable to the shareholders of Hello Group Inc.
452,469
187,235
25,649
1,957,581
1,039,573
142,420
Net income per share attributable to ordinary shareholders
Basic
1.20
0.54
0.07
5.18
2.81
0.39
Diluted
1.16
0.53
0.07
4.92
2.78
0.38
Weighted average shares used in calculating net income per ordinary
share
Basic
376,317,036
349,401,183
349,401,183
377,639,399
369,312,997
369,312,997
Diluted
390,956,175
355,325,921
355,325,921
401,833,328
373,591,974
373,591,974
Hello Group Inc.
Unaudited Condensed Consolidated Statement of Comprehensive Income
(All amounts in thousands, except share and per share data)
Three months
Year
Ended December 31
Ended December 31
2023
2024
2024
2023
2024
2024
RMB
RMB
US$
RMB
RMB
US$
Net income
452,469
187,235
25,649
1,951,695
1,039,573
142,420
Other comprehensive (loss) income, net of tax:
Foreign currency translation adjustment
(95,774)
322,935
44,242
20,414
132,248
18,118
Comprehensive income
356,695
510,170
69,891
1,972,109
1,171,821
160,538
Less: comprehensive (loss) income attributed to the non-controlling
interest
(5,020)
7,225
990
357
5,111
700
Comprehensive income attributable to Hello Group Inc.
361,715
502,945
68,901
1,971,752
1,166,710
159,838
Hello Group Inc.
Unaudited Condensed Consolidated Balance Sheets
(All amounts in thousands, except share and per share data)
December 31
December 31
December 31
2023
2024
2024
RMB
RMB
US$
Assets
Current assets
Cash and cash equivalents
5,620,466
4,122,659
564,802
Short-term deposits
1,270,626
2,026,245
277,594
Restricted cash
10,147
4,566,477
625,605
Accounts receivable, net of allowance for doubtful accounts of
RMB12,780 and RMB12,433 as of December 31, 2023 and 2024,
respectively
201,517
192,317
26,347
Amounts due from related parties
7,258
–
–
Prepaid expenses and other current assets
723,364
1,104,172
151,271
Total current assets
7,833,378
12,011,870
1,645,619
Long-term deposits
3,924,975
3,059,860
419,199
Long-term restricted cash
2,652,299
953,285
130,600
Right-of-use assets, net
109,572
252,169
34,547
Property and equipment, net
659,033
897,036
122,893
Intangible assets, net
17,086
86,661
11,873
Rental deposits
12,962
13,280
1,819
Long-term investments
786,911
825,533
113,098
Amounts due from RPT-non current
20,000
–
–
Other non-current assets
180,052
110,960
15,201
Deferred tax assets
31,741
36,066
4,941
Goodwill
–
136,250
18,666
Total assets
16,228,009
18,382,970
2,518,456
Liabilities and equity
Current liabilities
Accounts payable
616,681
615,254
84,288
Deferred revenue
442,805
427,702
58,595
Accrued expenses and other current liabilities
630,617
704,410
96,504
Amounts due to related parties
4,314
–
–
Lease liabilities due within one year
60,008
141,971
19,450
Income tax payable
94,719
157,057
21,517
Deferred consideration in connection with business acquisitions-current
27,261
28,027
3,840
Convertible Senior Notes-current
–
20,191
2,766
Long-term borrowings, current portion
215,615
1,938,385
265,558
Short-term borrowings
–
2,365,535
324,077
Total current liabilities
2,092,020
6,398,532
876,595
Deferred consideration in connection with business acquisitions-non
current
–
65,694
9,000
Lease liabilities
52,171
115,105
15,769
Deferred tax liabilities
24,987
241,915
33,142
Convertible Senior Notes
19,571
–
–
Long-term borrowings
1,938,385
–
–
Other non-current liabilities
114,085
129,051
17,680
Total liabilities
4,241,219
6,950,297
952,186
Shareholder’s equity (i)
11,986,790
11,432,673
1,566,270
Total liabilities and shareholder’s equity
16,228,009
18,382,970
2,518,456
(i): As of December 31, 2024, the number of ordinary shares outstanding was 328,185,708.
Hello Group Inc.
Unaudited Condensed Consolidated Statement of Cash Flows
(All amounts in thousands, except share and per share data)
Three months
Year
Ended December 31
Ended December 31
2023
2024
2024
2023
2024
2024
RMB
RMB
US$
RMB
RMB
US$
Cash flows from operating activities:
Net income
452,469
187,235
25,649
1,951,695
1,039,573
142,420
Adjustments to reconcile net income to net cash provided by
operating activities:
Depreciation of property and equipment
15,394
11,868
1,626
74,492
52,847
7,240
Amortization of intangible assets
1,279
2,049
281
5,116
5,886
806
Share-based compensation
62,224
42,493
5,822
267,101
192,572
26,382
Share of loss (income) on equity method investments
38,703
514
70
70,643
(59,216)
(8,113)
Gain on repurchase of convertible senior notes
–
–
–
(4,565)
–
–
Cash received on distributions from equity method investments
–
730
100
2,067
1,927
264
Loss on long-term investments
31,250
46,639
6,390
31,250
90,509
12,400
Gain or loss on disposal of property and equipment
2
–
–
(518)
(62)
(8)
Provision of loss (income) on receivable and other assets
1,553
(57)
(8)
11,624
3,618
496
Changes in operating assets and liabilities:
Accounts receivable
(11,392)
(4,347)
(596)
(21,308)
7,605
1,042
Prepaid expenses and other current assets
(13,492)
27,035
3,704
84,802
(64,811)
(8,879)
Amounts due from related parties
(144)
–
–
(27,203)
–
–
Rental deposits
5,524
–
–
7,776
(309)
(42)
Deferred tax assets
1,728
(128)
(18)
2,600
(4,323)
(592)
Other non-current assets
16,033
101,561
13,914
(11,606)
(81,837)
(11,212)
Accounts payable
(25,118)
8,139
1,115
13,707
(7,571)
(1,037)
Income tax payable
5,456
63,625
8,717
25,952
62,337
8,540
Deferred revenue
(31,253)
(26,219)
(3,592)
(42,390)
(25,651)
(3,514)
Accrued expenses and other current liabilities
(11,586)
78,250
10,720
(183,772)
139,607
19,126
Amount due to related parties
639
–
–
(4,865)
–
–
Deferred tax liabilities
(130,345)
(81,498)
(11,165)
(147)
212,835
29,158
Other non-current liabilities
6,953
(34,247)
(4,692)
24,710
74,458
10,201
Net cash provided by operating activities
415,877
423,642
58,037
2,277,161
1,639,994
224,678
Cash flows from investing activities:
Purchase of property and equipment
(316,847)
(21,727)
(2,977)
(576,310)
(285,541)
(39,119)
Payment for long-term investments
(9,750)
(35,959)
(4,926)
(18,750)
(69,209)
(9,482)
Payment for business acquisition
–
(136,642)
(18,720)
–
(136,642)
(18,720)
Purchase of short-term deposits
–
–
–
(1,028,556)
(2,133,086)
(292,232)
Cash received on maturity of short-term deposits
800,000
1,047,165
143,461
6,209,820
2,128,181
291,560
Cash received from sales of short-term investment
308,550
–
–
308,550
–
–
Cash received on investment income distribution
–
120
16
1,517
120
16
Purchase of long-term deposits
(361,165)
–
–
(4,210,025)
(718,860)
(98,483)
Cash received on maturity of long-term deposits
–
200,000
27,400
1,700,000
918,860
125,883
Cash received from sales of long-term investment
10,000
–
–
25,000
2,000
274
Loan to a third-party company
–
(168,933)
(23,144)
–
(265,613)
(36,389)
Other investing activities
1
8
1
1,823
903
124
Net cash provided by (used in) investing activities
430,789
884,032
121,111
2,413,069
(558,887)
(76,568)
Cash flows from financing activities:
Proceeds from exercise of share options
31
1
–
601
18
2
Repurchase of ordinary shares
(150,191)
(425,176)
(58,249)
(212,195)
(1,197,439)
(164,048)
Repurchase of subsidiary’s share options
–
–
–
(4,319)
–
–
Dividends payment
(20,803)
–
–
(958,052)
(716,302)
(98,133)
Proceeds from short-term borrowings
–
–
–
–
2,365,535
324,077
Proceeds from long-term borrowings
–
–
–
2,154,000
–
–
Repayment of long-term borrowings
–
–
–
–
(215,615)
(29,539)
Payment for redemption of convertible bonds
–
–
–
(2,679,942)
–
–
Net cash (used in) provided by financing activities
(170,963)
(425,175)
(58,249)
(1,699,907)
236,197
32,359
Effect of exchange rate changes
(34,609)
172,439
23,628
93,988
42,205
5,784
Net increase in cash and cash equivalents
641,094
1,054,938
144,527
3,084,311
1,359,509
186,253
Cash, cash equivalents and restricted cash at the beginning of period
7,641,818
8,587,483
1,176,480
5,198,601
8,282,912
1,134,754
Cash, cash equivalents and restricted cash at the end of period
8,282,912
9,642,421
1,321,007
8,282,912
9,642,421
1,321,007
Hello Group Inc.
Reconciliation of Non-GAAP financial measures to comparable GAAP measures
(All amounts in thousands, except per share data)
1.
Reconciliation of Non-GAAP cost and operating expenses, income from operations, and net income to comparable GAAP measures.
Three months
Three months
Three months
Ended December 31, 2023
Ended December 31, 2024
Ended December 31, 2024
GAAP
Share-based
compensation
Non-GAAP
GAAP
Amortization of
intangible assets
from business
acquisitions
Share-based
compensation
Non-GAAP
GAAP
Amortization of
intangible assets
from business
acquisitions
Share-based
compensation
Non-GAAP
RMB
RMB
RMB
RMB
RMB
RMB
RMB
US$
US$
US$
US$
Cost of revenues
(1,770,117)
1,909
(1,768,208)
(1,724,821)
128
1,822
(1,722,871)
(236,300)
18
250
(236,032)
Research and development
(231,445)
13,375
(218,070)
(222,684)
120
10,198
(212,366)
(30,508)
16
1,397
(29,095)
Sales and marketing
(304,696)
8,653
(296,043)
(316,699)
521
4,480
(311,698)
(43,388)
71
614
(42,703)
General and administrative
(125,498)
38,287
(87,211)
(143,621)
–
25,993
(117,628)
(19,676)
–
3,561
(16,115)
Cost and operating expenses
(2,431,756)
62,224
(2,369,532)
(2,407,825)
769
42,493
(2,364,563)
(329,872)
105
5,822
(323,945)
Income from operations
601,997
62,224
664,221
236,686
769
42,493
279,948
32,424
105
5,822
38,351
Net income attributable to Hello Group Inc.
452,469
62,224
514,693
187,235
769
42,493
230,497
25,649
105
5,822
31,576
Hello Group Inc.
Reconciliation of Non-GAAP financial measures to comparable GAAP measures
(All amounts in thousands, except per share data)
1.
Reconciliation of Non-GAAP cost and operating expenses, income from operations, and net income to comparable GAAP measures-continued.
Year
Year
Year
Ended December 31, 2023
Ended December 31, 2024
Ended December 31, 2024
GAAP
Share-based
compensation
Non-GAAP
GAAP
Amortization of
intangible assets
from business
acquisitions
Share-based
compensation
Non-GAAP
GAAP
Amortization of
intangible assets
from business
acquisitions
Share-based
compensation
Non-GAAP
RMB
RMB
RMB
RMB
RMB
RMB
RMB
US$
US$
US$
US$
Cost of revenues
(7,025,394)
6,307
(7,019,087)
(6,447,341)
128
7,643
(6,439,570)
(883,282)
18
1,047
(882,217)
Research and development
(884,590)
64,561
(820,029)
(804,425)
120
43,526
(760,779)
(110,206)
16
5,963
(104,227)
Sales and marketing
(1,414,949)
29,066
(1,385,883)
(1,329,780)
521
19,520
(1,309,739)
(182,179)
71
2,674
(179,434)
General and administrative
(502,479)
167,167
(335,312)
(507,658)
–
121,883
(385,775)
(69,549)
–
16,698
(52,851)
Cost and operating expenses
(9,827,412)
267,101
(9,560,311)
(9,089,204)
769
192,572
(8,895,863)
(1,245,216)
105
26,382
(1,218,729)
Income from operations
2,305,016
267,101
2,572,117
1,532,770
769
192,572
1,726,111
209,988
105
26,382
236,475
Net income attributable to Hello Group Inc.
1,957,581
267,101
2,224,682
1,039,573
769
192,572
1,232,914
142,420
105
26,382
168,907
Hello Group Inc.
Unaudited Condensed Segment Report
(All amounts in thousands, except share and per share data)
Three months
Ended December 31, 2024
Momo
Tantan
QOOL
Total
Total
RMB
RMB
RMB
RMB
US$
Net revenues:
Live video service
1,189,118
75,733
–
1,264,851
173,284
Value-added service
1,198,951
127,813
–
1,326,764
181,766
Mobile marketing
33,772
9,858
–
43,630
5,977
Other services
1,222
–
29
1,251
171
Total net revenues
2,423,063
213,404
29
2,636,496
361,198
Cost and expenses (ii):
Cost of revenues
(1,621,151)
(103,670)
–
(1,724,821)
(236,300)
Research and development
(181,255)
(41,429)
–
(222,684)
(30,508)
Sales and marketing
(267,065)
(48,978)
(656)
(316,699)
(43,388)
General and administrative
(134,200)
(9,124)
(297)
(143,621)
(19,676)
Total cost and expenses
(2,203,671)
(203,201)
(953)
(2,407,825)
(329,872)
Other operating income
7,032
928
55
8,015
1,098
Income (loss) from operations
226,424
11,131
(869)
236,686
32,424
Interest income
123,822
216
7
124,045
16,994
Interest expense
(36,846)
–
–
(36,846)
(5,048)
Other gain or loss, net
(46,639)
–
–
(46,639)
(6,390)
Income (loss) before income tax and share of loss on equity method
investments
266,761
11,347
(862)
277,246
37,980
Income tax (expenses) benefits
(89,919)
455
(33)
(89,497)
(12,261)
Income (loss) before share of loss on equity method investments
176,842
11,802
(895)
187,749
25,719
Share of loss on equity method investments
(514)
–
–
(514)
(70)
Net income (loss)
176,328
11,802
(895)
187,235
25,649
(ii) Share-based compensation was allocated in cost of revenues and operating expenses as follows:
Three months
Ended December 31, 2024
Momo
Tantan
QOOL
Total
Total
RMB
RMB
RMB
RMB
US$
Cost of revenues
1,822
–
–
1,822
250
Research and development
9,956
242
–
10,198
1,397
Sales and marketing
4,480
–
–
4,480
614
General and administrative
25,993
–
–
25,993
3,561
Total cost and expenses
42,251
242
–
42,493
5,822
Hello Group Inc.
Reconciliation of GAAP and NON-GAAP Results of Unaudited Segment Report
(All amounts in thousands, except share and per share data)
Three months
Ended December 31, 2024
Momo
Tantan
QOOL
Total
Total
RMB
RMB
RMB
RMB
US$
Income (loss) from operations
226,424
11,131
(869)
236,686
32,424
Share-based compensation
42,251
242
–
42,493
5,822
Amortization of intangible assets from
business acquisitions
769
–
–
769
105
Non-GAAP income (loss) from
operations
269,444
11,373
(869)
279,948
38,351
Net income (loss)
176,328
11,802
(895)
187,235
25,649
Share-based compensation
42,251
242
–
42,493
5,822
Amortization of intangible assets from
business acquisitions
769
–
–
769
105
Non-GAAP net income (loss)
219,348
12,044
(895)
230,497
31,576
Hello Group Inc.
Unaudited Condensed Segment Report
(All amounts in thousands, except share and per share data)
Three months
Ended December 31, 2023
Momo
Tantan
QOOL
Total
Total
RMB
RMB
RMB
RMB
US$[1]
Net revenues:
Live video service
1,423,730
100,155
–
1,523,885
214,635
Value-added service
1,264,358
160,535
–
1,424,893
200,692
Mobile marketing
33,395
11,520
–
44,915
6,326
Mobile games
5,441
–
–
5,441
766
Other services
1,760
–
2,038
3,798
535
Total net revenues
2,728,684
272,210
2,038
3,002,932
422,954
Cost and expenses (iii):
Cost of revenues
(1,638,915)
(130,237)
(965)
(1,770,117)
(249,316)
Research and development
(180,343)
(51,102)
–
(231,445)
(32,598)
Sales and marketing
(244,043)
(58,444)
(2,209)
(304,696)
(42,916)
General and administrative
(117,923)
(6,882)
(693)
(125,498)
(17,676)
Total cost and expenses
(2,181,224)
(246,665)
(3,867)
(2,431,756)
(342,506)
Other operating income, net
29,442
1,301
78
30,821
4,341
Income (loss) from operations
576,902
26,846
(1,751)
601,997
84,789
Interest income
124,294
57
3
124,354
17,515
Interest expense
(20,552)
–
–
(20,552)
(2,895)
Other gain or loss, net
(31,250)
–
–
(31,250)
(4,401)
Income (loss) before income tax and share of loss on equity
method investments
649,394
26,903
(1,748)
674,549
95,008
Income tax expenses
(180,669)
(2,708)
–
(183,377)
(25,828)
Income (loss) before share of loss on equity method investments
468,725
24,195
(1,748)
491,172
69,180
Share of loss on equity method investments
(38,703)
–
–
(38,703)
(5,451)
Net income (loss)
430,022
24,195
(1,748)
452,469
63,729
(iii) Share-based compensation was allocated in cost of revenues and operating expenses as follows:
Three months
Ended December 31, 2023
Momo
Tantan
QOOL
Total
Total
RMB
RMB
RMB
RMB
US$
Cost of revenues
1,905
4
–
1,909
269
Research and development
13,194
181
–
13,375
1,884
Sales and marketing
8,653
–
–
8,653
1,219
General and administrative
38,279
8
–
38,287
5,393
Total cost and expenses
62,031
193
–
62,224
8,765
[1] All translations from RMB to U.S. dollars are made at a rate of RMB7.0999 to US$1.00, the effective noon buying rate for December 29, 2023 as set forth in the H.10 statistical release of the Federal Reserve Board.
Hello Group Inc.
Reconciliation of GAAP and NON-GAAP Results of Unaudited Segment Report
(All amounts in thousands, except share and per share data)
Three months
Ended December 31, 2023
Momo
Tantan
QOOL
Total
Total
RMB
RMB
RMB
RMB
US$
Income (loss) from operations
576,902
26,846
(1,751)
601,997
84,789
Share-based compensation
62,031
193
–
62,224
8,765
Non-GAAP income (loss) from
operations
638,933
27,039
(1,751)
664,221
93,554
Net income (loss)
430,022
24,195
(1,748)
452,469
63,729
Share-based compensation
62,031
193
–
62,224
8,765
Non-GAAP net income (loss)
492,053
24,388
(1,748)
514,693
72,494
Hello Group Inc.
Unaudited Condensed Segment Report
(All amounts in thousands, except share and per share data)
Year
Ended December 31, 2024
Momo
Tantan
QOOL
Total
Total
RMB
RMB
RMB
RMB
US$
Net revenues:
Live video service
4,779,865
312,989
–
5,092,854
697,718
Value-added service
4,772,811
549,915
–
5,322,726
729,210
Mobile marketing
105,169
37,781
–
142,950
19,584
Mobile games
432
–
–
432
59
Other services
3,137
–
872
4,009
550
Total net revenues
9,661,414
900,685
872
10,562,971
1,447,121
Cost and expenses (iv):
Cost of revenues
(6,029,415)
(417,887)
(39)
(6,447,341)
(883,282)
Research and development
(643,457)
(160,968)
–
(804,425)
(110,206)
Sales and marketing
(1,103,475)
(220,966)
(5,339)
(1,329,780)
(182,179)
General and administrative
(473,778)
(32,868)
(1,012)
(507,658)
(69,549)
Total cost and expenses
(8,250,125)
(832,689)
(6,390)
(9,089,204)
(1,245,216)
Other operating income
56,069
2,853
81
59,003
8,083
Income (loss) from operations
1,467,358
70,849
(5,437)
1,532,770
209,988
Interest income
510,162
789
13
510,964
70,002
Interest expense
(127,846)
–
–
(127,846)
(17,515)
Other gain or loss, net
(90,509)
–
–
(90,509)
(12,400)
Income (loss) before income tax and share of income on equity method
investments
1,759,165
71,638
(5,424)
1,825,379
250,075
Income tax expenses
(843,640)
(1,349)
(33)
(845,022)
(115,768)
Income (loss) before share of income on equity method investments
915,525
70,289
(5,457)
980,357
134,307
Share of income on equity method investments
59,216
–
–
59,216
8,113
Net income (loss)
974,741
70,289
(5,457)
1,039,573
142,420
(iv) Share-based compensation was allocated in cost of revenues and operating expenses as follows:
Year
Ended December 31, 2024
Momo
Tantan
QOOL
Total
Total
RMB
RMB
RMB
RMB
US$
Cost of revenues
7,639
4
–
7,643
1,047
Research and development
38,452
5,074
–
43,526
5,963
Sales and marketing
19,520
–
–
19,520
2,674
General and administrative
121,867
16
–
121,883
16,698
Total cost and expenses
187,478
5,094
–
192,572
26,382
Hello Group Inc.
Reconciliation of GAAP and NON-GAAP Results of Unaudited Segment Report
(All amounts in thousands, except share and per share data)
Year
Ended December 31, 2024
Momo
Tantan
QOOL
Total
Total
RMB
RMB
RMB
RMB
US$
Income (loss) from operations
1,467,358
70,849
(5,437)
1,532,770
209,988
Share-based compensation
187,478
5,094
–
192,572
26,382
Amortization of intangible assets from
business acquisitions
769
–
–
769
105
Non-GAAP income (loss) from operations
1,655,605
75,943
(5,437)
1,726,111
236,475
Net income (loss)
974,741
70,289
(5,457)
1,039,573
142,420
Share-based compensation
187,478
5,094
–
192,572
26,382
Amortization of intangible assets from
business acquisitions
769
–
–
769
105
Non-GAAP net income (loss)
1,162,988
75,383
(5,457)
1,232,914
168,907
Hello Group Inc.
Unaudited Condensed Segment Report
(All amounts in thousands, except share and per share data)
Year
Ended December 31, 2023
Momo
Tantan
QOOL
Total
Total
RMB
RMB
RMB
RMB
US$
Net revenues:
Live video service
5,567,894
504,977
–
6,072,871
855,346
Value-added service
5,085,541
667,030
–
5,752,571
810,233
Mobile marketing
109,125
24,552
–
133,677
18,828
Mobile games
19,610
–
–
19,610
2,762
Other services
16,337
–
7,257
23,594
3,323
Total net revenues
10,798,507
1,196,559
7,257
12,002,323
1,690,492
Cost and expenses (v):
Cost of revenues
(6,404,042)
(599,348)
(22,004)
(7,025,394)
(989,506)
Research and development
(664,340)
(220,250)
–
(884,590)
(124,592)
Sales and marketing
(1,138,505)
(268,652)
(7,792)
(1,414,949)
(199,291)
General and administrative
(467,537)
(26,482)
(8,460)
(502,479)
(70,773)
Total cost and expenses
(8,674,424)
(1,114,732)
(38,256)
(9,827,412)
(1,384,162)
Other operating income
125,318
4,411
376
130,105
18,325
Income (loss) from operations
2,249,401
86,238
(30,623)
2,305,016
324,655
Interest income
435,451
713
89
436,253
61,445
Interest expense
(62,223)
–
–
(62,223)
(8,764)
Other gain or loss, net
(26,685)
–
–
(26,685)
(3,759)
Income (loss) before income tax and share of loss on equity method
investments
2,595,944
86,951
(30,534)
2,652,361
373,577
Income tax expenses
(623,844)
(6,179)
–
(630,023)
(88,737)
Income (loss) before share of loss on equity method investments
1,972,100
80,772
(30,534)
2,022,338
284,840
Share of loss on equity method investments
(70,643)
–
–
(70,643)
(9,950)
Net income (loss)
1,901,457
80,772
(30,534)
1,951,695
274,890
(v) Share-based compensation was allocated in cost of revenues and operating expenses as follows:
Year
Ended December 31, 2023
Momo
Tantan
QOOL
Total
Total
RMB
RMB
RMB
RMB
US$
Cost of revenues
6,167
140
–
6,307
888
Research and development
49,987
14,574
–
64,561
9,093
Sales and marketing
29,061
5
–
29,066
4,094
General and administrative
167,135
32
–
167,167
23,545
Total cost and expenses
252,350
14,751
–
267,101
37,620
Hello Group Inc.
Reconciliation of GAAP and NON-GAAP Results of Unaudited Segment Report
(All amounts in thousands, except share and per share data)
Year
ended December 31, 2023
Momo
Tantan
QOOL
Total
Total
RMB
RMB
RMB
RMB
US$
Operating income (loss) from operations
2,249,401
86,238
(30,623)
2,305,016
324,655
Share-based compensation
252,350
14,751
–
267,101
37,620
Non-GAAP operating income (loss) from
operations
2,501,751
100,989
(30,623)
2,572,117
362,275
Net income (loss)
1,901,457
80,772
(30,534)
1,951,695
274,890
Share-based compensation
252,350
14,751
–
267,101
37,620
Non-GAAP net income (loss)
2,153,807
95,523
(30,534)
2,218,796
312,510
View original content:https://www.prnewswire.com/news-releases/hello-group-inc-announces-unaudited-financial-results-for-the-fourth-quarter-and-fiscal-year-2024-302399626.html
SOURCE Hello Group Inc.

You may like
Technology
Care Career Announces Acquisition of MAS Medical Staffing, Completing Its First Acquisition Phase and Expanding Annual Revenue Beyond $150 Million, with a Path to Exceed a Quarter Billion by the End of 2026 Through Additional Acquisitions and Organic Growth
Published
2 hours agoon
July 24, 2026By

WOODBRIDGE, N.J., July 24, 2026 /PRNewswire/ — Care Career, a rapidly growing healthcare workforce technology organization, today announced the acquisition of MAS Medical Staffing, one of the Northeast’s leading healthcare workforce organizations. Financial terms of the transaction were not disclosed.
The acquisition represents Care Career’s seventh strategic acquisition in the past 24 months, further strengthening the company’s position as one of the largest healthcare workforce organizations in the United States while accelerating its strategy to redefine the future of healthcare workforce management through artificial intelligence, enterprise technology, and workforce innovation.
MAS Medical Staffing has built an outstanding reputation for delivering high-quality workforce solutions through strong client relationships, exceptional clinician engagement, and deep regional expertise throughout the Northeastern United States. The acquisition significantly expands Care Career’s geographic footprint while broadening its access to healthcare professionals, client relationships, workforce data, and regional market intelligence.
Care Career is building a technology-enabled workforce ecosystem powered by its AI-powered workforce platform, where every acquisition contributes not only additional market presence, but also expanded data, enhanced artificial intelligence capabilities, digital innovation, and operational scale that continuously improve the experience for clients and clinicians alike. As the platform grows, every clinician engagement, client interaction, credential, placement, and workforce trend strengthens the intelligence of Career’s technology, creating a continuously improving ecosystem designed to deliver faster, smarter, and more effective workforce solutions.
The acquisition also brings MAS Medical Staffing’s MAESTRA® engagement technology, along with its client relationships and clinician network, directly onto Career’s AI-powered workforce platform. MAESTRA’s scheduling, credentialing, and communication capabilities will be integrated into Care Career’s existing technology stack, further enhancing clinician engagement across onboarding, scheduling, and career management while providing healthcare organizations with greater workforce visibility and operational efficiency.
“Our vision is to build the AI-powered infrastructure that modernizes healthcare workforce management,” said Siva Konatham, Group President and Chief Executive Officer of Care Career. “Under my leadership, Care Career is focused on transforming a fragmented, labor-intensive industry into a data-driven, technology-enabled ecosystem that improves speed, efficiency, and workforce visibility for healthcare providers. Each acquisition strengthens our platform intelligence, expands our scale, and enhances our margin potential. By integrating advanced analytics, AI automation, and digital engagement tools, we are not just growing revenue—we are building a smarter, more scalable model positioned to lead the next era of healthcare workforce solutions.”
The combined organization will leverage expanded recruiting resources, centralized credentialing, advanced workforce analytics, AI-enabled automation, and digital engagement technologies—all powered by Care Career’s AI-powered workforce platform—to deliver broader recruiting capabilities, faster response times, enhanced workforce insights, and expanded national coverage. Clinicians will benefit from a seamless digital experience that simplifies every stage of their careers—from job discovery and credentialing to onboarding, scheduling, communication, and long-term career development.
With seven strategic acquisitions completed in less than two years, representing the first round of acquisitions now totaling more than $150 million in annual revenue, Care Career has rapidly expanded its national presence while executing a disciplined growth strategy focused on technology integration, operational excellence, and workforce innovation. The company has also signed additional Letters of Intent with other entities with expected close dates in the third quarter of 2026. Upon completion of these transactions, coupled with organic growth, Care Career expects consolidated annual revenue to exceed a quarter of a billion dollars by the end of 2026.
The addition of MAS Medical Staffing further strengthens the organization’s ability to serve healthcare systems, hospitals, long-term care providers, outpatient facilities, and other healthcare organizations across an increasingly diverse geographic footprint.
“The healthcare workforce industry is entering a new era where technology, artificial intelligence, and data-driven decision-making will define the market leaders,” Konatham added. “Every acquisition we complete expands the intelligence of our AI-powered workforce platform, enhances the value we deliver to our clients, and creates more opportunities for clinicians. We believe the combination of exceptional people, innovative technology, and strategic scale positions Care Career to lead the next generation of healthcare workforce solutions.”
About Care Career
Care Career is a technology-enabled healthcare workforce solutions company dedicated to transforming how healthcare organizations recruit, engage, credential, deploy, and retain clinical talent. Powered by its proprietary AI-powered workforce platform and supported by advanced artificial intelligence, enterprise technology, and workforce analytics, Care Career is building an intelligent healthcare workforce ecosystem that connects providers and clinicians more efficiently while improving workforce performance, operational effectiveness, and patient care. Following seven strategic acquisitions over the past 24 months the first round of acquisitions totaling more than $150 million in annual revenue and with additional signed LOIs under contract expected to complete shortly, positioning the company to surpass a quarter of a billion dollars in consolidated annual revenue by the end of 2026, Care Career has become one of the nation’s largest and fastest-growing healthcare workforce organizations, serving healthcare providers and clinicians across the United States.
About MAS Medical Staffing
MAS Medical Staffing is a premier healthcare workforce organization recognized for exceptional service, strong client partnerships, and a commitment to connecting healthcare professionals with rewarding career opportunities. With an established presence throughout the Northeastern United States, MAS Medical Staffing has earned a reputation for quality, responsiveness, and delivering workforce solutions that help healthcare providers meet their evolving workforce needs while supporting clinicians throughout every stage of their careers.
View original content to download multimedia:https://www.prnewswire.com/news-releases/care-career-announces-acquisition-of-mas-medical-staffing-completing-its-first-acquisition-phase-and-expanding-annual-revenue-beyond-150-million-with-a-path-to-exceed-a-quarter-billion-by-the-end-of-2026-through-additional-acqu-302834472.html
SOURCE Care Career
Technology
PointsKash Demonstrates How Businesses Can Build on Bitcoin Without Burdening the Blockchain
Published
2 hours agoon
July 24, 2026By

As industry debate surrounding Bitcoin Improvement Proposal (BIP-110) intensifies, PointsKash unveils an architecture designed to work regardless of the proposal’s outcome.
SCOTTSDALE, Ariz., July 24, 2026 /PRNewswire/ — As the global Bitcoin community debates Bitcoin Improvement Proposal 110 (BIP-110) and the future of data stored on the Bitcoin blockchain, PointsKash, Inc. today announced that its next-generation kiosk infrastructure was intentionally designed to operate efficiently under any outcome of the proposal.
Rather than storing operational data directly on the Bitcoin blockchain, PointsKash utilizes a layered architecture that combines Bitcoin‘s unmatched security with modern decentralized communications technology. Every transaction, machine event, system update, and operational record generated across the PointsKash network is cryptographically verified, securely maintained off-chain, and anchored to the Bitcoin blockchain through a single immutable cryptographic proof.
This approach allows thousands of operational events to be permanently verified while utilizing only a minimal amount of blockchain data.
As discussion surrounding BIP-110 has intensified across the digital asset industry, PointsKash believes the debate does not require choosing between innovation and responsible blockchain stewardship.
“The industry has been debating whether businesses can build meaningful applications on Bitcoin without unnecessarily consuming blockchain space,” said Michael Herron, Chief Executive Officer of PointsKash. “We believe we’ve demonstrated that the answer is yes. Bitcoin provides the world’s most trusted immutable timestamp and security layer, while higher-volume operational data belongs on technologies specifically designed to manage it. By combining both, we’ve built an architecture that is scalable, transparent, and future-ready regardless of how the BIP-110 discussion ultimately evolves.”
The company’s infrastructure assigns every kiosk its own unique cryptographic identity, allowing each machine to securely authenticate every transaction and operational event. Those records are then independently verifiable through cryptographic proofs while remaining resistant to alteration or manipulation—even by PointsKash itself.
According to the company, this architecture delivers several significant advantages:
Mathematically verifiable transaction records for regulators, banking partners, auditors, and enterprise customers.Improved network reliability, allowing kiosks to continue operating during temporary connectivity interruptions without losing transaction history.Enhanced cybersecurity, with every machine maintaining its own authenticated identity and secure communications.A scalable blockchain architecture that minimizes on-chain data while preserving complete auditability.
“Bitcoin was created to provide trust, security, and permanence—not to become a storage system for every piece of application data,” Herron added. “Our philosophy has always been simple: use Bitcoin for what it does better than anyone else—creating immutable proof that records have never been altered—and leverage modern decentralized technologies for everything else. We believe that’s the future of enterprise blockchain infrastructure.”
PointsKash believes this architecture positions the company among a new generation of fintech innovators utilizing Bitcoin as a secure trust layer while developing scalable financial applications for enterprise deployment.
The technology also establishes the foundation for future blockchain-based financial products currently under development, including enhanced digital audit capabilities, verifiable financial records, enterprise licensing opportunities, and next-generation digital asset infrastructure.
As the Bitcoin ecosystem continues to mature, PointsKash believes its technology demonstrates that responsible innovation and blockchain scalability can successfully coexist—providing enterprise organizations with the confidence to build on Bitcoin without contributing unnecessary data to the network.
About PointsKash, Inc.
PointsKash, Inc. is a financial technology company developing an integrated ecosystem of AI-enabled self-service financial centers, digital banking, digital payment solutions, cryptocurrency services, loyalty rewards, enterprise merchant technologies, and mobile financial applications. Through proprietary software, Artificial Intelligence, and strategic partnerships, PointsKash is building innovative financial solutions designed to empower consumers, merchants, and enterprise organizations throughout North America.
For more information, visit www.pointskash.com.
Media Contact
PointsKash, Inc.
Investor Relations
info@pointskash.com
www.pointskash.com
Forward-Looking Statements
This press release contains forward-looking statements regarding anticipated technology integrations, Artificial Intelligence initiatives, product development, future commercialization plans, expected operational efficiencies, business strategy, and future growth. These statements are based on current expectations and involve risks and uncertainties that could cause actual results to differ materially from those expressed or implied. Factors that could affect actual results include, but are not limited to, technology development timelines, integration efforts, financing, regulatory developments, market conditions, and other risks facing the Company. PointsKash undertakes no obligation to update any forward-looking statements except as required by applicable law.
View original content to download multimedia:https://www.prnewswire.com/news-releases/pointskash-demonstrates-how-businesses-can-build-on-bitcoin-without-burdening-the-blockchain-302834473.html
SOURCE PointsKash Inc.
Technology
As ADA Anniversary Approaches, University of Phoenix Survey Highlights AI’s Potential to Advance Accessibility in Work and Learning
Published
3 hours agoon
July 24, 2026By
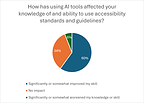
Survey conducted by The Harris Poll on behalf of University of Phoenix finds among those already using AI in the workplace, 60% say AI has improved their knowledge of and ability to use accessibility standards and guidelines.
PHOENIX, July 24, 2026 /PRNewswire/ — As artificial intelligence becomes part of how people work, learn and solve problems, a new University of Phoenix survey conducted by The Harris Poll finds that recent working learners see meaningful opportunities for AI to support accessibility. The survey was designed to understand the impact of AI in the workplace and learning environments on accessibility, defined as ensuring digital content, tools and resources, including AI tools and output, are usable by people with different abilities through inclusive design, use of assistive technology or conformance with accessibility standards, such as the Web Content Accessibility Guidelines (WCAG). The findings are being released ahead of the 36th anniversary of the Americans with Disabilities Act (ADA) on July 26.
The survey, conducted among 1,019 U.S. employed adults who completed a professionally presented training or school course in the past 12 months (“recent working learners”), found that, among workers already using AI in the workplace, 3 in 5 (60%) say AI has improved their knowledge of and ability to use accessibility standards and guidelines, including nearly 1 in 5 (19%) who report significant improvement.
While the findings point to optimism about AI’s accessibility potential, they also reveal an opportunity for clearer organizational guidance: 45% of respondents say accessibility is absent from, unclear in, or they are uncertain whether it is covered by their workplace AI policies.
“The reality is that accessibility benefits everyone,” shares Kelly Hermann, Vice President of Accessibility and Student Affairs at University of Phoenix. “If accessibility is built in from the beginning, organizations are more likely to create AI-enabled environments that are universally usable. Clearer content, better summaries, accurate captions, and multiple formats can help workers and learners with disabilities, but they also help busy adults, multilingual learners, mobile users, and anyone trying to absorb information quickly.”
Key findings from the survey include:
Workers see AI’s accessibility potential: 89% of recent working learners identify workflows that could benefit from AI and accessibility tools, especially creating accessible documents, presentations, websites or learning materials (38%), presenting information in different formats such as plain language, audio, summaries or translations (33%), and training employees or learners on accessibility practices (30%).AI may help build accessibility awareness: Among those already using AI in the workplace, 60% say AI has improved their knowledge of and ability to use accessibility standards and guidelines.Accessibility is not always clear in workplace AI policies: 45% of recent working learners say accessibility is absent from, unclear in, or they are uncertain whether it is covered by their workplace AI policies.AI tools may not yet fully support different access needs: Among those who use workplace AI tools, only about a quarter of survey respondents (27%) say AI tools available through their workplace or professional learning environment support people with disabilities very well.Human oversight remains important: 36% of recent working learners say human review for important decisions or high-impact work should be part of responsible AI use at work or school.Workers also recognize how AI and accessibility can have an impact on their own career journey: 90% of recent working learners identify AI and accessibility skills that would be valuable in their current or desired career field, including 45% who see value in understanding when AI-generated content needs human review.
Why accessibility is essential to responsible AI adoption
As AI tools are used to draft documents, summarize information, generate captions and transcripts, create image descriptions, support learning and assist with workplace tasks, accessibility becomes central to responsible use. Poorly implemented AI can also create or amplify barriers, including inaccessible content, inaccurate summaries, biased outputs and tools that do not work effectively with assistive technologies.
“Responsible AI is not only about productivity,” Hermann said. “It is about whether the technology works for the people who need to use it. AI can help create more accessible materials and more flexible ways to engage with information, but it still requires clear policies, practical training and human judgment to make sure the outputs are accurate, applicable and usable.”
What the findings mean for employers and educators
The survey suggests that organizations have an opportunity to align AI adoption with supportive design, accessibility practices and workforce training. Employers and educators can take immediate steps by:
Naming accessibility directly in AI policies and guidance.Choosing AI tools with accessibility and assistive technology compatibility in mind.Training workers and learners to create, check and improve accessible AI-generated content.Making support pathways clear for people who experience barriers using AI tools.Keeping human review in place for important decisions, high-impact work and accessibility-sensitive outputs.
The survey also found workers want practical AI training. The most helpful resources identified by recent working learners include real-world examples from their field or industry (36%), hands-on practice using realistic workplace scenarios (34%) and step-by-step demonstrations of common tasks (33%).
Accessibility insights from University of Phoenix
Hermann shared the survey findings ahead of the ADA anniversary in recent media interviews. Hermann oversees the University’s accessibility initiative, including evaluation and remediation of curricular resources, the Center for Access, Resources, Engagement and Support Services (CARES), and the Office of Collaborative Learning and Educational Engagement. Her work focuses on fostering accessible and welcoming educational environments for students, faculty and staff.
Hermann’s office at University of Phoenix also convenes accessibility conversations through initiatives such as Access Amplified™, a free, annual virtual event focused on advancing digital accessibility in web development. The event brings together engineers, developers, designers, content authors and digital strategists for practical strategies and human-centered conversations that address the gap between coding practices and how users with assistive technology experience the web.
About the survey
The survey was conducted online within the United States by The Harris Poll on behalf of University of Phoenix from June 22–29, 2026, among 1,019 employed adults ages 18 and older who have taken a professionally presented training or a school course in the past 12 months, referred to as “recent working learners.” Data were weighted where necessary by age, gender, race/ethnicity, region, education, employment, marital status, household size, household income and smoking status to bring them in line with their actual proportions in the population.
Respondents for this survey were selected from among those who have agreed to participate in surveys. The sampling precision of Harris online polls is measured by using a Bayesian credible interval. For this study, the sample data is accurate to within +/- 3.8 percentage points using a 95% confidence level. This credible interval will be wider among subsets of the surveyed population of interest.
Review the complete survey at phoenix.edu/aiaccessibility.
About University of Phoenix
University of Phoenix is Built for Real Life. 50 Years Strong. The University innovates to help working adults enhance their careers and develop skills in a rapidly changing world through flexible online learning, relevant courses, academic AI pillars, and skills-mapped curriculum for associate, bachelor’s and master’s degree programs. Active students and alumni have access to Career Services for Life® resources including career guidance and tools. For more information, visit phoenix.edu.
View original content to download multimedia:https://www.prnewswire.com/news-releases/as-ada-anniversary-approaches-university-of-phoenix-survey-highlights-ais-potential-to-advance-accessibility-in-work-and-learning-302834448.html
SOURCE University of Phoenix


Care Career Announces Acquisition of MAS Medical Staffing, Completing Its First Acquisition Phase and Expanding Annual Revenue Beyond $150 Million, with a Path to Exceed a Quarter Billion by the End of 2026 Through Additional Acquisitions and Organic Growth

PointsKash Demonstrates How Businesses Can Build on Bitcoin Without Burdening the Blockchain

As ADA Anniversary Approaches, University of Phoenix Survey Highlights AI’s Potential to Advance Accessibility in Work and Learning

Send Rakhi to UK swiftly with UK Gifts Portal

Whiteboard Series with NEAR | Ep: 45 Joel Thorstensson from ceramic.network

New Gooseneck Omni Antennas Offer Enhanced Signals in a Durable Package

Why You Should Build on #NEAR – Co-founder Illia Polosukhin at CV Labs
Whiteboard Series with NEAR | Ep: 45 Joel Thorstensson from ceramic.network

NEAR End of Year Town Hall 2021: The Open Web World, MetaBUILD 2 Hackathon and 2021 recap
Trending
-

 Technology5 days ago
“Every Day CO₂ Challenge”: More Than a Game, A New Way of Learning
-

 Technology5 days ago
Trakka Systems to Demonstrate Advanced ISR Capabilities at Farnborough International Airshow 2026
-

 Technology5 days ago
Powering ASEAN’s Manufacturing Transformation: IME 2026 Connects Technology, Industry and Opportunity
-

 Technology4 days ago
Signeasy expands beyond eSignatures with Intelligent Contract Management for growing businesses
-
 Technology5 days ago
DBS named Asia’s Best Digital Bank by Euromoney, recognised for its AI leadership and responsible innovation
-
 Technology5 days ago
CNPC launches China’s first full-chain green, low-carbon ethylene project
-

 Technology5 days ago
Omni HR Launches Native MCP Integration, Connecting AI Assistants to Live HR Data
-

 Technology5 days ago
BOC Group Releases ADONIS 19.0 LTS to Bring Smarter Support into Everyday BPM Work