
Technology
BLUE ANT MEDIA ANNOUNCES GO PUBLIC TRANSACTION BY WAY OF REVERSE TAKEOVER OF BOAT ROCKER MEDIA

Published
2 years agoon
By

Boat Rocker Management to Complete Concurrent Management Buyout of Boat Rocker’s Studio Business
Strategic transaction enables Blue Ant to go public, acquire three Canadian production companies and unlock substantial cash and liquidity
TORONTO, March 24, 2025 /CNW/ – Blue Ant Media Inc. (“Blue Ant” or “The Company”), a privately owned company controlled by Michael MacMillan, announced today that it has entered into a definitive agreement pursuant to which Blue Ant will go-public via a reverse take-over (the “RTO” or the “Transaction”) of Boat Rocker Media Inc. (“BRMI”) (TSX: BRMI).
Blue Ant is a global media company with interconnected operations spanning content creation and acquisition, rights management, international distribution, streaming, broadcasting, consumer shows, and connected TV ad sales. The Company was founded in 2011 by Mr. MacMillan, former Chair and CEO of Alliance Atlantis. Headquartered in Toronto, with a presence in Los Angeles, New York, Washington, London, Sydney, and Singapore, Blue Ant generated C$196 million in revenues in its most recent fiscal year ending August 31, 2024, a 16% increase year-over-year, and generated C$18 million in net income.
Pursuant to the Transaction, BRMI will acquire all of the outstanding shares of Blue Ant in exchange for subordinate voting shares of BRMI on the basis of an exchange ratio of 1.25 shares subordinate voting shares of BRMI (prior to the share consolidation noted below) for each share of Blue Ant (the “Exchange Ratio”). Based on a share price of C$2.25 per Blue Ant share and the Exchange Ratio, the implied consideration under the Transaction is C$1.801 per BRMI share (pre-consolidation), which is a 125% premium to the March 21, 2025 closing price of BRMI’s shares on the Toronto Stock Exchange (“TSX”). At closing of the transaction, the subordinate voting shares (“SVS”) of the company resulting from the RTO (the “Resulting Issuer”) are expected to be consolidated on a 10:1 basis.
Immediately following closing the Resulting Issuer will be renamed “Blue Ant Media Corporation” and, subject to regulatory approval, the Resulting Issuer’s shares will continue to be listed and trade on the TSX.
On closing of the RTO, the Resulting Issuer will inherit from BRMI three Canadian production companies: Insight Productions, Jam Filled Entertainment, and Proper Television, which collectively delivered C$118 million in revenue (based on unaudited results) in calendar 2024.
As part of the transaction, the Resulting Issuer will also receive substantial financial assets, including: (i) a minimum cash balance of C$25.5 million and normalized net working capital; (ii) US$11.6 million (approximately C$17 million) in cash from the monetization of BRMI’s ownership in The Initial Group; (iii) a C$18 million vendor takeback promissory note related to the management buyout of certain BRMI assets; and (iv) a value assurance payment of up to C$34.7 million based on the financial performance of the three production companies acquired for the year ending December 31, 2025.
___________________________________
1 [Based on the latest transaction price for Blue Ant shares at a price of C$2.25 per share; C$1.80 per BRMI share determined based on the exchange ratio and Blue Ant’s agreed per share valuation which is based in part on the pricing of recent transactions completed by Blue Ant].
Upon closing of the transaction, Blue Ant’s shareholders are expected to own approximately 73.5%, and BRMI’s shareholders approximately 26.5% of the Resulting Issuer’s SVS. Prior to completion of the RTO, Blue Ant intends to pursue a best-efforts agency offering of subscription receipts which are exchangeable for SVS of the Resulting Issuer, and Fairfax Financial Holdings Limited (“Fairfax”), a significant shareholder of Blue Ant, has agreed to support the offering through a C$20 million backstop commitment, which would reduce the above ownership percentages if completed. The company has entered into an agreement with Cormark Securities Inc. and National Bank Financial Inc. to act as co-lead agents in connection with the offering.
In addition to the backstop, Fairfax has entered into a number of agreements with Blue Ant and BRMI in support of the Transaction. Further details of the Transaction and the agreements with Fairfax are set out in Blue Ant’s presentation which will be available on SEDAR+ under BRMI’s profile.
Michael MacMillan will be appointed CEO of the Resulting Issuer upon close, and Brad Martin, the current chair of Blue Ant, will be appointed Chair of the Board of Directors of the Resulting Issuer. As Blue Ant owns certain Canadian broadcasting assets, in order to maintain Canadian control over the Resulting Issuer, and consistent with his existing position in Blue Ant, Michael MacMillan will have voting control of approximately 77.5% of the total votes (assuming there is no additional equity offering) over the Resulting Issuer including via ownership of 100% of the Resulting Issuer’s Multiple Voting Shares (“MVS”).
“This is an opportunistic moment for Blue Ant to go public, paving the way for long-term value creation,” said Mr. MacMillan, CEO of Blue Ant. “We are confident that this transaction will unlock significant value for all shareholders. Through the combination of our public listing, a strengthened balance sheet, and significant net cash post-transaction, we believe that we are strategically positioned for profitable global growth, both organically and through M&A.”
Overview of Transactions and Asset Distribution Following RTO Closing
The current Board of BRMI (other than Ellis Jacob), as well as IDJCo’s principals, will resign on closing of the RTO, and the assets of BRMI will be divided in various transactions on closing as follows:
Unscripted studios Insight Productions and Proper Television, and animation-focused studio Jam Filled, along with certain corporate and shared services, will remain with the Resulting Issuer. These studios will complement Blue Ant’s existing unscripted and animation studios business.
BRMI’s minority interest of The Initial Group will be acquired by Fairfax for approximately C$17M.
Contemporaneously with closing of the RTO, BRMI will sell all of its global Scripted, Unscripted and Kids & Family television production, distribution, brand & franchise management, creative and venture partnerships, and content investment business, excluding Insight Productions, Jam Filled Entertainment and Proper Television (the “Remaining Businesses”), together with the Boat Rocker name and brand, to IDJCo pursuant to a management buyout. Immediately following the closing, IDJCo will carry on business under the “Boat Rocker” name and brand.
IDJCo will acquire Boat Rocker Studios by way of a vendor takeback promissory note, guaranteed by Fairfax, with a principal amount of C$18 million, payable over six years in equal installments following closing, with an additional C$1 million lump sum payment payable on the sixth anniversary of the closing.
Both existing BRMI shareholders and Blue Ant shareholders will accordingly have a meaningful opportunity to benefit as shareholders of the Resulting Issuer, with improved liquidity.
About Blue Ant
Blue Ant is a global media company purpose-built for the digital age. Since its founding in 2011, it has transformed from a small Canadian broadcaster to a globally diversified business with interconnected operations designed to maximize intellectual property (“IP”) value across digital and other platforms and geographies in multiple windows. Its operations include content creation, rights management, distribution, streaming, linear broadcasting, consumer shows, and connected TV ad sales. Its video content is monetized in multiple windows across its portfolio of targeted brands and channels in more than 100 countries across more than 300 platforms.
The company’s leadership has a proven track record of building successful content businesses, identifying and capitalizing on emerging industry trends, and delivering strong shareholder returns.
Blue Ant’s co-founder and CEO is Michael MacMillan. Prior to Blue Ant, Mr. MacMillan co-founded Atlantis Films, where he led its growth, both organically and through M&A, into Alliance Atlantis, a global leader in production, distribution, and broadcasting. Notable successes under his leadership at Alliance Atlantis included establishing the company as an early pioneer in digital specialty channels, and developing many award-winning movies and TV shows, including co-producing and co-owning the global hit CSI franchise. As controlling shareholder (via a dual-class share structure), Mr. MacMillan initiated the successful sale of Alliance Atlantis in 2007 for equity value of C$2.3 billion, a strong return on the approximately C$700 million in shareholder equity in the company.
Blue Ant’s three operating segments include:
Global Channels & Streaming, comprised of its international brand Love Nature which has one of the world’s largest library of owned and original 4K nature and wildlife programming, seven FAST channels and a connected TV ad solutions business.Blue Ant Studios, comprised of production studios focused on unscripted programming and animation and an international rights business, with offices in Toronto, Los Angeles, New York, Miami, and London, as well as an international distribution business with a library of 7800 hours of premium programming in universally-loved genres, serving more than 200 territories.Canadian Media, comprised of seven specialty channels and brands as well as multiple complementary consumer shows.
Blue Ant has an interconnected business model. Its production business creates content in core genres, much of it in Canada, which allows the company to leverage the benefits offered by Canadian production, such as tax credits and other incentives. The company’s owned Canadian and global channels engage audiences around these same genres, generating both advertising and subscription revenue across multiple platforms. Additionally, through its distribution business, Blue Ant licenses its own content to broadcasters and streamers worldwide, expanding its reach and monetizing across a variety of markets. The company also provides production services for other producers and connected TV ad solutions to advertisers.
Blue Ant’s Differentiated Business Model
Blue Ant’s business model is based on four key pillars which differentiate it from other independent content companies:
Strategic ownership of content, versus being a licensor/renter of rights, which maximizes monetization opportunities including through the creation of first run content, acquisition of complementary content libraries, and acquisition of program rights for global markets. Approximately half of its distribution library is now owned directly by Blue Ant, a significant increase from less than 20% a decade ago.A focus on content in universally-loved unscripted genres such as nature and wildlife, lifestyle, and history positions the company to capitalize on themes that have global appeal and resonate across diverse audiences. These genres are proven to travel well across markets and are evergreen, ensuring long-term revenue generation. Additionally, this content strategy aligns with the growing global demand for content on new platforms, capitalizes on the shift to connected TVs and streaming, and is more financially sustainable, as unscripted content is significantly less expensive to produce and less volatile compared to high budget scripted productions.A strategic focus on growth in international markets by engaging global audiences with distinct brands and content in order to diversify revenue streams and maximize IP monetization. For example, Love Nature content is available in more than 100 countries, distributed through various channels such as a pay TV channel or FAST channel under the Love Nature brand, a white label channel, or with its content provided in secondary windows on complementary FAST channels owned by Blue Ant. Additionally, its content is licensed to third parties for use across their TV, FAST or SVOD/AVOD platforms. Approximately 47% of Blue Ant’s revenues in fiscal 2024 came from international markets, compared to 29% in fiscal 2020. The company also benefits from its in-house production capabilities in Canada due to its cost efficiency and significant talent pool.Diversified operations generating a balanced mix of revenues from advertising, licensing, subscriptions, production services, and consumer shows. This provides a stable financial foundation and a reduced reliance on new content for growth; under 25% of the company’s revenues are generated from new productions, with more than 75% from existing businesses and content.
Positioned for Growth
With a strong financial foundation, diversified business model, and experienced leadership team, Blue Ant is strategically positioned to continue to scale its business through disciplined organic growth and M&A. The company sees a significant pipeline of M&A opportunities at attractive valuations, driven by challenges faced by over-leveraged, sub-scale, and undiversified competitors. Market dynamics including reduced commissioning by streamers and broadcasters, a shift in viewership as well as advertising spend to streaming platforms, and new global distribution models have all disrupted traditional players in the ecosystem. Blue Ant’s management believes that these evolving market trends present opportunities for companies with the right business model, experience, and ambition to capitalize on them.
Blue Ant Financial Summary
C$M
F2020
F2021
F2022
F2023
F2024
Revenues1,2
Global Channels & Streaming
14
16
30
48
56
Blue Ant Studios
28
32
52
63
81
Canadian Media
54
60
67
73
69
Inter-segment Eliminations
(8)
(8)
(14)
(15)
(10)
Total
87
100
136
169
196
Adj. EBITDA1,2,3
Global Channels & Streaming
2
3
12
18
14
Blue Ant Studios
(0)
(0)
3
0
6
Canadian Media
20
24
27
26
21
Corporate and Eliminations
(4)
(5)
(9)
(7)
(4)
Total
18
22
33
37
37
Net Income (loss)
(14)
60
13
(27)
18
Net cash provided by operating activities
12
1
3
1
14
Cash interest paid
1
4
7
Repayment of lease liability
2
1
1
1
2
Additions to property and equipment
1
3
1
2
1
Additions to intangible assets
0
0
1
1
2
As at end of period:
F2020
F2021
F2022
F2023
F2024
Bank indebtedness and promissory notes, less cash
50
24
1
33
29
Lease liabilities
1
19
18
17
15
1 From continuing operations
2 This table re-segments historical contribution from Connected TV Ad Solutions and Canadian FAST Channels into the Global Channels & Streaming segment from the Canadian Media segment. The change has no impact on total revenues or Adjusted EBITDA.
3 Non-IFRS measure. Refer to ‘Disclaimer related to non-IFRS measures’.
The Transaction is currently expected to close in early June, 2025, subject to the receipt of all required approvals, including those of the shareholders of Blue Ant and Boat Rocker Media Inc.
Further detail on the Transaction, including the required approvals and closing conditions, are provided in a separate news release issued today by Boat Rocker Media Inc., available on its website and under its profile on SEDAR+.
An information circular in respect of the RTO and the Resulting Issuer will be filed by BRMI on SEDAR+ in due course. Shareholders of Blue Ant will also receive an information package asking them to vote on the Transaction.
Conference Call Details
Blue Ant and BRMI will host a joint conference call for analysts and investors to discuss the Transaction on March 24, 2025 at 10:00 a.m. (Toronto time).
Listeners can access the call via live audio webcast (https://app.webinar.net/Nk9dO2YDblJ) or via RapidConnect (https://emportal.ink/4kO3nrl). This information can also be accessed on Blue Ant’s website at https://blueantmedia.com/ under the tab “Investor Relations” or on BRMI’s ‘s Investor Relations website under the tab “Events & Presentations: https://www.boatrocker.com/investor-relations/events-and-presentations/default.aspx” and under its profile on SEDAR+.
The conference call will also be available by dialing 1-888-699-1199 (North American toll free) or 416-945-7677 (Toronto toll free).
Listeners should access the webcast or call 10-15 minutes before the start time to ensure they are connected.
A replay will also be available until March 31, 2025 by dialing 1-888-660-6345 (North American toll free), passcode 54438#.
About Blue Ant Media Inc.
Blue Ant Media is an international production studio and rights business and channel operator. The company’s studio creates and distributes a premium slate of programming, in all content genres, for streaming and broadcasting platforms around the world. Blue Ant Media also operates free streaming and pay TV channels under several media brands internationally, including Love Nature, Cottage Life, Smithsonian Channel Canada, BBC Earth Canada, HauntTV, Homeful, Total Crime, Declassified and Love Pets. Blue Ant Media is headquartered in Toronto, with operations in Los Angeles, New York, Singapore, London, Washington and Sydney. blueantmedia.com⼁Instagram⼁LinkedIn⼁X⼁
Forward-Looking Information / Cautionary Statements
Certain information contained in this news release may be forward-looking statements within the meaning of Canadian securities laws. Forward-looking statements are often, but not always, identified by the use of words such as “expect”, “anticipate”, “believe”, “foresee”, “could”, “estimate”, “goal”, “intend”, “plan”, “seek”, “will”, “may”, “would” and “should” and similar expressions or words suggesting future outcomes. These forward-looking statements reflect material factors and expectations and assumptions of the parties. These forward-looking statements include the assumptions: that the Transaction is able to be completed on the timelines and on the terms currently anticipated; that all regulatory and other required approvals can be obtained on the timelines and in the manner currently anticipated; that the anticipated benefits of the Transaction are able to be achieved; that the businesses of both BRMI and Blue Ant will continue to operate in a manner consistent with past practice; and that the parties’ transition plans are effective.
The parties’ estimates, beliefs and assumptions are inherently subject to uncertainties and contingencies regarding future events and, as such, are subject to change. Risks and uncertainties not presently known to the parties or that they presently believe are not material could cause actual results or events to differ materially from those expressed in the forward-looking statements. Additional information on these and other factors that could affect events and results are included in other documents and reports that will be filed by BRMI with applicable securities regulatory authorities and may be accessed through the SEDAR+ website (www.sedarplus.ca). Readers are cautioned not to place undue reliance on these forward-looking statements, which reflect the parties’ expectations only as of the date of this press release. The parties disclaim any obligation to update or revise any forward-looking statements, whether as a result of new information, future events or otherwise, except as expressly required by law.
U.S. Securities Matters
None of the securities to be issued pursuant to the Transaction have been or will be registered under the United States Securities Act of 1933, as amended (the “U.S. Securities Act”), or any state securities laws. The securities to be issued in the Transaction are anticipated to be issued in reliance upon available exemptions from such registration requirements pursuant to section 3(a)(10) of the U.S. Securities Act and applicable exemptions under state securities laws. This press release does not constitute an offer to sell or the solicitation of an offer to buy any securities.
SOURCE Blue Ant Media Inc

You may like
Technology
TE Connectivity delivers 12% sales increase and over 20% EPS growth in fiscal fourth quarter
Published
17 minutes agoon
October 28, 2026By
Delivered strong full-year performance with sales growth of 15% and more than 20% EPS growth
Expects double digit sales growth in fiscal 2027
GALWAY, Ireland, Oct. 28, 2026 /PRNewswire/ — TE Connectivity plc (NYSE: TEL) today reported results for the fiscal fourth quarter and fiscal year ended September 25, 2026.
Fourth Quarter Highlights
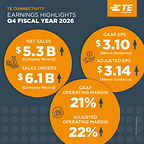
Net sales were a record $5.3 billion, an increase of 12% on a reported basis and 13% organically year over year, driven by strong growth in both the Industrial and Transportation segments.Orders of $6.1 billion, an increase of 29% year over year and 6% sequentially.GAAP diluted earnings per share (EPS) from continuing operations was $3.10, up 39% year over year. Adjusted EPS was $3.14, an increase of 21% year over year.GAAP Operating margin was 21% and adjusted operating margin was 22%, driven by strong operational performance across both segments.Cash flow from operating activities was $1.5 billion and free cash flow was $1.2 billion, with approximately $800 million returned to shareholders.
Full Year Highlights
Company delivered full-year records for sales, orders, operating margin, EPS and cash generation.Net sales were $19.9 billion, up 15% on a reported basis and 12% organically, with broad growth across the portfolio due to customer needs for increased data and power connectivity.Orders of $22.2 billion, up 27%, supporting expected double-digit sales growth in fiscal 2027.GAAP operating margin was 20% and adjusted operating margin was 22%, driven by strong operational performance.GAAP EPS was $11.07, an increase of 80%, and adjusted EPS was $11.52, up 24%Cash flow from operating activities was $4.5 billion and free cash flow was $3.4 billion.Returned approximately $2.8 billion to shareholders and committed $1.6 billion for bolt-on acquisitions in the Industrial segment to broaden the optics and power filtering portfolios.
“Our teams delivered a strong fourth quarter to finish a year in which we set records in sales, earnings and cash generation,” said CEO Terrence Curtin. “Our growth is supported by our strategic positioning of TE around accelerating data and power trends that are driving customer demand for connectivity innovations that are essential to next generation architectures. In our Industrial Solutions segment, which grew 26% in 2026, we continue to benefit from our customers’ AI investments, which create opportunities extending from inside the rack in the data center to the networking edge all the way to the energy grid.
“Entering fiscal 2027, we expect that the strong momentum from 2026 will continue as we are well positioned to keep capitalizing on growth drivers and deliver value for our shareholders. With strong orders across our businesses, we expect first quarter sales to be up mid-teens and to deliver more than 20 percent EPS growth year over year. For the full fiscal year, we expect to deliver organic sales growth that is similar to our strong performance in fiscal 2026.”
First Quarter FY27 Outlook
For the first quarter of fiscal 2027, the company expects sales of approximately $5.35 billion, up 15% on a reported and organic basis year over year. GAAP EPS from continuing operations is expected to be approximately $3.04, an increase of 20% year over year, with adjusted EPS of approximately $3.30, up 21% year over year.
Information about TE Connectivity’s use of non-GAAP financial measures is provided below. For reconciliations of these non-GAAP financial measures, see the attached tables.
Conference Call and Webcast
The company will hold a conference call for investors today beginning at 8:30 a.m. ET. The conference call may be accessed in the following ways:
At TE Connectivity’s website: investors.te.comBy telephone: For both “listen-only” participants and those participants who wish to take part in the question-and-answer portion of the call, the dial-in number in the United States is (833) 461-5787 and for international callers, the dial-in number is (585) 542-9983; meeting ID: 968971220.A replay of the conference call will be available on TE Connectivity’s investor website at investors.te.com at 11:30 a.m. ET on October 28.
About TE Connectivity
TE Connectivity plc (NYSE: TEL) is a global industrial technology leader creating a safer, sustainable, productive, and connected future. As a trusted innovation partner, our broad range of connectivity and sensor solutions enable the distribution of power, signal and data to advance next-generation transportation, energy networks, automated factories, data centers enabling artificial intelligence, and more. Our more than 100,000 employees, including 10,000 engineers, work alongside customers in approximately 130 countries. In a world that is racing ahead, TE ensures that EVERY CONNECTION COUNTS. Learn more at www.te.com and on LinkedIn, Facebook, WeChat and Instagram.
Non-GAAP Financial Measures
We present non-GAAP performance and liquidity measures as we believe it is appropriate for investors to consider adjusted financial measures in addition to results in accordance with accounting principles generally accepted in the U.S. (“GAAP”). These non-GAAP financial measures provide supplemental information and should not be considered replacements for results in accordance with GAAP. Management uses non-GAAP financial measures internally for planning and forecasting purposes and in its decision-making processes related to the operations of our company. We believe these measures provide meaningful information to us and investors because they enhance the understanding of our operating performance, ability to generate cash, and the trends of our business. Additionally, we believe that investors benefit from having access to the same financial measures that management uses in evaluating our operations. The primary limitation of these measures is that they exclude the financial impact of items that would otherwise either increase or decrease our reported results. This limitation is best addressed by using these non-GAAP financial measures in combination with the most directly comparable GAAP financial measures in order to better understand the amounts, character, and impact of any increase or decrease in reported amounts. These non-GAAP financial measures may not be comparable to similarly-titled measures reported by other companies.
The following provides additional information regarding our non-GAAP financial measures:
Organic Net Sales Growth (Decline) – represents net sales growth (decline) (the most comparable GAAP financial measure) excluding the impact of foreign currency exchange rates and acquisitions and divestitures that occurred in the preceding twelve months, if any. Organic Net Sales Growth (Decline) is a useful measure of our performance because it excludes items that are not completely under management’s control, such as the impact of changes in foreign currency exchange rates, and items that do not reflect the underlying growth of the company, such as acquisition and divestiture activity. This measure is a significant component in our incentive compensation plans.
Adjusted Operating Income and Adjusted Operating Margin – represent operating income and operating margin, respectively, (the most comparable GAAP financial measures) before special items including restructuring and other charges, acquisition-related charges, amortization expense on intangible assets, impairment of goodwill, and other income or charges, if any. We utilize these adjusted measures in combination with operating income and operating margin to assess segment level operating performance and to provide insight to management in evaluating segment operating plan execution and market conditions. Adjusted Operating Income is a significant component in our incentive compensation plans.
Adjusted Income Tax (Expense) Benefit and Adjusted Effective Tax Rate – represent income tax (expense) benefit and effective tax rate, respectively, (the most comparable GAAP financial measures) after adjusting for the tax effect of special items including restructuring and other charges, acquisition-related charges, amortization expense on intangible assets, impairment of goodwill, other income or charges, and certain significant tax items, if any.
Adjusted Income from Continuing Operations – represents income from continuing operations (the most comparable GAAP financial measure) before special items including restructuring and other charges, acquisition-related charges, amortization expense on intangible assets, impairment of goodwill, other income or charges, and certain significant tax items, if any, and, if applicable, the related tax effects.
Adjusted Earnings Per Share – represents diluted earnings per share from continuing operations (the most comparable GAAP financial measure) before special items including restructuring and other charges, acquisition-related charges, amortization expense on intangible assets, impairment of goodwill, other income or charges, and certain significant tax items, if any, and, if applicable, the related tax effects. This measure is a significant component in our incentive compensation plans.
Free Cash Flow (FCF) – is a useful measure of our ability to generate cash. The difference between net cash provided by operating activities (the most comparable GAAP financial measure) and Free Cash Flow consists mainly of significant cash outflows and inflows that we believe are useful to identify. We believe Free Cash Flow provides useful information to investors as it provides insight into the primary cash flow metric used by management to monitor and evaluate cash flows generated from our operations. Free Cash Flow is defined as net cash provided by operating activities excluding voluntary pension contributions and the cash impact of special items, if any, minus net capital expenditures. Voluntary pension contributions are excluded from the GAAP financial measure because this activity is driven by economic financing decisions rather than operating activity. Certain special items, including cash paid (collected) pursuant to collateral requirements related to cross-currency swap contracts, are also excluded by management in evaluating Free Cash Flow. Net capital expenditures consist of capital expenditures less proceeds from the sale of property, plant, and equipment. These items are subtracted because they represent long-term commitments. In the calculation of Free Cash Flow, we subtract certain cash items that are ultimately within management’s and the Board of Directors’ discretion to direct and may imply that there is less or more cash available for our programs than the most comparable GAAP financial measure indicates. It should not be inferred that the entire Free Cash Flow amount is available for future discretionary expenditures, as our definition of Free Cash Flow does not consider certain non-discretionary expenditures, such as debt payments. In addition, we may have other discretionary expenditures, such as discretionary dividends, share repurchases, and business acquisitions, that are not considered in the calculation of Free Cash Flow.
Forward-Looking Statements
This release contains certain “forward-looking statements” within the meaning of the U.S. Private Securities Litigation Reform Act of 1995. These statements are based on management’s current expectations and are subject to risks, uncertainty and changes in circumstances, which may cause actual results, performance, financial condition or achievements to differ materially from anticipated results, performance, financial condition or achievements. All statements contained herein that are not clearly historical in nature are forward-looking and the words “anticipate,” “believe,” “expect,” “estimate,” “plan,” and similar expressions are generally intended to identify forward-looking statements. We have no intention and are under no obligation to update or alter (and expressly disclaim any such intention or obligation to do so) our forward-looking statements whether as a result of new information, future events or otherwise, except to the extent required by law. The forward-looking statements in this release include statements addressing our future financial condition and operating results. Examples of factors that could cause actual results to differ materially from those described in the forward-looking statements include, among others, the extent, severity and duration of business interruptions negatively affecting our business operations; business, economic, competitive and regulatory risks, such as conditions affecting demand for products in the automotive and other industries we serve; competition and pricing pressure; fluctuations in foreign currency exchange rates and commodity prices; natural disasters and political, economic and military instability in countries in which we operate, including continuing military conflict in certain parts of the world; developments in the credit markets; future goodwill impairment; compliance with current and future environmental and other laws and regulations; and the possible effects on us of changes in tax laws, tax treaties and other legislation. More detailed information about these and other factors is set forth in TE Connectivity plc’s Annual Report on Form 10-K for the fiscal year ended Sept 26, 2025, as well as in our Quarterly Reports on Form 10-Q, Current Reports on Form 8-K and other reports filed by us with the U.S. Securities and Exchange Commission.
TE CONNECTIVITY PLC
CONSOLIDATED STATEMENTS OF OPERATIONS (UNAUDITED)
For the Quarters Ended
For the Years Ended
September 25,
September 26,
September 25,
September 26,
2026
2025
2026
2025
(in millions, except per share data)
Net sales
$
5,312
$
4,749
$
19,885
$
17,262
Cost of sales
3,425
3,089
12,679
11,183
Gross margin
1,887
1,660
7,206
6,079
Selling, general, and administrative expenses
518
494
2,124
1,866
Research, development, and engineering expenses
250
227
942
829
Acquisition and integration costs
12
6
32
47
Restructuring and other charges, net
14
17
117
126
Operating income
1,093
916
3,991
3,211
Interest income
23
21
90
83
Interest expense
(31)
(29)
(124)
(77)
Other expense, net
(9)
(11)
(7)
(13)
Income from continuing operations before income taxes
1,076
897
3,950
3,204
Income tax expense
(175)
(233)
(695)
(1,361)
Income from continuing operations
901
664
3,255
1,843
Loss from discontinued operations, net of income taxes
(1)
(1)
(2)
(1)
Net income
$
900
$
663
$
3,253
$
1,842
Basic earnings per share:
Income from continuing operations
$
3.12
$
2.25
$
11.15
$
6.21
Loss from discontinued operations
—
—
(0.01)
—
Net income
3.11
2.25
11.14
6.20
Diluted earnings per share:
Income from continuing operations
$
3.10
$
2.23
$
11.07
$
6.16
Loss from discontinued operations
—
—
(0.01)
—
Net income
3.09
2.22
11.06
6.16
Weighted-average number of shares outstanding:
Basic
289
295
292
297
Diluted
291
298
294
299
TE CONNECTIVITY PLC
CONSOLIDATED BALANCE SHEETS (UNAUDITED)
September 25,
September 26,
2026
2025
(in millions, except share data)
Assets
Current assets:
Cash and cash equivalents
$
1,697
$
1,255
Accounts receivable, net of allowance for doubtful accounts of $55 and $44, respectively
3,839
3,403
Inventories
2,962
2,699
Prepaid expenses and other current assets
785
609
Total current assets
9,283
7,966
Property, plant, and equipment, net
4,637
4,312
Goodwill
7,420
7,126
Intangible assets, net
2,031
2,227
Deferred income taxes
2,128
2,507
Other assets
1,173
943
Total assets
$
26,672
$
25,081
Liabilities, redeemable noncontrolling interests, and shareholders’ equity
Current liabilities:
Short-term debt
$
502
$
852
Accounts payable
2,455
2,021
Accrued and other current liabilities
2,407
2,247
Total current liabilities
5,364
5,120
Long-term debt
5,137
4,842
Long-term pension and postretirement liabilities
625
767
Deferred income taxes
246
198
Income taxes
346
414
Other liabilities
1,231
1,010
Total liabilities
12,949
12,351
Commitments and contingencies
Redeemable noncontrolling interests
150
145
Shareholders’ equity:
Preferred shares, $1.00 par value, 2 shares authorized, none outstanding
—
—
Ordinary class A shares, €1.00 par value, 25,000 shares authorized, none outstanding
—
—
Ordinary shares, $0.01 par value, 1,500,000,000 shares authorized, 296,288,773 and 302,889,075
shares issued, respectively
3
3
Accumulated earnings
15,244
13,932
Ordinary shares held in treasury, at cost, 8,788,224 and 8,330,931 shares, respectively
(1,892)
(1,356)
Accumulated other comprehensive income
218
6
Total shareholders’ equity
13,573
12,585
Total liabilities, redeemable noncontrolling interests, and shareholders’ equity
$
26,672
$
25,081
TE CONNECTIVITY PLC
CONSOLIDATED STATEMENTS OF CASH FLOWS (UNAUDITED)
For the Quarters Ended
For the Years Ended
September 25,
September 26,
September 25,
September 26,
2026
2025
2026
2025
(in millions)
Cash flows from operating activities:
Net income
$
900
$
663
$
3,253
$
1,842
Loss from discontinued operations, net of income taxes
1
1
2
1
Income from continuing operations
901
664
3,255
1,843
Adjustments to reconcile income from continuing operations to net cash
provided by operating activities:
Depreciation and amortization
275
244
1,033
838
Deferred income taxes
60
166
321
938
Non-cash lease cost
41
39
159
145
Provision for losses on accounts receivable and inventories
10
(4)
71
58
Share-based compensation expense
38
44
168
149
Other
14
20
(37)
80
Changes in assets and liabilities, net of the effects of acquisitions and
divestitures:
Accounts receivable, net
(227)
50
(582)
(341)
Inventories
49
139
(316)
(160)
Prepaid expenses and other current assets
54
60
92
91
Accounts payable
162
(8)
595
290
Accrued and other current liabilities
132
41
(108)
(35)
Income taxes
14
(25)
(80)
147
Other
5
(9)
(46)
96
Net cash provided by operating activities
1,528
1,421
4,525
4,139
Cash flows from investing activities:
Capital expenditures
(290)
(271)
(1,122)
(936)
Proceeds from sale of property, plant, and equipment
3
4
9
11
Acquisition of businesses, net of cash acquired
(12)
—
(212)
(2,628)
Other
(3)
(3)
(9)
(15)
Net cash used in investing activities
(302)
(270)
(1,334)
(3,568)
Cash flows from financing activities:
Net increase (decrease) in commercial paper
—
—
100
(255)
Proceeds from issuance of debt
—
—
750
2,231
Repayment of debt
(1)
—
(852)
(580)
Proceeds from exercise of share options
3
81
82
182
Repurchase of ordinary shares
(544)
(437)
(1,892)
(1,347)
Payment of ordinary share dividends to shareholders
(226)
(209)
(869)
(803)
Other
(1)
(1)
(68)
(57)
Net cash used in financing activities
(769)
(566)
(2,749)
(629)
Effect of currency translation on cash
1
(2)
—
(6)
Net increase (decrease) in cash, cash equivalents, and restricted cash
458
583
442
(64)
Cash, cash equivalents, and restricted cash at beginning of period
1,239
672
1,255
1,319
Cash, cash equivalents, and restricted cash at end of period
$
1,697
$
1,255
$
1,697
$
1,255
Supplemental cash flow information:
Interest paid on debt, net
$
28
$
21
$
110
$
34
Income taxes paid, net of refunds
101
92
454
276
TE CONNECTIVITY PLC
RECONCILIATION OF FREE CASH FLOW (UNAUDITED)
For the Quarters Ended
For the Years Ended
September 25,
September 26,
September 25,
September 26,
2026
2025
2026
2025
(in millions)
Net cash provided by operating activities
$
1,528
$
1,421
$
4,525
$
4,139
Capital expenditures, net
(287)
(267)
(1,113)
(925)
Free cash flow (1)
$
1,241
$
1,154
$
3,412
$
3,214
(1) Free cash flow is a non-GAAP financial measure. See description of non-GAAP financial measures.
TE CONNECTIVITY PLC
SEGMENT DATA (UNAUDITED)
For the Quarters Ended
For the Years Ended
September 25,
September 26,
September 25,
September 26,
2026
2025
2026
2025
($ in millions)
Net Sales
Net Sales
Net Sales
Net Sales
Transportation Solutions
$
2,600
$
2,413
$
10,069
$
9,388
Industrial Solutions
2,799
2,336
9,903
7,874
Reconciling item (1)
(87)
—
(87)
—
Total
$
5,312
$
4,749
$
19,885
$
17,262
Operating
Operating
Operating
Operating
Operating
Operating
Operating
Operating
Income
Margin
Income
Margin
Income
Margin
Income
Margin
Transportation Solutions
$
521
20.0
%
$
465
19.3
%
$
1,969
19.6
%
$
1,818
19.4
%
Industrial Solutions
568
20.3
451
19.3
2,018
20.4
1,393
17.7
Reconciling item (2)
4
—
4
—
Total
$
1,093
20.6
%
$
916
19.3
%
$
3,991
20.1
%
$
3,211
18.6
%
Adjusted
Adjusted
Adjusted
Adjusted
Adjusted
Adjusted
Adjusted
Adjusted
Operating
Operating
Operating
Operating
Operating
Operating
Operating
Operating
Income (3)
Margin (3)
Income (3)
Margin (3)
Income (3)
Margin (3)
Income (3)
Margin (3)
Transportation Solutions
$
545
21.0
%
$
487
20.2
%
$
2,131
21.2
%
$
1,963
20.9
%
Industrial Solutions
627
22.4
514
22.0
2,235
22.6
1,621
20.6
Reconciling item (2)
4
—
4
—
Total
$
1,176
22.1
%
$
1,001
21.1
%
$
4,370
22.0
%
$
3,584
20.8
%
(1) Reconciling item relates to IEEPA tariff refunds received in fiscal 2026 that are expected to be returned to customers.
(2) Reconciling item relates to the net impact of IEEPA tariff refunds received in fiscal 2026.
(3) Adjusted operating income and adjusted operating margin are non-GAAP financial measures. See description of non-GAAP financial measures.
TE CONNECTIVITY PLC
RECONCILIATION OF NET SALES GROWTH (DECLINE) (UNAUDITED)
Change in Net Sales for the Quarter Ended September 25, 2026
versus Net Sales for the Quarter Ended September 26, 2025
Net Sales
Organic Net Sales
Translation
Growth (Decline)
Growth (Decline) (1)
and Other (2)
Acquisitions
($ in millions)
Transportation Solutions:
Automotive
$
127
7.0
%
$
107
5.9
%
$
20
$
—
Commercial transportation
65
17.9
64
17.8
1
—
Sensors
(5)
(2.0)
(4)
(1.7)
(1)
—
Total Transportation Solutions
187
7.7
167
6.9
20
—
Industrial Solutions:
Digital data networks
242
34.2
246
34.4
(4)
—
Automation and connected living
103
17.6
101
17.6
2
—
Energy
55
11.8
54
11.7
1
—
Aerospace, defense, and marine
61
15.2
63
16.0
(2)
—
Medical
2
1.1
3
1.3
(1)
—
Total Industrial Solutions
463
19.8
467
20.0
(4)
—
Reconciling item (3)
(87)
—
(87)
—
Total
$
563
11.9
%
$
634
13.4
%
$
(71)
$
—
Change in Net Sales for the Year Ended September 25, 2026
versus Net Sales for the Year Ended September 26, 2025
Net Sales
Organic Net Sales
Translation
Growth (Decline)
Growth (Decline) (1)
and Other (2)
Acquisitions
($ in millions)
Transportation Solutions:
Automotive
$
417
5.9
%
$
212
3.0
%
$
205
$
—
Commercial transportation
264
19.3
233
17.1
31
—
Sensors
—
—
(22)
(2.4)
22
—
Total Transportation Solutions
681
7.3
423
4.5
258
—
Industrial Solutions:
Digital data networks
975
44.2
961
43.5
14
—
Automation and connected living
333
15.5
281
13.1
51
1
Energy
543
40.4
243
18.1
29
271
Aerospace, defense, and marine
187
12.6
163
11.0
24
—
Medical
(9)
(1.3)
(9)
(1.3)
—
—
Total Industrial Solutions
2,029
25.8
1,639
20.8
118
272
Reconciling item (3)
(87)
—
(87)
—
Total
$
2,623
15.2
%
$
2,062
11.9
%
$
289
$
272
(1) Organic net sales growth (decline) is a non-GAAP financial measure. See description of non-GAAP financial measures.
(2) Represents the change in net sales resulting from changes in foreign currency exchange rates and IEEPA tariff refunds.
(3) Reconciling item relates to IEEPA tariff refunds received in fiscal 2026 that are expected to be returned to customers.
TE CONNECTIVITY PLC
RECONCILIATION OF NON-GAAP FINANCIAL MEASURES TO GAAP FINANCIAL MEASURES
For the Quarter Ended September 25, 2026
(UNAUDITED)
Adjustments
Acquisition-
Restructuring
Related
and Other
Amortization
Adjusted
U.S. GAAP
Charges (1)
Charges, Net (1)
Expense (1)
Tax Items (2)
(Non-GAAP) (3)
($ in millions, except per share data)
Operating income:
Transportation Solutions
$
521
$
1
$
5
$
18
$
—
$
545
Industrial Solutions
568
11
9
39
—
627
Reconciling item (4)
4
—
—
—
—
4
Total
$
1,093
$
12
$
14
$
57
$
—
$
1,176
Operating margin
20.6
%
22.1
%
Income tax expense
$
(175)
$
(2)
$
2
$
(11)
$
(59)
$
(245)
Effective tax rate
16.3
%
21.1
%
Income from continuing operations
$
901
$
10
$
16
$
46
$
(59)
$
914
Diluted earnings per share from
continuing operations
$
3.10
$
0.03
$
0.05
$
0.16
$
(0.20)
$
3.14
(1) The tax effect of each non-GAAP adjustment is calculated based on the jurisdictions in which the expense (income) is incurred and the tax laws in effect for
each such jurisdiction.
(2) Represents a $59 million income tax benefit related to a decrease in the valuation allowance for certain tax loss and credit carryforwards.
(3) See description of non-GAAP financial measures.
(4) Reconciling item relates to the net impact of IEEPA tariff refunds received in fiscal 2026.
TE CONNECTIVITY PLC
RECONCILIATION OF NON-GAAP FINANCIAL MEASURES TO GAAP FINANCIAL MEASURES
For the Quarter Ended September 26, 2025
(UNAUDITED)
Adjustments
Acquisition-
Restructuring
Related
and Other
Amortization
Adjusted
U.S. GAAP
Charges (1)
Charges, Net (1)
Expense (1)
Tax Items (2)
(Non-GAAP) (3)
($ in millions, except per share data)
Operating income:
Transportation Solutions
$
465
$
—
$
3
$
19
$
—
$
487
Industrial Solutions
451
10
14
39
—
514
Total
$
916
$
10
$
17
$
58
$
—
$
1,001
Operating margin
19.3
%
21.1
%
Income tax expense
$
(233)
$
(2)
$
6
$
(11)
$
31
$
(209)
Effective tax rate
26.0
%
21.3
%
Income from continuing operations
$
664
$
8
$
23
$
47
$
31
$
773
Diluted earnings per share from
continuing operations
$
2.23
$
0.03
$
0.08
$
0.16
$
0.10
$
2.59
(1) The tax effect of each non-GAAP adjustment is calculated based on the jurisdictions in which the expense (income) is incurred and the tax laws in effect for
each such jurisdiction.
(2) Represents income tax expense of $44 million related to an increase in the valuation allowance for certain U.S. tax loss and credit carryforwards and an income
tax benefit of $13 million related to the revaluation of deferred tax liabilities as a result of a decrease in the corporate tax rate in a non-U.S. jurisdiction.
(3) See description of non-GAAP financial measures.
TE CONNECTIVITY PLC
RECONCILIATION OF NON-GAAP FINANCIAL MEASURES TO GAAP FINANCIAL MEASURES
For the Year Ended September 25, 2026
(UNAUDITED)
Adjustments
Acquisition-
Restructuring
Related
and Other
Amortization
Adjusted
U.S. GAAP
Charges (1)
Charges, Net (1)
Expense (1)
Tax Items (2)
(Non-GAAP) (3)
($ in millions, except per share data)
Operating income:
Transportation Solutions
$
1,969
$
2
$
89
$
71
$
—
$
2,131
Industrial Solutions
2,018
33
28
156
—
2,235
Reconciling item (4)
4
—
—
—
—
4
Total
$
3,991
$
35
$
117
$
227
$
—
$
4,370
Operating margin
20.1
%
22.0
%
Income tax expense
$
(695)
$
(7)
$
(21)
$
(45)
$
(173)
$
(941)
Effective tax rate
17.6
%
21.7
%
Income from continuing operations
$
3,255
$
28
$
96
$
182
$
(173)
$
3,388
Diluted earnings per share from
continuing operations
$
11.07
$
0.10
$
0.33
$
0.62
$
(0.59)
$
11.52
(1) The tax effect of each non-GAAP adjustment is calculated based on the jurisdictions in which the expense (income) is incurred and the tax laws in effect for
each such jurisdiction.
(2) Represents a $114 million net income tax benefit related primarily to the settlement of prior period tax matters and a $59 million income tax benefit related to a
decrease in the valuation allowance for certain tax loss and credit carryforwards.
(3) See description of non-GAAP financial measures.
(4) Reconciling item relates to the net impact of IEEPA tariff refunds received in fiscal 2026.
TE CONNECTIVITY PLC
RECONCILIATION OF NON-GAAP FINANCIAL MEASURES TO GAAP FINANCIAL MEASURES
For the Year Ended September 26, 2025
(UNAUDITED)
Adjustments
Acquisition-
Restructuring
Related
and Other
Amortization
Adjusted
U.S. GAAP
Charges (1)
Charges, Net (1)
Expense (1)
Tax Items (2)
(Non-GAAP) (3)
($ in millions, except per share data)
Operating income:
Transportation Solutions
$
1,818
$
—
$
75
$
70
$
—
$
1,963
Industrial Solutions
1,393
57
51
120
—
1,621
Total
$
3,211
$
57
$
126
$
190
$
—
$
3,584
Operating margin
18.6
%
20.8
%
Income tax expense
$
(1,361)
$
(12)
$
(13)
$
(37)
$
618
$
(805)
Effective tax rate
42.5
%
22.5
%
Income from continuing operations
$
1,843
$
45
$
113
$
153
$
618
$
2,772
Diluted earnings per share from
continuing operations
$
6.16
$
0.15
$
0.38
$
0.51
$
2.07
$
9.27
(1) The tax effect of each non-GAAP adjustment is calculated based on the jurisdictions in which the expense (income) is incurred and the tax laws in effect for
each such jurisdiction.
(2) Represents income tax expense of $574 million related to a net increase in the valuation allowance for certain deferred tax assets associated with a ten-year tax
credit obtained by a Swiss subsidiary in fiscal 2024 as well as income tax expense of $44 million related to an increase in the valuation allowance for certain U.S.
tax loss and credit carryforwards.
(3) See description of non-GAAP financial measures.
TE CONNECTIVITY PLC
RECONCILIATION OF NON-GAAP FINANCIAL MEASURES TO GAAP FINANCIAL MEASURES
For the Quarter Ended December 26, 2025
(UNAUDITED)
Adjustments
Acquisition-
Restructuring
Related
and Other
Amortization
Adjusted
U.S. GAAP
Charges (1)
Charges, Net (1)
Expense (1)
(Non-GAAP) (2)
($ in millions, except per share data)
Operating income:
Transportation Solutions
$
501
$
—
$
4
$
18
$
523
Industrial Solutions
462
6
6
39
513
Total
$
963
$
6
$
10
$
57
$
1,036
Operating margin
20.6
%
22.2
%
Income tax expense
$
(210)
$
(1)
$
(3)
$
(11)
$
(225)
Effective tax rate
21.9
%
21.8
%
Income from continuing operations
$
751
$
5
$
7
$
46
$
809
Diluted earnings per share from
continuing operations
$
2.53
$
0.02
$
0.02
$
0.15
$
2.72
(1) The tax effect of each non-GAAP adjustment is calculated based on the jurisdictions in which the expense (income) is incurred and the tax laws in
effect for each such jurisdiction.
(2) See description of non-GAAP financial measures.
TE CONNECTIVITY PLC
RECONCILIATION OF FORWARD-LOOKING NON-GAAP FINANCIAL MEASURES
TO FORWARD-LOOKING GAAP FINANCIAL MEASURES
As of October 28, 2026
(UNAUDITED)
Outlook for
Quarter Ending
December 25,
2026
Diluted earnings per share from continuing operations
$
3.04
Acquisition-related charges
0.06
Restructuring and other charges, net
0.05
Amortization expense
0.15
Adjusted diluted earnings per share from continuing operations (1)
$
3.30
Net sales growth
14.6
%
Translation and other (2)
0.7
(Acquisitions) divestitures, net
—
Organic net sales growth (1)
15.3
%
(1) See description of non-GAAP financial measures.
(2) Includes IEEPA tariff refunds expected to be received in fiscal 2027 and returned to customers.
View original content to download multimedia:https://www.prnewswire.com/news-releases/te-connectivity-delivers-12-sales-increase-and-over-20-eps-growth-in-fiscal-fourth-quarter-302921354.html
SOURCE TE Connectivity plc
Technology
Securitize to Integrate with Stellar Network
Published
17 minutes agoon
October 28, 2026By

Integration will enable Securitize to support future tokenized financial products on the Stellar network, expanding blockchain options for institutional asset managers
MIAMI, Oct. 28, 2026 /PRNewswire/ — Securitize, Inc. (NYSE: SECZ), the leading platform for tokenized assets, today announced plans to integrate with the Stellar network, expanding the blockchain infrastructure available to institutional asset managers seeking to bring traditional financial products onchain.
The integration will enable Securitize to support the issuance and management of tokenized financial assets on the Stellar network, a blockchain network designed for efficient financial transactions and asset transfers. The announcement was made in conjunction with Meridian 2026, the Stellar Development Foundation’s annual conference in Lisbon, Portugal.
The planned integration reflects Securitize’s continued commitment to providing institutional asset managers with flexible blockchain infrastructure while maintaining the regulatory and operational standards required for traditional financial products.
“The Stellar network has built the fourth-largest ecosystem1 for tokenized real-world assets, which speaks to the strength of its network and the growing institutional demand for tokenization,” said Carlos Domingo, Co-Founder and CEO of Securitize. “We’re excited to integrate with the Stellar network and bring Securitize’s regulated infrastructure to an ecosystem that is already helping drive the adoption of tokenized financial products.”
The Stellar network has an established ecosystem for tokenized financial assets, with network capabilities supporting asset issuance, fast settlement and features designed to support regulated use cases. The integration is intended to broaden the range of blockchain networks Securitize can support as institutional adoption of tokenization continues to develop.
“Securitize has helped establish tokenization as a practical solution for major financial institutions,” said Denelle Dixon, CEO and Executive Director of the Stellar Development Foundation. “We’re excited to work together to expand the infrastructure available to asset managers and support the next generation of tokenized financial products on Stellar.”
Securitize works with leading global asset managers to bring traditional financial products onchain, supported by its regulated financial infrastructure and tokenization technology. The planned Stellar network integration further extends the company’s multichain approach, giving institutional partners greater flexibility in selecting blockchain networks that meet their operational and distribution needs.
Additional details about assets supported through the integration will be announced as they become available.
About the Stellar Network
The Stellar network is a decentralized, fast, and scalable blockchain built for financial products and services. It enables smart contracts and supports issuing, managing, and moving real-world regulated assets at institutional scale.
Assets can be fully decentralized or configured for KYC, clawbacks, and sanctions compliance. Franklin Templeton runs a tokenized money market fund on Stellar, and MoneyGram moves money across it daily.
Open means no vendor lock-in. Configurable means enterprise-ready. The Stellar network has been servicing payments and financial use cases since 2014.
About Securitize
Securitize (NYSE: SECZ), the leading platform for tokenized assets with approximately $5B in tokenized securities on its platform as of September 30, 2026, is bringing the world onchain through tokenized assets, working with top-tier asset managers such as Apollo, BlackRock, BNY, Hamilton Lane, KKR, VanEck and others. It is the only company operating regulated digital-securities infrastructure in both the U.S. and EU, and has been named to the Forbes 2026 Fintech 50 and CNBC World’s Top Fintech Companies 2026 lists.
For more information, please visit:
Website | X/Twitter | LinkedIn
Contacts
Tom Murphy
press@securitize.io
Sam Ross
investor.relations@securitize.io
Source: Securitize (NYSE: SECZ) (XNYS:SECZ)
Disclosures
Securitize’s regulated services are provided through its subsidiaries, including Securitize Markets, LLC, a, SEC-registered broker-dealer; Securitize Transfer Agent, LLC, an SEC-registered transfer agent; Securitize Capital LLC, an SEC-registered investment adviser; and Securitize Europe Brokerage and Markets, S.V., S.A., a Spanish investment firm authorized, registered and supervised by the Spanish National Securities Market Commission.
Forward-Looking Statements
This press release contains forward-looking statements within the meaning of the Private Securities Litigation Reform Act of 1995, including statements about Securitize’s planned integration with the Stellar network and its anticipated timing and benefits. These statements are based on current expectations and are subject to risks and uncertainties that could cause actual results to differ materially, including that the integration may be delayed, changed or not completed; risks relating to the Stellar network and other third-party blockchain networks; demand for tokenized products; changes in regulation; and the risks described under “Risk Factors” in Securitize’s filings with the SEC. Securitize undertakes no obligation to update these statements, except as required by law.
1 Based on distributed tokenized real-world asset value reported by rwa.xyz as of October 22, 2026. Rankings and values are subject to change.
View original content to download multimedia:https://www.prnewswire.com/news-releases/securitize-to-integrate-with-stellar-network-302921595.html
SOURCE Securitize
Technology
One in Four Supply Chain Leaders Regret Their Warehouse Automation Decision, and 94% Say Switching Would Be Prohibitively Expensive
Published
17 minutes agoon
October 28, 2026By

Exotec research traces “robot regret” to three decisions buyers make before the contract is signed: cost, accountability and readiness
ATLANTA, Oct. 28, 2026 /PRNewswire/ — Exotec, a global warehouse robotics provider, today released Avoid Robot Regret: What Separates Automation That Delivers from Automation That Disappoints, based on a survey of 250 supply chain decision-makers across the United States and Canada. The findings reveal a gap between what buyers expect from automation and what they get, with one in four supply chain leaders saying they wish they had gone a different way. However, once they made the decision, 94% said switching providers would be prohibitively expensive, leaving most buyers with the system they chose for the next 10 to 15 years.
Larger budgets and bigger teams don’t prevent the problem. Companies with over $1 billion in revenue were more likely to say their most significant automation investment underperformed compared to those with less than $1 billion in revenue (21% vs. 13%). Across the survey, regret traced back to three decisions made before implementation: underestimating lifetime ownership cost, leaving accountability for issue resolution unclear, and implementing automation before the operation was ready.
Lifetime cost. Sixty-five percent of leaders say total cost of ownership came in higher than expected. Seventy percent say undisclosed costs have raised their annual maintenance spend. Among respondents whose systems underperformed, 43% said total costs ran 26% to 100% above expectations.
Clear accountability for performance. Sixty percent of respondents had a system designed by more than one company, and one in seven say they haven’t seen the benefits of automation because no vendor takes full responsibility for performance. Buyers who worked directly with the equipment manufacturer rated the speed of root-cause identification higher than other buyers (75% vs. 69%).
Timing. More than a quarter (27%) say their operation wasn’t ready when they invested. Early adopters with dedicated automation teams and leadership oversight rarely regretted their choice: 1% say they picked the wrong vendor, compared with 11% of fast followers.
“What we heard from supply chain leaders is that regret is rarely about the technology itself,” said Romain Moulin, CEO and co-founder of Exotec. “It starts when a system built by several vendors stops working as one, and the customer is left figuring out who is responsible for the fix. The operations that get the most from their automation are the ones where a single partner owns the whole system performance, from design through the years it runs.”
Buyers who chose low-cost providers report regret most often. They were nearly five times as likely to say they picked the wrong vendor (24% vs. 5% of other buyers), and only 52% rated root-cause identification as fast, compared with 74% of other buyers. Across all respondents, 59% say low-cost providers hide costs and common complications upfront, and 22% say their vendor didn’t deliver what it promised during the sales process.
Additional findings from the report
Automation is now table stakes. 91% of supply chain leaders say automation is now a basic requirement, and 86% of those who have automated say they head into peak season more confident than before.AI use is near-universal, maturity is not. 99% of organizations use AI in some form, but 24% are still in the pilot phase.Humanoids trail purpose-built robots on expected ROI. Most respondents (77%) trust purpose-built fulfillment automation to deliver better ROI than humanoids in the next five years, though 48% say they’re optimistic about implementing humanoids.
Exotec conducted this research using an online survey prepared by Method Research and distributed by RepData among n=250 supply chain decision-makers working full-time in North America (Canada and United States) who oversee and have influence over automation solutions in their warehouses and organizations. Data was collected August 17 to 31, 2026.
To read the full report, click here.
About Exotec
Exotec is a global warehouse automation leader delivering flexible, reliable end-to-end robotic solutions for modern fulfillment operations. By designing and manufacturing its own technology and solutions, Exotec serves as a single automation provider, reducing complexity and risk while accelerating time to value compared to traditional systems. Over 75 industry-leading brands including Oxford Industries (Tommy Bahama, Lilly Pulitzer), Carrefour, Decathlon, and UNIQLO trust Exotec to improve operations across 200+ sites worldwide.
View original content to download multimedia:https://www.prnewswire.com/news-releases/one-in-four-supply-chain-leaders-regret-their-warehouse-automation-decision-and-94-say-switching-would-be-prohibitively-expensive-302921670.html
SOURCE Exotec


TE Connectivity delivers 12% sales increase and over 20% EPS growth in fiscal fourth quarter

Securitize to Integrate with Stellar Network

One in Four Supply Chain Leaders Regret Their Warehouse Automation Decision, and 94% Say Switching Would Be Prohibitively Expensive

Send Rakhi to UK swiftly with UK Gifts Portal

Whiteboard Series with NEAR | Ep: 45 Joel Thorstensson from ceramic.network

Nullmax and Renesas Forge Strategic Partnership to Deliver Competitive ADAS Solutions for the Global Market

Why You Should Build on #NEAR – Co-founder Illia Polosukhin at CV Labs
Whiteboard Series with NEAR | Ep: 45 Joel Thorstensson from ceramic.network

NEAR End of Year Town Hall 2021: The Open Web World, MetaBUILD 2 Hackathon and 2021 recap
Trending
-

 Technology5 days ago
Miami Startup BOB Raises $5.5M To Build An AI-Powered Banking Platform
-

 Technology5 days ago
Kin Becomes First U.S. Home Insurer to Enable WebMCP for AI Shopping
-

 Coin Market5 days ago
Wells Fargo and five others object to OKX-ICE tokenized stock listings: Report
-

 Coin Market5 days ago
IRS plans lower tax disclosure penalties, including for crypto: Forbes
-

 Technology5 days ago
Enigmata Joins Finovifi Marketplace to Support AI Data Protection and Privacy-Preserving Analytics
-
 Technology5 days ago
Modern Wealth Law Founder John Wong Recognized for Over 10 Years as a State Bar of California Certified Specialist
-

 Technology5 days ago
City of Hope Cancer Center Chicago Unites Industry Leaders for Health Technology Innovation Roundtable
-

 Technology5 days ago
Meridian Credit Union Named Winner of Best Digital Transformation Program – Canada in 2026