
Technology
TE Connectivity delivers sales and EPS above guidance in second quarter of fiscal year 2025
Published
1 year agoon
By
Third quarter guidance reflects continued momentum and Richards acquisition
GALWAY, Ireland, April 23, 2025 /PRNewswire/ — TE Connectivity plc (NYSE: TEL) today reported results for the fiscal second quarter ended Mar. 28, 2025.
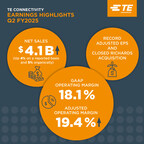
Second Quarter Highlights
Net sales were $4.1 billion, up 4% on a reported basis year over year and 5% organically driven by double digit growth in the Industrial segment.GAAP diluted earnings per share (EPS) from continuing operations was $0.04, which includes a one-time non-cash tax charge due to a change in tax law in the second quarter of 2025. Adjusted EPS was $2.10, a company record and up approximately 13% year over year.Orders were $4.25 billion, up 6% both year over year and sequentially.Operating margin was 18.1% and adjusted operating margin was 19.4%, driven by strong operational performance in both segments.Cash flow from operating activities during the first half of the fiscal year was $1.5 billion and free cash flow was approximately $1.1 billion.Returned approximately $1 billion to shareholders and announced a 9% dividend increase.Richards Manufacturing Co. acquisition completed in April to capitalize on strong growth opportunities in the North American utility market.Issued One Connected World corporate responsibility report, highlighted by an 80% reduction in Scope 1 & 2 greenhouse gas emissions during the past four years.
“Our teams delivered strong operational performance that led to record adjusted EPS and results that exceeded our guidance on both sales and earnings,” said TE Connectivity CEO Terrence Curtin. “Our Transportation segment continued to execute well, capitalizing on our leading position in Asia and maintaining strong margin performance. Our Industrial segment expanded its operating margin on sales growth of 17%, driven by broad business growth and ongoing momentum in AI, aerospace and energy applications.
“Due to our long-standing business strategy and investments to locate manufacturing facilities near customers, we expect to effectively navigate the current trade environment. Our ongoing momentum and ability to pull operational levers gives us confidence in our third quarter guidance for year-over-year improvement in sales and EPS. We are well positioned for the current uncertain macroeconomic environment and remain focused on innovating in long-term industrial technology growth trends and creating value for both our customers and owners.”
Third Quarter FY25 Outlook
For the third quarter of fiscal 2025, the company expects net sales of approximately $4.30 billion, up 8% year over year. GAAP EPS from continuing operations is expected to be approximately $2.02, up nearly 9% year over year, with adjusted EPS of approximately $2.06, up 8% year over year. Third quarter guidance includes the benefit from the Richards acquisition and tariff impact assumptions, as well as tax rate headwinds of $0.04 on a year over year basis and $0.06 sequentially.
Information about TE Connectivity’s use of non-GAAP financial measures is provided below. For reconciliations of these non-GAAP financial measures, see the attached tables.
Conference Call and Webcast
The company will hold a conference call for investors today beginning at 8:30 a.m. ET. The conference call may be accessed in the following ways:
At TE Connectivity’s website: investors.te.comBy telephone: For both “listen-only” participants and those participants who wish to take part in the question-and-answer portion of the call, the dial-in number in the United States is (800) 715-9871 and for international callers, the dial-in number is (646) 307-1963.A replay of the conference call will be available on TE Connectivity’s investor website at investors.te.com at 11:30 a.m. ET on April 23.
About TE Connectivity
TE Connectivity plc (NYSE: TEL) is a global industrial technology leader creating a safer, sustainable, productive, and connected future. Our broad range of connectivity and sensor solutions enable the distribution of power, signal and data to advance next-generation transportation, energy networks, automated factories, data centers, medical technology and more. With more than 85,000 employees, including 9,000 engineers, working alongside customers in approximately 130 countries, TE ensures that EVERY CONNECTION COUNTS. Learn more at www.te.com and on LinkedIn, Facebook, WeChat, Instagram and X (formerly Twitter).
Non-GAAP Financial Measures
We present non-GAAP performance and liquidity measures as we believe it is appropriate for investors to consider adjusted financial measures in addition to results in accordance with accounting principles generally accepted in the U.S. (“GAAP”). These non-GAAP financial measures provide supplemental information and should not be considered replacements for results in accordance with GAAP. Management uses non-GAAP financial measures internally for planning and forecasting purposes and in its decision-making processes related to the operations of our company. We believe these measures provide meaningful information to us and investors because they enhance the understanding of our operating performance, ability to generate cash, and the trends of our business. Additionally, we believe that investors benefit from having access to the same financial measures that management uses in evaluating our operations. The primary limitation of these measures is that they exclude the financial impact of items that would otherwise either increase or decrease our reported results. This limitation is best addressed by using these non-GAAP financial measures in combination with the most directly comparable GAAP financial measures in order to better understand the amounts, character, and impact of any increase or decrease in reported amounts. These non-GAAP financial measures may not be comparable to similarly-titled measures reported by other companies.
The following provides additional information regarding our non-GAAP financial measures:
Organic Net Sales Growth (Decline) – represents net sales growth (decline) (the most comparable GAAP financial measure) excluding the impact of foreign currency exchange rates, and acquisitions and divestitures that occurred in the preceding twelve months, if any. Organic Net Sales Growth (Decline) is a useful measure of our performance because it excludes items that are not completely under management’s control, such as the impact of changes in foreign currency exchange rates, and items that do not reflect the underlying growth of the company, such as acquisition and divestiture activity. This measure is a significant component in our incentive compensation plans.Adjusted Operating Income and Adjusted Operating Margin – represent operating income and operating margin, respectively, (the most comparable GAAP financial measures) before special items including restructuring and other charges, acquisition-related charges, impairment of goodwill, and other income or charges, if any. We utilize these adjusted measures in combination with operating income and operating margin to assess segment level operating performance and to provide insight to management in evaluating segment operating plan execution and market conditions. Adjusted Operating Income is a significant component in our incentive compensation plans.Adjusted Income Tax (Expense) Benefit and Adjusted Effective Tax Rate – represent income tax (expense) benefit and effective tax rate, respectively, (the most comparable GAAP financial measures) after adjusting for the tax effect of special items including restructuring and other charges, acquisition-related charges, impairment of goodwill, other income or charges, and certain significant tax items, if any.Adjusted Income from Continuing Operations – represents income from continuing operations (the most comparable GAAP financial measure) before special items including restructuring and other charges, acquisition-related charges, impairment of goodwill, other income or charges, and certain significant tax items, if any, and, if applicable, the related tax effects.Adjusted Earnings Per Share – represents diluted earnings (loss) per share from continuing operations (the most comparable GAAP financial measure) before special items including restructuring and other charges, acquisition-related charges, impairment of goodwill, other income or charges, and certain significant tax items, if any, and, if applicable, the related tax effects. This measure is a significant component in our incentive compensation plans.Free Cash Flow (FCF) – is a useful measure of our ability to generate cash. The difference between net cash provided by operating activities (the most comparable GAAP financial measure) and Free Cash Flow consists mainly of significant cash outflows and inflows that we believe are useful to identify. We believe Free Cash Flow provides useful information to investors as it provides insight into the primary cash flow metric used by management to monitor and evaluate cash flows generated from our operations. Free Cash Flow is defined as net cash provided by operating activities excluding voluntary pension contributions and the cash impact of special items, if any, minus net capital expenditures. Voluntary pension contributions are excluded from the GAAP financial measure because this activity is driven by economic financing decisions rather than operating activity. Certain special items, including cash paid (collected) pursuant to collateral requirements related to cross-currency swap contracts, are also excluded by management in evaluating Free Cash Flow. Net capital expenditures consist of capital expenditures less proceeds from the sale of property, plant, and equipment. These items are subtracted because they represent long-term commitments. In the calculation of Free Cash Flow, we subtract certain cash items that are ultimately within management’s and the Board of Directors’ discretion to direct and may imply that there is less or more cash available for our programs than the most comparable GAAP financial measure indicates. It should not be inferred that the entire Free Cash Flow amount is available for future discretionary expenditures, as our definition of Free Cash Flow does not consider certain non-discretionary expenditures, such as debt payments. In addition, we may have other discretionary expenditures, such as discretionary dividends, share repurchases, and business acquisitions, that are not considered in the calculation of Free Cash Flow.
Forward-Looking Statements
This release contains certain “forward-looking statements” within the meaning of the U.S. Private Securities Litigation Reform Act of 1995. These statements are based on management’s current expectations and are subject to risks, uncertainty and changes in circumstances, which may cause actual results, performance, financial condition or achievements to differ materially from anticipated results, performance, financial condition or achievements. All statements contained herein that are not clearly historical in nature are forward-looking and the words “anticipate,” “believe,” “expect,” “estimate,” “plan,” and similar expressions are generally intended to identify forward-looking statements. We have no intention and are under no obligation to update or alter (and expressly disclaim any such intention or obligation to do so) our forward-looking statements whether as a result of new information, future events or otherwise, except to the extent required by law. The forward-looking statements in this release include statements addressing our future financial condition and operating results. Examples of factors that could cause actual results to differ materially from those described in the forward-looking statements include, among others, the extent, severity and duration of business interruptions negatively affecting our business operations; business, economic, competitive and regulatory risks, such as conditions affecting demand for products in the automotive and other industries we serve; competition and pricing pressure; fluctuations in foreign currency exchange rates and commodity prices; natural disasters and political, economic and military instability in countries in which we operate, including continuing military conflict in certain parts of the world; developments in the credit markets; future goodwill impairment; compliance with current and future environmental and other laws and regulations; and the possible effects on us of changes in tax laws, tax treaties and other legislation. In addition, our change of incorporation from Switzerland to Ireland is subject to risks, such as the risk that the anticipated advantages might not materialize, as well as the risks that the price of our stock could decline and our position on stock exchanges and indices could change, and Irish corporate governance and regulatory schemes could prove different or more challenging than currently expected. More detailed information about these and other factors is set forth in TE Connectivity plc’s Annual Report on Form 10-K for the fiscal year ended Sept 27, 2024, as well as in our Quarterly Reports on Form 10-Q, Current Reports on Form 8-K and other reports filed by us with the U.S. Securities and Exchange Commission.
TE CONNECTIVITY PLC
CONSOLIDATED STATEMENTS OF OPERATIONS (UNAUDITED)
For the Quarters Ended
For the Six Months Ended
March 28,
March 29,
March 28,
March 29,
2025
2024
2025
2024
(in millions, except per share data)
Net sales
$
4,143
$
3,967
$
7,979
$
7,798
Cost of sales
2,684
2,604
5,160
5,111
Gross margin
1,459
1,363
2,819
2,687
Selling, general, and administrative expenses
454
444
881
868
Research, development, and engineering expenses
203
184
391
357
Acquisition and integration costs
9
3
14
11
Restructuring and other charges, net
45
40
95
61
Operating income
748
692
1,438
1,390
Interest income
22
19
45
41
Interest expense
(14)
(19)
(20)
(37)
Other expense, net
(1)
(5)
(2)
(8)
Income from continuing operations before income taxes
755
687
1,461
1,386
Income tax (expense) benefit
(742)
(146)
(920)
959
Income from continuing operations
13
541
541
2,345
Loss from discontinued operations, net of income taxes
—
—
—
(1)
Net income
$
13
$
541
$
541
$
2,344
Basic earnings per share:
Income from continuing operations
$
0.04
$
1.76
$
1.81
$
7.59
Net income
0.04
1.76
1.81
7.59
Diluted earnings per share:
Income from continuing operations
$
0.04
$
1.75
$
1.80
$
7.54
Net income
0.04
1.75
1.80
7.54
Weighted-average number of shares outstanding:
Basic
298
308
299
309
Diluted
300
310
301
311
TE CONNECTIVITY PLC
CONSOLIDATED BALANCE SHEETS (UNAUDITED)
March 28,
September 27,
2025
2024
(in millions, except share data)
Assets
Current assets:
Cash and cash equivalents
$
2,554
$
1,319
Accounts receivable, net of allowance for doubtful accounts of $36 and $32, respectively
3,193
3,055
Inventories
2,603
2,517
Prepaid expenses and other current assets
724
740
Total current assets
9,074
7,631
Property, plant, and equipment, net
3,925
3,903
Goodwill
5,900
5,801
Intangible assets, net
1,161
1,174
Deferred income taxes
2,741
3,497
Other assets
855
848
Total assets
$
23,656
$
22,854
Liabilities, redeemable noncontrolling interests, and shareholders’ equity
Current liabilities:
Short-term debt
$
2,351
$
871
Accounts payable
1,843
1,728
Accrued and other current liabilities
1,805
2,147
Total current liabilities
5,999
4,746
Long-term debt
3,263
3,332
Long-term pension and postretirement liabilities
786
810
Deferred income taxes
211
199
Income taxes
396
411
Other liabilities
784
870
Total liabilities
11,439
10,368
Commitments and contingencies
Redeemable noncontrolling interests
132
131
Shareholders’ equity:
Preferred shares, $1.00 par value, 2 shares authorized, none outstanding as of March 28, 2025
—
—
Ordinary class A shares, €1.00 par value, 25,000 shares authorized, none outstanding as of March 28, 2025
—
—
Ordinary shares, $0.01 par value, 1,500,000,000 shares authorized, 301,276,687 shares issued and
common shares, CHF 0.57 par value, 316,574,781 shares authorized and issued, respectively
3
139
Accumulated earnings
12,811
14,533
Ordinary shares and common shares held in treasury, at cost, 4,139,531 and 16,656,681 shares, respectively
(615)
(2,322)
Accumulated other comprehensive income (loss)
(114)
5
Total shareholders’ equity
12,085
12,355
Total liabilities, redeemable noncontrolling interests, and shareholders’ equity
$
23,656
$
22,854
TE CONNECTIVITY PLC
CONSOLIDATED STATEMENTS OF CASH FLOWS (UNAUDITED)
For the Quarters Ended
For the Six Months Ended
March 28,
March 29,
March 28,
March 29,
2025
2024
2025
2024
(in millions)
Cash flows from operating activities:
Net income
$
13
$
541
$
541
$
2,344
Loss from discontinued operations, net of income taxes
—
—
—
1
Income from continuing operations
13
541
541
2,345
Adjustments to reconcile income from continuing operations to net cash
provided by operating activities:
Depreciation and amortization
192
192
378
386
Deferred income taxes
603
5
701
(1,212)
Non-cash lease cost
35
33
69
67
Provision for losses on accounts receivable and inventories
2
13
43
55
Share-based compensation expense
34
35
69
69
Other
22
24
34
64
Changes in assets and liabilities, net of the effects of acquisitions and divestitures:
Accounts receivable, net
(317)
(55)
(171)
72
Inventories
(14)
41
(132)
(241)
Prepaid expenses and other current assets
72
47
140
(1)
Accounts payable
(4)
(73)
146
55
Accrued and other current liabilities
(3)
(48)
(298)
(287)
Income taxes
25
3
55
15
Other
(7)
(48)
(44)
42
Net cash provided by operating activities
653
710
1,531
1,429
Cash flows from investing activities:
Capital expenditures
(230)
(167)
(435)
(318)
Proceeds from sale of property, plant, and equipment
1
—
2
2
Acquisition of businesses, net of cash acquired
4
10
(321)
(339)
Proceeds from divestiture of business, net of cash retained by business sold
—
—
—
38
Other
1
(2)
(7)
(10)
Net cash used in investing activities
(224)
(159)
(761)
(627)
Cash flows from financing activities:
Net increase (decrease) in commercial paper
1,155
30
1,245
(39)
Proceeds from issuance of debt
773
—
773
—
Repayment of debt
(579)
—
(579)
(1)
Proceeds from exercise of share options
25
22
59
33
Repurchase of ordinary/common shares
(306)
(409)
(609)
(885)
Payment of ordinary/common share dividends to shareholders
(193)
(182)
(382)
(365)
Other
(6)
—
(33)
(27)
Net cash provided by (used in) financing activities
869
(539)
474
(1,284)
Effect of currency translation on cash
2
(6)
(9)
(3)
Net increase (decrease) in cash, cash equivalents, and restricted cash
1,300
6
1,235
(485)
Cash, cash equivalents, and restricted cash at beginning of period
1,254
1,170
1,319
1,661
Cash, cash equivalents, and restricted cash at end of period
$
2,554
$
1,176
$
2,554
$
1,176
Supplemental cash flow information:
Income taxes paid, net of refunds
$
115
$
138
$
164
$
238
TE CONNECTIVITY PLC
RECONCILIATION OF FREE CASH FLOW (UNAUDITED)
For the Quarters Ended
For the Six Months Ended
March 28,
March 29,
March 28,
March 29,
2025
2024
2025
2024
(in millions)
Net cash provided by operating activities
$
653
$
710
$
1,531
$
1,429
Capital expenditures, net
(229)
(167)
(433)
(316)
Free cash flow (1)
$
424
$
543
$
1,098
$
1,113
(1) Free cash flow is a non-GAAP financial measure. See description of non-GAAP financial measures.
TE CONNECTIVITY PLC
SEGMENT DATA (UNAUDITED)
For the Quarters Ended
For the Six Months Ended
March 28,
March 29,
March 28,
March 29,
2025
2024
2025
2024
($ in millions)
Net Sales
Net Sales
Net Sales
Net Sales
Transportation Solutions
$
2,314
$
2,407
$
4,557
$
4,800
Industrial Solutions
1,829
1,560
3,422
2,998
Total
$
4,143
$
3,967
$
7,979
$
7,798
Operating
Operating
Operating
Operating
Operating
Operating
Operating
Operating
Income
Margin
Income
Margin
Income
Margin
Income
Margin
Transportation Solutions
$
445
19.2
%
$
477
19.8
%
$
891
19.6
%
$
964
20.1
%
Industrial Solutions
303
16.6
215
13.8
547
16.0
426
14.2
Total
$
748
18.1
%
$
692
17.4
%
$
1,438
18.0
%
$
1,390
17.8
%
Adjusted
Adjusted
Adjusted
Adjusted
Adjusted
Adjusted
Adjusted
Adjusted
Operating
Operating
Operating
Operating
Operating
Operating
Operating
Operating
Income (1)
Margin (1)
Income (1)
Margin (1)
Income (1)
Margin (1)
Income (1)
Margin (1)
Transportation Solutions
$
478
20.7
%
$
496
20.6
%
$
956
21.0
%
$
1,000
20.8
%
Industrial Solutions
327
17.9
239
15.3
594
17.4
466
15.5
Total
$
805
19.4
%
$
735
18.5
%
$
1,550
19.4
%
$
1,466
18.8
%
(1) Adjusted operating income and adjusted operating margin are non-GAAP financial measures. See description of non-GAAP financial measures.
TE CONNECTIVITY PLC
RECONCILIATION OF NET SALES GROWTH (DECLINE) (UNAUDITED)
Change in Net Sales for the Quarter Ended March 28, 2025
versus Net Sales for the Quarter Ended March 29, 2024
Net Sales
Organic Net Sales
Growth (Decline)
Growth (Decline) (1)
Translation (2)
Acquisitions
($ in millions)
Transportation Solutions (3):
Automotive
$
(37)
(2.1)
%
$
6
0.4
%
$
(43)
$
—
Commercial transportation
(27)
(7.0)
(20)
(5.1)
(7)
—
Sensors
(29)
(11.6)
(25)
(9.6)
(4)
—
Total Transportation Solutions
(93)
(3.9)
(39)
(1.5)
(54)
—
Industrial Solutions (3):
Automation and connected living
12
2.4
8
1.5
(10)
14
Aerospace, defense, and marine
32
9.4
37
10.8
(5)
—
Digital data networks
209
76.6
213
78.0
(4)
—
Energy
45
19.2
18
7.6
(7)
34
Medical
(29)
(13.7)
(29)
(13.7)
—
—
Total Industrial Solutions
269
17.2
247
15.7
(26)
48
Total
$
176
4.4
%
$
208
5.3
%
$
(80)
$
48
Change in Net Sales for the Six Months Ended March 28, 2025
versus Net Sales for the Six Months Ended March 29, 2024
Net Sales
Organic Net Sales
Acquisitions/
Growth (Decline)
Growth (Decline) (1)
Translation (2)
(Divestiture)
($ in millions)
Transportation Solutions (3):
Automotive
$
(111)
(3.1)
%
$
(49)
(1.3)
%
$
(50)
$
(12)
Commercial transportation
(71)
(9.6)
(61)
(8.3)
(10)
—
Sensors
(61)
(12.4)
(55)
(11.1)
(6)
—
Total Transportation Solutions
(243)
(5.1)
(165)
(3.4)
(66)
(12)
Industrial Solutions (3):
Automation and connected living
27
2.8
(13)
(1.4)
(12)
52
Aerospace, defense, and marine
76
12.0
82
12.9
(6)
—
Digital data networks
343
62.1
347
62.8
(4)
—
Energy
56
12.8
32
7.2
(10)
34
Medical
(78)
(19.0)
(78)
(19.0)
—
—
Total Industrial Solutions
424
14.1
370
12.3
(32)
86
Total
$
181
2.3
%
$
205
2.7
%
$
(98)
$
74
(1) Organic net sales growth (decline) is a non-GAAP financial measure. See description of non-GAAP financial measures.
(2) Represents the change in net sales resulting from changes in foreign currency exchange rates.
(3) Industry end market information is presented consistently with our internal management reporting and may be periodically revised as management deems necessary.
TE CONNECTIVITY PLC
RECONCILIATION OF NON-GAAP FINANCIAL MEASURES TO GAAP FINANCIAL MEASURES
For the Quarter Ended March 28, 2025
(UNAUDITED)
Adjustments
Acquisition-
Restructuring
Related
and Other
Adjusted
U.S. GAAP
Charges (1)
Charges, Net (1)
Tax Items (2)
(Non-GAAP) (3)
($ in millions, except per share data)
Operating income:
Transportation Solutions
$
445
$
—
$
33
$
—
$
478
Industrial Solutions
303
12
12
—
327
Total
$
748
$
12
$
45
$
—
$
805
Operating margin
18.1
%
19.4
%
Income tax expense
$
(742)
$
(2)
$
(11)
$
574
$
(181)
Effective tax rate
98.3
%
22.3
%
Income from continuing operations
$
13
$
10
$
34
$
574
$
631
Diluted earnings per share from continuing operations
$
0.04
$
0.03
$
0.11
$
1.91
$
2.10
(1) The tax effect of each non-GAAP adjustment is calculated based on the jurisdictions in which the expense (income) is incurred and the tax laws in effect for each such jurisdiction.
(2) Represents income tax expense related to a net increase in the valuation allowance for certain deferred tax assets associated with a ten-year tax credit obtained by a Swiss subsidiary in fiscal 2024.
(3) See description of non-GAAP financial measures.
TE CONNECTIVITY PLC
RECONCILIATION OF NON-GAAP FINANCIAL MEASURES TO GAAP FINANCIAL MEASURES
For the Quarter Ended March 29, 2024
(UNAUDITED)
Adjustments
Acquisition-
Restructuring
Related
and Other
Adjusted
U.S. GAAP
Charges (1)
Charges, Net (1)
(Non-GAAP) (2)
($ in millions, except per share data)
Operating income:
Transportation Solutions
$
477
$
—
$
19
$
496
Industrial Solutions
215
3
21
239
Total
$
692
$
3
$
40
$
735
Operating margin
17.4
%
18.5
%
Income tax expense
$
(146)
$
(1)
$
(6)
$
(153)
Effective tax rate
21.3
%
21.0
%
Income from continuing operations
$
541
$
2
$
34
$
577
Diluted earnings per share from continuing operations
$
1.75
$
0.01
$
0.11
$
1.86
(1) The tax effect of each non-GAAP adjustment is calculated based on the jurisdictions in which the expense (income) is incurred and the tax laws in effect for each such jurisdiction.
(2) See description of non-GAAP financial measures.
TE CONNECTIVITY PLC
RECONCILIATION OF NON-GAAP FINANCIAL MEASURES TO GAAP FINANCIAL MEASURES
For the Six Months Ended March 28, 2025
(UNAUDITED)
Adjustments
Acquisition-
Restructuring
Related
and Other
Adjusted
U.S. GAAP
Charges (1)
Charges, Net (1)
Tax Items (2)
(Non-GAAP) (3)
($ in millions, except per share data)
Operating income:
Transportation Solutions
$
891
$
—
$
65
$
—
$
956
Industrial Solutions
547
17
30
—
594
Total
$
1,438
$
17
$
95
$
—
$
1,550
Operating margin
18.0
%
19.4
%
Income tax expense
$
(920)
$
(3)
$
(20)
$
587
$
(356)
Effective tax rate
63.0
%
22.6
%
Income from continuing operations
$
541
$
14
$
75
$
587
$
1,217
Diluted earnings per share from continuing operations
$
1.80
$
0.05
$
0.25
$
1.95
$
4.04
(1) The tax effect of each non-GAAP adjustment is calculated based on the jurisdictions in which the expense (income) is incurred and the tax laws in effect for each such jurisdiction.
(2) Includes income tax expense of $574 million related to a net increase in the valuation allowance for certain deferred tax assets associated with a ten-year tax credit obtained by a Swiss subsidiary in fiscal 2024 as well as income tax expense of $13 million related to the revaluation of deferred tax assets as a result of a decrease in the corporate tax rate in a non-U.S. jurisdiction.
(3) See description of non-GAAP financial measures.
TE CONNECTIVITY PLC
RECONCILIATION OF NON-GAAP FINANCIAL MEASURES TO GAAP FINANCIAL MEASURES
For the Six Months Ended March 29, 2024
(UNAUDITED)
Adjustments
Acquisition-
Restructuring
Related
and Other
Adjusted
U.S. GAAP
Charges (1)
Charges, Net (1)
Tax Items (2)
(Non-GAAP) (3)
($ in millions, except per share data)
Operating income:
Transportation Solutions
$
964
$
—
$
33
$
3
$
1,000
Industrial Solutions
426
11
28
1
466
Total
$
1,390
$
11
$
61
$
4
$
1,466
Operating margin
17.8
%
18.8
%
Income tax (expense) benefit
$
959
$
(2)
$
(11)
$
(1,254)
$
(308)
Effective tax rate
(69.2)
%
21.1
%
Income from continuing operations
$
2,345
$
9
$
50
$
(1,250)
$
1,154
Diluted earnings per share from continuing operations
$
7.54
$
0.03
$
0.16
$
(4.02)
$
3.71
(1) The tax effect of each non-GAAP adjustment is calculated based on the jurisdictions in which the expense (income) is incurred and the tax laws in effect for each such jurisdiction.
(2) Includes an $874 million net income tax benefit associated with a ten-year tax credit obtained by a Swiss subsidiary and a $262 million income tax benefit related to the revaluation of deferred tax assets as a result of a corporate tax rate increase in Switzerland. Also includes a $118 million income tax benefit associated with the tax impacts of a legal entity restructuring with related costs of $4 million recorded in selling, general, and administrative expenses for other non-income taxes.
(3) See description of non-GAAP financial measures.
TE CONNECTIVITY PLC
RECONCILIATION OF NON-GAAP FINANCIAL MEASURES TO GAAP FINANCIAL MEASURES
For the Quarter Ended June 28, 2024
(UNAUDITED)
Adjustments
Acquisition-
Restructuring
Related
and Other
Adjusted
U.S. GAAP
Charges (1)
Charges, Net (1)
(Non-GAAP) (2)
($ in millions, except per share data)
Operating income:
Transportation Solutions
$
506
$
—
$
(8)
$
498
Industrial Solutions
249
5
14
268
Total
$
755
$
5
$
6
$
766
Operating margin
19.0
%
19.3
%
Income tax expense
$
(181)
$
—
$
4
$
(177)
Effective tax rate
24.0
%
23.1
%
Income from continuing operations
$
573
$
5
$
10
$
588
Diluted earnings per share from continuing operations
$
1.86
$
0.02
$
0.03
$
1.91
(1) The tax effect of each non-GAAP adjustment is calculated based on the jurisdictions in which the expense (income) is incurred and the tax laws in effect for each such jurisdiction.
(2) See description of non-GAAP financial measures.
TE CONNECTIVITY PLC
RECONCILIATION OF NON-GAAP FINANCIAL MEASURES TO GAAP FINANCIAL MEASURES
For the Year Ended September 27, 2024
(UNAUDITED)
Adjustments
Acquisition-
Restructuring
Related
and Other
Adjusted
U.S. GAAP
Charges (1)
Charges, Net (1)
Tax Items (2)
(Non-GAAP) (3)
($ in millions, except per share data)
Operating income:
Transportation Solutions
$
1,880
$
—
$
67
$
3
$
1,950
Industrial Solutions
916
21
99
1
1,037
Total
$
2,796
$
21
$
166
$
4
$
2,987
Operating margin
17.6
%
18.9
%
Income tax (expense) benefit
$
397
$
(3)
$
(29)
$
(1,016)
$
(651)
Effective tax rate
(14.2)
%
21.8
%
Income from continuing operations
$
3,194
$
18
$
137
$
(1,012)
$
2,337
Diluted earnings per share from continuing operations
$
10.34
$
0.06
$
0.44
$
(3.28)
$
7.56
(1) The tax effect of each non-GAAP adjustment is calculated based on the jurisdictions in which the expense (income) is incurred and the tax laws in effect for each such jurisdiction.
(2) Includes a $636 million net income tax benefit associated with a $972 million ten-year tax credit obtained by a Swiss subsidiary reduced by a $336 million valuation allowance related to the amount of the tax credit not expected to be realized. Also includes a $262 million income tax benefit related to the revaluation of deferred tax assets as a result of a corporate tax rate increase in Switzerland and a $118 million income tax benefit associated with the tax impacts of a legal entity restructuring with related costs of $4 million recorded in selling, general, and administrative expenses for other non-income taxes.
(3) See description of non-GAAP financial measures.
TE CONNECTIVITY PLC
RECONCILIATION OF FORWARD-LOOKING NON-GAAP FINANCIAL MEASURES
TO FORWARD-LOOKING GAAP FINANCIAL MEASURES
As of April 23, 2025
(UNAUDITED)
Outlook for
Quarter Ending
June 27,
2025
Diluted earnings per share from continuing operations
$
2.02
Restructuring and other charges, net
0.02
Acquisition-related charges
0.02
Adjusted diluted earnings per share from continuing operations (1)
$
2.06
Net sales growth
8.1
%
(Acquisitions) divestitures, net
(3.0)
Organic net sales growth (1)
5.1
%
(1) See description of non-GAAP financial measures.
View original content to download multimedia:https://www.prnewswire.com/news-releases/te-connectivity-delivers-sales-and-eps-above-guidance-in-second-quarter-of-fiscal-year-2025-302435176.html
SOURCE TE Connectivity plc

You may like
Technology
Autonomous Defense Technologies Set to Ignite a Nearly $200 Billion Global Market
Published
2 minutes agoon
July 23, 2026By
AI-Powered Military Drones, Autonomous Platforms, and Next-Generation Defense Systems Are Fueling One of the Fastest-Growing Opportunities in Aerospace and Defense
NEW YORK, July 23, 2026 /PRNewswire/ — Market News Updates News Commentary – Around the globe, the defense industry is quickly adopting autonomous technologies, with governments investing significantly in artificial intelligence, unmanned systems, advanced sensors, and self-directed decision-making capabilities. Military forces are on the lookout for technologies that can swiftly gather intelligence, function in dangerous settings without risking personnel, and respond promptly to threats. Unmanned aerial vehicles (UAVs) utilizing autonomous AI are increasingly crucial in modern military operations, proficient in various tasks such as reconnaissance, surveillance, target identification, electronic warfare, logistics support, and precision strike missions with minimal human intervention. As artificial intelligence advances, these sophisticated systems are expected to improve their efficiency in managing drone swarms, sharing battlefield information, and swiftly adjusting to changing combat situations. Companies leading the Autonomous and AI technology Defense Operations boom include: VisionWave Holdings Inc. (NASDAQ: VWAV), Kratos Defense & Security Solutions, Inc. (NASDAQ: KTOS), AeroVironment, Inc. (NASDAQ: AVAV), AEVEX Corp. (NYSE: AVEX), Sidus Space, Inc. (NASDAQ: SIDU).
There is also a rapid expansion in financial opportunities. Fortune Business Insights forecasts substantial growth in the global Autonomous Defense Platforms Market, with a projected increase from approximately US$69.77 billion in 2026 to US$198.87 billion by 2034, indicating a robust compound annual growth rate of 14.0%. Additionally, the firm anticipates a surge in the global Military Drone Market from US$22.49 billion in 2026 to US$52.31 billion by 2034, showing an 11.1% compound annual growth rate. With rising defense budgets and a focus on AI-enhanced military capabilities, companies specializing in autonomous aircraft, AI software, advanced sensors, cybersecurity platforms, navigation systems, and cutting-edge battlefield technologies are well positioned to capitalize on these expanding markets.
The widespread integration of autonomous AI UAVs is revolutionizing military strategies and operations. Instead of relying on individual aircraft, armed forces are increasingly deploying coordinated fleets of intelligent drones capable of monitoring vast areas, identifying targets, transmitting secure communications, and offering real-time situational awareness to ground troops. Advancements in machine learning, computer vision, edge computing, and secure battlefield networking are empowering these systems to autonomously process large amounts of data, thereby reducing the workload on operators and increasing mission success. As global tensions rise and defense modernization remains a top priority worldwide, autonomous defense technologies are expected to be one of the fastest-growing sectors in the military industry in the coming decade.
VisionWave (NASDAQ: VWAV) and Meteor Aerospace Leadership Advance Integration Planning for AI-Enabled Multi-Domain Defense Technologies Following Previously Announced Acquisition Agreement — VisionWave Holdings Inc. (“VisionWave” or the “Company”) a defense technology company developing advanced artificial intelligence, autonomous systems and next-generation security technologies, today announced that its executive leadership team has completed a strategic technology and integration working session with the leadership of Meteor Aerospace Ltd. in Israel following the Company’s previously announced acquisition agreement to acquire a controlling interest in Meteor Aerospace. Completion of the transaction remains subject to the closing conditions described below.
The executive meetings represent an important milestone in the transaction process as both companies continue advancing technical, operational and commercial integration planning while progressing toward satisfaction of the closing conditions described below.
During the visit, VisionWave executives conducted comprehensive reviews of Meteor Aerospace’s expanding portfolio of advanced defense technologies, including tactical and strategic unmanned aerial vehicles (UAVs), unmanned ground vehicles (UGVs), unmanned surface vessels (USVs), electronic warfare (EW) and SIGINT technologies, precision strike systems, C4ISR platforms and integrated sovereign defense architectures.
The working sessions included executive strategy meetings, engineering reviews, technology demonstrations, manufacturing assessments and product roadmap discussions focused on identifying opportunities to accelerate innovation, expand international commercialization and strengthen VisionWave’s multi-domain defense technology platform.
Meteor Aerospace presented video documentation of field tests and demonstrations of its products, including flights of the Impact-700 UAV at the Bar Yehuda airfield near the Dead Sea in Israel, that were done with the regulatory monitoring and approval of the Israeli Aviation Authority.
For operational security reasons, the meetings were conducted at a confidential location, and additional details regarding attendees and facilities are not being disclosed.
Douglas Davis, Executive Chairman and Chief Executive Officer of VisionWave Holdings, stated: “Visiting Meteor Aerospace and working directly alongside its leadership and engineering teams reinforced what we recognized when we entered into the acquisition agreement. Meteor has developed a highly differentiated portfolio of autonomous systems, electronic warfare technologies, and integrated battlefield capabilities supported by a team with decades of aerospace engineering experience. Seeing these technologies firsthand further strengthened our confidence in the strategic opportunity this transaction represents.”
Mr. Davis continued: “Our integration planning, in preparation for a potential closing, is well underway. By bringing together VisionWave’s expertise in artificial intelligence, advanced sensing and computational technologies with Meteor’s capabilities across autonomous platforms, C4ISR, precision defense technologies and sovereign defense architectures, we believe we are building a next-generation defense technology platform positioned to address rapidly growing global demand for integrated battlefield solutions, autonomous systems and national security modernization.”
Throughout the visit, executives from both organizations evaluated opportunities to align technology development, manufacturing capabilities, international business development initiatives and long-term product strategies as part of VisionWave’s integration planning process.
The meetings also provided both leadership teams with the opportunity to establish integration priorities across engineering, operations, commercialization and future product development while preparing for the successful completion of the proposed transaction.
As previously announced, completion of the acquisition remains subject to a number of conditions for VisionWave’s satisfactory completion of legal, financial, operational, technical, aerospace, cybersecurity, export control, intellectual property and commercial due diligence, receipt of any applicable regulatory approvals and satisfaction of other customary closing conditions. There can be no assurance that the closing conditions will be satisfied, or that the transaction will be completed on the anticipated timeline or at all. Continued… Read this full release and additional news for VWAV by visiting: https://www.vwav.inc/newsroom/
Why Investors Are Watching the UAV / Autonomous / AI Military Operations Industries:
Autonomous AI-powered UAVs becoming standard assets for ISR and combat support missionsRising global defense spending focused on artificial intelligence and autonomous warfareGrowing adoption of autonomous drone swarms and collaborative mission capabilitiesIncreased demand for real-time intelligence, surveillance, and reconnaissance (ISR)Continued advances in machine learning, computer vision, edge computing, and autonomous navigationExpansion of electronic warfare, cybersecurity, and secure battlefield communicationsDefense modernization programs accelerating across North America, Europe, and the Indo-PacificGrowing opportunities for companies developing next-generation autonomous defense platforms
Other recent developments in the autonomous, defense/military/UAV/drone industries of note include:
Kratos Defense & Security Solutions, Inc. (NASDAQ: KTOS), a technology company in the defense, national security and global markets, recently announced it has been awarded a sole-source, single award Indefinite Delivery/Indefinite Quantity (IDIQ) contract for approximately $156 million, by the U.S. Department of Energy’s National Nuclear Security Administration (NNSA) Office of Secure Transportation (OST), in support of Project Solar Shield.
Under this new contract award, Kratos will provide mobile Counter-Unmanned Aircraft System (C-UAS) platforms designed to support OST’s critical National Security mission. The Office of Secure Transportation is responsible for the safe and secure ground and air transportation of nuclear weapons, weapon components, and special nuclear materials, as well as other missions supporting U.S. national security.
AeroVironment, Inc. (“AV”) (NASDAQ: AVAV), a global leader in intelligent, multi-domain autonomous systems, recently announced it has been awarded a $117.3 million contract by the U.S. Army for its P550™ electric vertical take-off and landing (eVTOL) unmanned aerial system in support of the Army’s Long Range Reconnaissance program, advancing the Army’s push to field scalable, adaptable capabilities for modern warfare.
The award was issued under a Basic Ordering Agreement (BOA) through a competitive Call for Solutions (C4S) under the U.S. Army’s Unmanned Aircraft Systems (UAS) Marketplace initiative, a centralized digital platform designed to accelerate the procurement of vetted drone technologies.
AEVEX Corp. (NYSE: AVEX) recently announced it has been awarded a $17.5 million follow-on contract under its Global Solutions portfolio to continue delivering critical services in support of U.S. national security objectives.
The contract reinforces the company’s role in providing mission focused, data-driven services and solutions that help decision makers act with speed and confidence. AEVEX’s Global Solutions capabilities integrate technology and multi-domain expertise to transform complex data into actionable insight for time sensitive missions.
“Our teams are trusted to support some of the nation’s most important missions,” said Roger Wells, Chief Executive Officer at AEVEX. “This award reflects continued confidence in AEVEX to deliver the specialized expertise required to advance essential national security interests.”
Sidus Space, Inc. (NASDAQ: SIDU) (“Sidus” or the “Company”), an innovative space and defense technology company, recently announced that its next LizzieSat® has successfully completed vibration testing, a key environmental qualification milestone for SpaceX’s Transporter-18 rideshare mission from Vandenberg Space Force Base in California, currently scheduled for launch no earlier than October 2026.
Vibration testing simulates the intense mechanical loads a spacecraft experiences during launch and ascent. The testing was conducted at Element U.S. Space & Defense’s facility in Orlando, Florida, an accredited independent provider of product qualification and environmental testing services. Completing this testing is designed to confirm that the satellite’s structure, components, and integrated payloads can withstand the stresses of liftoff and remain fully operational on orbit, a critical step in clearing the spacecraft for final integration and shipment to the launch site.
DISCLAIMER: MarketNewsUpdates.com (MNU) is a third party publisher and news dissemination service provider, which disseminates electronic information through multiple online media channels. MNU is NOT affiliated in any manner with any company mentioned herein. MNU and its affiliated companies are a news dissemination solutions provider and are NOT a registered broker/dealer/analyst/adviser, holds no investment licenses and may NOT sell, offer to sell or offer to buy any security. MNU’S market updates, news alerts and corporate profiles are NOT a solicitation or recommendation to buy, sell or hold securities. The material in this release is intended to be strictly informational and is NEVER to be construed or interpreted as research material. All readers are strongly urged to perform research and due diligence on their own and consult a licensed financial professional before considering any level of investing in stocks. All material included herein is republished content and details which were previously disseminated by the companies mentioned in this release. MNU is not liable for any investment decisions by its readers or subscribers. Investors are cautioned that they may lose all or a portion of their investment when investing in stocks. This press release was distributed on behalf of VisionWave Holdings, Inc. For current services performed MNU was compensated forty nine hundred dollars for news coverage of the current press releases issued by VisionWave Holdings, Inc. by the Company. MNU HOLDS NO SHARES OF ANY COMPANY NAMED IN THIS RELEASE.
This release contains “forward-looking statements” within the meaning of Section 27A of the Securities Act of 1933, as amended, and Section 21E the Securities Exchange Act of 1934, as amended and such forward-looking statements are made pursuant to the safe harbor provisions of the Private Securities Litigation Reform Act of 1995. “Forward-looking statements” describe future expectations, plans, results, or strategies and are generally preceded by words such as “may”, “future”, “plan” or “planned”, “will” or “should”, “expected,” “anticipates”, “draft”, “eventually” or “projected”. You are cautioned that such statements are subject to a multitude of risks and uncertainties that could cause future circumstances, events, or results to differ materially from those projected in the forward-looking statements, including the risks that actual results may differ materially from those projected in the forward-looking statements as a result of various factors, and other risks identified in a company’s annual report on Form 10-K or 10-KSB and other filings made by such company with the Securities and Exchange Commission. You should consider these factors in evaluating the forward-looking statements included herein, and not place undue reliance on such statements. The forward-looking statements in this release are made as of the date hereof and MNU undertakes no obligation to update such statements.
Contact Information:
Media Contact email: editor@marketnewsupdates.com – +1(561)486-1799
View original content to download multimedia:https://www.prnewswire.com/news-releases/autonomous-defense-technologies-set-to-ignite-a-nearly-200-billion-global-market-302833247.html
SOURCE Market News Updates
Technology
atQor Earns Microsoft Frontier Partner Status for AI Delivery
Published
2 minutes agoon
July 23, 2026By
The recognition validates atQor’s ability to unite Cloud & AI Platforms, AI Business Solutions and Security for customers in financial services, manufacturing, retail, healthcare and public sector.
AHMEDABAD, India, MISSISSAUGA, ON and SANTA FE SPRINGS, Calif., July 23, 2026 /PRNewswire/ — atQor, a Microsoft-focused AI and data platform company, today announced it has achieved Microsoft Frontier Partner status, with its nomination led by Microsoft India and recognition extending across Canada, the United States and India.
atQor holds all six Microsoft Solutions Partner designations, the Support Services designation, Azure Expert MSP status, Microsoft Fabric Featured Partner recognition and ten Advanced Specializations.
“Our engineers do not wait for a mandate to use AI, they build with it every day, and that is what Microsoft recognized,” said Pushkaraj Kale, CEO of atQor India. “Earlier this year, our teams built and deployed more than two hundred production AI agents in a single seventy-two-hour engineering event, and twenty-five of those are now live on Microsoft Marketplace. This nomination was led by Microsoft India, and it reflects the discipline our customers see across every industry we serve.”
“The Frontier Partner designation recognizes organizations that are helping customers move beyond AI experimentation and into business transformation. atQor has consistently invested across Microsoft’s AI, data, cloud, and security stack while building the Go-To-Market and delivery capabilities required to create measurable customer outcomes. We are pleased to see atQor join this distinguished group of partners and look forward to their continued contribution to AI adoption across industries,” said Om Batra, Channel Partner Sales Leader, India and South Asia, Microsoft.
“The most successful AI partners are those that can bridge innovation with operational excellence. atQor has built competencies spanning Microsoft Fabric, Azure AI, Security, and Copilot while maintaining a strong focus on delivery quality and governance. Their Frontier Partner recognition reflects the technical maturity and execution capability needed to help customers scale AI with confidence,” said Sanjeev Sharma, Director Tech Sales and Partner CTO, India and South Asia, Microsoft.
For customers, the recognition means fewer handoffs: one firm carrying the work from the first Microsoft Fabric workshop through the AI agent in production, instead of a customer coordinating several vendors to get there. atQor applies this across financial services, manufacturing, retail, healthcare and public sector organizations in Canada, the United States and India, continuing the relationship through managed Azure operations once systems are live.
Pushkaraj and the India team led this global recognition, according to Kartik Shah, Founder of atQor, who said Canada and U.S. teams, led by Co-Founder and Global COO Greg Kachhadiya, already hold themselves to that same standard.
About atQor: atQor is a Microsoft-focused AI and data platform company that helps enterprises move AI from pilot to production. Founded in 2002, the company operates across Canada, the United States and India, and holds CSP Direct authorization including Azure Gov Cloud in US. atQor maintains ISO 9001, ISO 20000, ISO 27001 and ISO 22301 certifications. Learn more at atQor.com.
Media Contact: Ramanuj Zawar, 419311@email4pr.com. United States: +1-844-294-5383. Canada: +1-289-290-4490. India: +91-706-904-3269.
View original content to download multimedia:https://www.prnewswire.com/news-releases/atqor-earns-microsoft-frontier-partner-status-for-ai-delivery-302832916.html
SOURCE atQor
Technology
Carrier Accelerates Intelligent Building Strategy with Acquisition of 75F
Published
2 minutes agoon
July 23, 2026By
Cloud-native building automation strengthens Carrier’s digital ecosystem to enable increasingly intelligent and autonomous buildings
PALM BEACH GARDENS, Fla., July 23, 2026 /PRNewswire/ — Carrier Global Corporation (NYSE: CARR), global leader in intelligent climate and energy solutions, today announced it has acquired 75F, a leading innovator in cloud-native, wireless, AI-enabled building automation systems. The acquisition strengthens Carrier’s intelligent building capabilities across applications — from complex applied systems and high-growth data centers to light commercial and retrofits.
“Buildings are becoming intelligent and autonomous systems that continuously learn, adapt and optimize performance,” said David Gitlin, Chairman & CEO, Carrier. “Through Carrier ClimaVision™, we have already seen firsthand the power of 75F’s cloud-native, AI-enabled platform. This acquisition accelerates our strategy to create increasingly autonomous and self-optimizing buildings by bringing together connected equipment, intelligent controls and digital solutions in a unified platform that simplifies deployment, connects building data and enables agentic AI.”
The combination of Carrier’s WebCTRL® building controls install base, Abound™ predictive analytics capability and the Nlyte® operational intelligence platform with 75F’s unified data layer and AI capabilities will create a differentiated end-to-end offering spanning equipment, controls, analytics and outcomes for buildings globally. Together, these integrated capabilities enable building operators to transition from traditional building management to fully autonomous operations that proactively identify maintenance opportunities, optimize energy consumption, intelligently manage assets and improve occupant comfort.
“75F was founded to fundamentally rethink building automation using cloud-native software, AI and wireless technologies,” said Deepinder Singh, founder and CEO, 75F. “Joining Carrier enables us to accelerate that vision on a global scale. Together, we can help make intelligent buildings simpler to deploy, easier to operate and more accessible to customers everywhere.”
75F’s platform combines wireless sensors, intuitive controls, cloud software and AI-enabled automation designed to reduce installation time and simplify commissioning while optimizing energy efficiency and indoor air quality. Carrier plans to integrate 75F’s generative and agentic AI as well as auto-commissioning capabilities into its large commercial platforms, including its Carrier QuantumLeap™ thermal management suite, improving deployment and real-time thermal performance for the rapidly growing data center market.
Paul, Weiss, Rifkind, Wharton & Garrison LLP acted as external legal counsel to Carrier in connection with the transaction. Avisen Legal, PA acted as external legal counsel to 75F in connection with the transaction.
About Carrier
Carrier Global Corporation, global leader in intelligent climate and energy solutions, is committed to creating innovations that bring comfort, safety and sustainability to life. Through cutting-edge advancements in climate solutions such as temperature control, air quality and transportation, we improve lives, empower critical industries and ensure the safe transport of food, life-saving medicines and more. Since inventing modern air conditioning in 1902, we lead with purpose: enhancing the lives we live and the world we share. We continue to lead because of our world-class, inclusive workforce that puts the customer at the center of everything we do. For more information, visit carrier.com or follow Carrier on social media at @Carrier.
Carrier. For the World We Share.
Cautionary Statement
This communication contains statements which, to the extent they are not statements of historical or present fact, constitute “forward-looking statements” under the securities laws. These forward-looking statements are intended to provide management’s current expectations or plans for Carrier’s future operating and financial performance, based on assumptions currently believed to be valid. Forward-looking statements can be identified by the use of words such as “believe,” “expect,” “expectations,” “plans,” “strategy,” “prospects,” “estimate,” “project,” “target,” “anticipate,” “will,” “should,” “see,” “guidance,” “outlook,” “confident,” “scenario” and other words of similar meaning in connection with a discussion of future operating or financial performance. Forward-looking statements may include, among other things, statements relating to the acquisition of the 75F business, the integration of such business into Carrier’s existing operations, strategies or transactions of Carrier, Carrier’s plans with respect to its indebtedness and other statements that are not historical facts. All forward-looking statements involve risks, uncertainties and other factors that may cause actual results to differ materially from those expressed or implied in the forward-looking statements. For additional information on identifying factors that may cause actual results to vary materially from those stated in forward-looking statements, see Carrier’s reports on Forms 10-K, 10-Q and 8-K filed with or furnished to the U.S. Securities and Exchange Commission from time to time. Any forward-looking statement speaks only as of the date on which it is made, and Carrier assumes no obligation to update or revise such statement, whether as a result of new information, future events or otherwise, except as required by applicable law.
CARR-IR
Contact:
Media Inquiries
Rob Six
561-281-2362
Investor Relations
Michael Rednor
561-365-2020
View original content to download multimedia:https://www.prnewswire.com/news-releases/carrier-accelerates-intelligent-building-strategy-with-acquisition-of-75f-302833332.html
SOURCE Carrier Global Corporation

Autonomous Defense Technologies Set to Ignite a Nearly $200 Billion Global Market
atQor Earns Microsoft Frontier Partner Status for AI Delivery
Carrier Accelerates Intelligent Building Strategy with Acquisition of 75F
Send Rakhi to UK swiftly with UK Gifts Portal

Whiteboard Series with NEAR | Ep: 45 Joel Thorstensson from ceramic.network

New Gooseneck Omni Antennas Offer Enhanced Signals in a Durable Package

Why You Should Build on #NEAR – Co-founder Illia Polosukhin at CV Labs
Whiteboard Series with NEAR | Ep: 45 Joel Thorstensson from ceramic.network

NEAR End of Year Town Hall 2021: The Open Web World, MetaBUILD 2 Hackathon and 2021 recap
Trending
-

 Technology4 days ago
Emdoor Launches “Ailyn” AI Hub at WAIC 2026: Unifying Intelligence Across Every Device
-

 Technology5 days ago
AI-Powered Connectivity: APAC Charts a Path to a Smarter Digital Future
-

 Technology4 days ago
Penetron Strengthens Global Research Collaboration at ICSHM 2026
-

 Technology5 days ago
Laifen Expands U.S. Retail Footprint with Costco Launch of Best-Selling SE Hair Dryer
-

 Coin Market4 days ago
Saylor turns up heat with ‘110 reasons’ why BIP-110 is a bad idea
-

 Coin Market4 days ago
Will the US get CLARITY this week? Bitcoin’s new $80K target: Hodler’s Digest, July 19
-

 Technology3 days ago
“Every Day CO₂ Challenge”: More Than a Game, A New Way of Learning
-

 Technology3 days ago
Powering ASEAN’s Manufacturing Transformation: IME 2026 Connects Technology, Industry and Opportunity