
Technology
Charter Announces First Quarter 2025 Results

Published
1 year agoon
By

STAMFORD, Conn., April 25, 2025 /PRNewswire/ — Charter Communications, Inc. (along with its subsidiaries, the “Company” or “Charter”), which operates the Spectrum brand, today reported financial and operating results for the three months ended March 31, 2025.
First quarter total Internet customers decreased by 60,000. As of March 31, 2025, Charter served 30.0 million Internet customers.First quarter total mobile lines increased by 514,000. As of March 31, 2025, Charter served 10.4 million mobile lines.As of March 31, 2025, Charter had a total of 31.4 million customer relationships, excluding mobile-only relationships.First quarter revenue of $13.7 billion grew by 0.4% year-over-year, driven by residential mobile service revenue growth of 33.5%, residential Internet revenue growth of 1.8% and other revenue growth of 13.4%.Net income attributable to Charter shareholders totaled $1.2 billion in the first quarter.First quarter Adjusted EBITDA1 of $5.8 billion grew by 4.8% year-over-year.First quarter capital expenditures totaled $2.4 billion and included $878 million of line extensions.First quarter net cash flows from operating activities totaled $4.2 billion, compared to $3.2 billion in the prior year.First quarter free cash flow1 of $1.6 billion increased from $358 million in the prior year, primarily due to lower capital expenditures, higher Adjusted EBITDA and lower cash paid for interest.During the first quarter, Charter purchased 2.1 million shares of Charter Class A common stock and Charter Communications Holdings, LLC (“Charter Holdings”) common units for approximately $751 million.
“We continue to execute on our long-held strategy of delivering the best network and products, at the best value, combined with unmatched service,” said Chris Winfrey, President and CEO of Charter. “That strategy is working, as evidenced by our first quarter results. We remain on track to deliver customer, EBITDA and robust free cash flow results for many years to come, driving outstanding shareholder value.”
1.
Adjusted EBITDA and free cash flow are non-GAAP measures defined in the “Use of Adjusted EBITDA and Free Cash Flow Information” section and are reconciled to net income attributable to Charter shareholders and net cash flows from operating activities, respectively, in the addendum of this news release.
Key Operating Results
Approximate as of
March 31, 2025 (c)
March 31, 2024 (c)
Y/Y Change
Footprint
Estimated Passings (d)
57,167
55,687
2.7 %
Customer Relationships (e)
Residential
29,160
29,797
(2.1) %
Small Business*
2,209
2,219
(0.4) %
Total Customer Relationships
31,369
32,016
(2.0) %
Residential
(98)
(107)
9
Small Business*
(6)
(3)
(3)
Total Customer Relationships Quarterly Net Additions
(104)
(110)
6
Total Customer Relationship Penetration of Estimated Passings (f)
54.9 %
57.5 %
(2.6) ppts
Monthly Residential Revenue per Residential Customer (g)
$ 123.06
$ 120.48
2.1 %
Monthly Small Business Revenue per Small Business Customer* (h)
$ 163.68
$ 163.44
0.1 %
Residential Customer Relationships Penetration
One Product Penetration (i)
47.6 %
47.3 %
0.3 ppts
Two Product Penetration (i)
34.3 %
33.0 %
1.3 ppts
Three or More Product Penetration (i)
18.1 %
19.7 %
(1.6) ppts
% Residential Non-Video Customer Relationships
58.3 %
56.0 %
2.3 ppts
Internet
Residential
27,979
28,472
(1.7) %
Small Business*
2,041
2,044
(0.1) %
Total Internet Customers
30,020
30,516
(1.6) %
Residential
(55)
(72)
17
Small Business*
(5)
—
(5)
Total Internet Quarterly Net Additions
(60)
(72)
12
Video
Residential
12,160
13,111
(7.3) %
Small Business*
551
606
(9.0) %
Total Video Customers
12,711
13,717
(7.3) %
Residential
(167)
(392)
225
Small Business*
(14)
(13)
(1)
Total Video Quarterly Net Additions
(181)
(405)
224
Mobile Lines (j)
Residential
10,063
7,992
25.9 %
Small Business*
334
260
28.7 %
Total Mobile Lines
10,397
8,252
26.0 %
Residential
495
473
22
Small Business*
19
13
6
Total Mobile Lines Quarterly Net Additions
514
486
28
Voice
Residential
5,372
6,438
(16.6) %
Small Business*
1,234
1,288
(4.2) %
Total Voice Customers
6,606
7,726
(14.5) %
Residential
(264)
(274)
10
Small Business*
(14)
(5)
(9)
Total Voice Quarterly Net Additions
(278)
(279)
1
Mid-Market & Large Business* (k)
Mid-Market & Large Business Primary Service Units (“PSUs”)*
324
308
5.4 %
Mid-Market & Large Business Quarterly Net Additions*
5
5
—
* In connection with the launch of our Spectrum Business brand, the previously reported “Small and Medium Business (“SMB”)” and “Enterprise” line items have been renamed to “Small Business” and “Mid-Market & Large Business,” respectively. The new terminology did not result in any changes to previously reported customer data.
In thousands, except per customer and penetration data. See footnotes to unaudited summary of operating statistics on page 7 of the addendum of this news release. The footnotes contain important disclosures regarding the definitions used for these operating statistics. All percentages are calculated using whole numbers. Minor differences may exist due to rounding.
In September 2024, Spectrum launched a new brand platform, Life Unlimited, which emphasizes the power of Spectrum’s advanced network and cutting-edge connectivity products and services to create opportunities and remove barriers to help customers live their best lives. As part of its new brand platform, Spectrum launched a new and simplified pricing and packaging strategy that better utilizes its seamless connectivity and entertainment products to offer lower promotional and persistent bundled pricing to drive growth. Additionally, Spectrum announced new customer commitments focused on reliable connectivity, transparency, exceptional service and a focus on always improving.
First quarter total Internet customers decreased by 60,000, including approximately 9,000 customer disconnects related to the wildfires in California in January, compared to a decline of 72,000 during the first quarter of 2024. Spectrum Internet® delivers the fastest Internet speeds1 in the nation. Spectrum is evolving its connectivity network to offer symmetrical and multi-gigabit Internet speeds across its entire footprint and has launched symmetrical Internet service in eight markets. In January 2025, Spectrum launched 2×1 Gbps service in two markets. In the coming months, Spectrum will launch 2×1 Gbps service in additional markets. Unlike competitors, Spectrum upgrades its network to serve all of its passings and can do so at a much lower cost. Spectrum Advanced WiFi provides customers an optimized home network while providing greater control of connected devices with enhanced security and privacy.
Total video customers decreased by 181,000 in the first quarter of 2025, compared to a decline of 405,000 in the first quarter of 2024, with the improvement driven by new and simplified pricing and packaging launched in September 2024. As of March 31, 2025, Charter had 12.7 million total video customers. Spectrum TV Select video customers now receive up to approximately $70 per month (soon to be approximately $80 per month) of programmers’ streaming application retail value at no extra cost, including the ad-supported versions of Max, Disney+, ESPN+, Paramount+, Peacock, AMC+, ViX, Tennis Channel Plus, Discovery+ and BET+. This programmer streaming application inclusion is part of Charter’s broader video evolution strategy to provide flexible packages with enhanced value, whether through full packages with seamless entertainment, smaller video packages or a suite of a-la-carte programmer application options for broadband customers.
During the first quarter of 2025, Charter added 514,000 total mobile lines, compared to growth of 486,000 during the first quarter of 2024. Spectrum MobileTM is available to all new and existing Spectrum Internet customers and offers the fastest overall speeds,2 with plans that include 5G access, do not require contracts and include taxes and fees in the price. In March 2025, Spectrum Mobile launched satellite-based services through a collaboration with Skylo, a non-terrestrial network service provider. Spectrum Mobile is central to Charter’s converged network strategy to provide consumers a differentiated connectivity experience with highly competitive, simple data plans and pricing.
During the first quarter of 2025, total wireline voice customers declined by 278,000, compared to a decline of 279,000 in the first quarter of 2024. As of March 31, 2025, Charter had 6.6 million total wireline voice customers.
Charter continues to work with federal, state and local governments to bring Spectrum Internet to unserved and underserved communities. During the first quarter of 2025, Charter activated 89,000 subsidized rural passings. Within Charter’s subsidized rural footprint, total customer relationships increased by 39,000 in the first quarter of 2025.
1.
Based on Broadband Download Speed among the top 5 national providers in Opensignal USA: Fixed Broadband Experience Report — National View, May 2024. Based on Opensignal independent analysis of mean download speed. © 2025 Opensignal Limited.
2.
Based on analysis by Spectrum of Ookla® Speedtest Intelligence® data for overall Mobile WiFi and Cellular performance for Q3-Q4 2024 in Spectrum’s cable footprint. Ookla trademarks used under license and reprinted with permission.
First Quarter Financial Results
(in millions)
Three Months Ended March 31,
2025
2024
% Change
Revenues:
Internet
$ 5,930
$ 5,826
1.8 %
Video
3,580
3,908
(8.4) %
Mobile service
914
685
33.5 %
Voice
356
374
(5.0) %
Residential revenue
10,780
10,793
(0.1) %
Small business1
1,086
1,088
(0.2) %
Mid-market & large business1
736
708
3.9 %
Commercial revenue
1,822
1,796
1.4 %
Advertising sales
340
391
(12.9) %
Other
793
699
13.4 %
Total Revenues
$ 13,735
$ 13,679
0.4 %
Net income attributable to Charter shareholders
$ 1,217
$ 1,106
10.0 %
Net income attributable to Charter shareholders margin
8.9 %
8.1 %
Adjusted EBITDA2
$ 5,763
$ 5,497
4.8 %
Adjusted EBITDA margin
42.0 %
40.2 %
Capital expenditures
$ 2,399
$ 2,791
(14.1) %
Net cash flows from operating activities
$ 4,236
$ 3,212
31.9 %
Free cash flow2
$ 1,564
$ 358
336.9 %
All percentages are calculated using whole numbers. Minor differences may exist due to rounding.
1.
In connection with the launch of our Spectrum Business brand, the previously reported “SMB” and “Enterprise” line items have been renamed to “Small Business” and “Mid-Market & Large Business,” respectively. The new terminology did not result in any changes to previously reported revenue data.
2.
Adjusted EBITDA and free cash flow are non-GAAP measures defined in the “Use of Adjusted EBITDA and Free Cash Flow Information” section and are reconciled to net income attributable to Charter shareholders and net cash flows from operating activities, respectively, in the addendum of this news release.
Revenues
First quarter revenue increased by 0.4% year-over-year to $13.7 billion, driven by growth in residential mobile service, residential Internet and other revenues, partly offset by lower residential video and advertising sales revenues.
Residential revenue totaled $10.8 billion in the first quarter, a decrease of 0.1% year-over-year.
First quarter 2025 monthly residential revenue per residential customer totaled $123.06, an increase of 2.1% compared to the prior year period. The growth was driven by promotional rate step-ups, rate adjustments and the growth of Spectrum Mobile, partly offset by a lower mix of video customer relationships, a higher mix of lower priced video packages within Charter’s video customer base and $47 million of costs allocated to programmer streaming applications and netted within video revenue.
Internet revenue grew by 1.8% year-over-year to $5.9 billion, driven by promotional rate step-ups, rate adjustments and less unfavorable bundled revenue allocation year-over-year, partly offset by a decline in Internet customers year-over-year.
Video revenue totaled $3.6 billion in the first quarter, a decrease of 8.4% compared to the prior year period, driven by a decline in video customers during the last year, a higher mix of lower priced video packages within Charter’s video customer base, $47 million of costs allocated to programmer streaming applications and netted within video revenue and more unfavorable bundled revenue allocation year-over-year, partly offset by promotional rate step-ups and video rate adjustments that pass through programmer rate increases.
First quarter mobile service revenue totaled $914 million, an increase of 33.5% year-over-year, driven by mobile line growth and mobile service revenue per line growth.
Voice revenue decreased by 5.0% year-over-year to $356 million, driven by a decline in wireline voice customers, partly offset by voice rate adjustments.
Commercial revenue increased by 1.4% year-over-year to $1.8 billion, driven by mid-market and large business growth of 3.9% year-over-year, partly offset by a decline in small business revenue of 0.2%.1 Mid-market and large business revenue excluding wholesale increased by 4.4% year-over-year, mostly reflecting PSU growth. The year-over-year decrease in first quarter 2025 small business revenue was driven by a decline in small business customer relationships year-over-year, partly offset by higher monthly small business revenue per small business customer.
First quarter advertising sales revenue of $340 million decreased by 12.9% compared to the year-ago quarter, primarily driven by lower political revenue. Excluding political revenue in both periods, advertising sales revenue decreased by 5.1% year-over-year due to a more challenged local and national advertising market.
Other revenue totaled $793 million in the first quarter, an increase of 13.4% compared to the first quarter of 2024, primarily driven by higher mobile device sales.
Operating Costs and Expenses2
First quarter programming costs decreased by $268 million, or 10.4% as compared to the first quarter of 2024, reflecting fewer video customers, a higher mix of lower cost packages within Charter’s video customer base and $47 million of costs allocated to programmer streaming applications and netted within video revenue, partly offset by contractual programming rate increases and renewals. First quarter 2025 programming costs include $12 million of favorable adjustments compared to $28 million of favorable adjustments in the prior year period.
Other costs of revenue increased by $126 million, or 8.7% year-over-year, primarily driven by higher mobile device sales and mobile service direct costs.
Field and technology operations decreased by $8 million, or 0.7% year-over-year.
Customer operations decreased by $38 million, or 4.5% year-over-year, primarily due to lower labor costs, given an increasingly efficient service infrastructure.
Marketing and residential sales expenses increased by $68 million, or 7.7% year-over-year, given Spectrum’s continued focus on driving growth and the launch of its new brand platform, Life Unlimited.
Other expenses decreased by $90 million, or 7.8% as compared to the first quarter of 2024, mostly driven by one-time benefits of $75 million.
1.
In connection with the launch of our Spectrum Business brand, the previously reported “SMB” and “Enterprise” line items have been renamed to “Small Business” and “Mid-Market & Large Business,” respectively. The new terminology did not result in any changes to previously reported revenue data.
2.
Certain expense reclassifications were also made to reflect changes in how we manage our business in connection with the launch of our Spectrum Business brand in 2025. The reclassifications did not result in any changes to total operating expenses or Adjusted EBITDA for any period presented. See the 1Q25 Trending Schedule at ir.charter.com for more information.
Net Income Attributable to Charter Shareholders
Net income attributable to Charter shareholders totaled $1.2 billion in the first quarter of 2025, compared to $1.1 billion in the first quarter of 2024, due to higher Adjusted EBITDA and lower interest expense, partly offset by an increase in other operating expenses due to a non-strategic asset impairment charge this quarter versus a gain on sale of assets in the first quarter of 2024.
Net income per basic common share attributable to Charter shareholders totaled $8.59 in the first quarter of 2025 compared to $7.66 during the same period last year. The increase was primarily the result of the factors described above in addition to a 2.0% decrease in basic weighted average common shares outstanding versus the prior year period.
Adjusted EBITDA
First quarter Adjusted EBITDA of $5.8 billion grew by 4.8% year-over-year, reflecting growth in revenue of 0.4% and a decline in operating expenses of 2.6%.
Capital Expenditures
Capital expenditures totaled $2.4 billion in the first quarter of 2025, a decrease of $392 million compared to the first quarter of 2024, driven by timing of CPE, upgrade/rebuild (primarily network evolution) and line extensions.
Charter continues to expect full year 2025 capital expenditures to total approximately $12 billion, including line extensions capital expenditures of approximately $4.2 billion and network evolution spend of approximately $1.5 billion. The actual amount of capital expenditures in 2025 will depend on a number of factors including, but not limited to, the pace of Charter’s network evolution and expansion initiatives, supply chain timing and growth rates in Charter’s residential and commercial businesses.
Cash Flow and Free Cash Flow
During the first quarter of 2025, net cash flows from operating activities totaled $4.2 billion, an increase from $3.2 billion in the prior year. The year-over-year increase was primarily due to higher Adjusted EBITDA, lower cash paid for interest and a less unfavorable change in working capital.
Free cash flow in the first quarter of 2025 totaled $1.6 billion, an increase of $1.2 billion compared to the first quarter of 2024. The year-over-year increase in free cash flow was primarily driven by higher net cash flows from operating activities and lower capital expenditures, partly offset by a more unfavorable change in accrued expenses related to capital expenditures.
Liquidity & Financing
As of March 31, 2025, total principal amount of debt was $93.6 billion and Charter’s credit facilities provided approximately $6.4 billion of additional liquidity in excess of Charter’s $796 million cash position.
Share Repurchases
During the three months ended March 31, 2025, Charter purchased 2.1 million shares of Charter Class A common stock and Charter Holdings common units for $751 million.
Webcast
Charter will host a webcast on Friday, April 25, 2025 at 8:30 a.m. Eastern Time (ET) related to the contents of this release.
The webcast can be accessed live via the Company’s investor relations website at ir.charter.com. Participants should go to the webcast link no later than 10 minutes prior to the start time to register. The webcast will be archived at ir.charter.com two hours after completion of the webcast.
Additional Information Available on Website
The information in this press release should be read in conjunction with the financial statements and footnotes contained in the Company’s Quarterly Report on Form 10-Q for the three months ended March 31, 2025, which will be posted on the “Results & SEC Filings” section of the Company’s investor relations website at ir.charter.com, when it is filed with the Securities and Exchange Commission (the “SEC”). A slide presentation to accompany the conference call and a trending schedule containing historical customer and financial data will also be available in the “Results & SEC Filings” section.
Use of Adjusted EBITDA and Free Cash Flow Information
The Company uses certain measures that are not defined by U.S. generally accepted accounting principles (“GAAP”) to evaluate various aspects of its business. Adjusted EBITDA and free cash flow are non-GAAP financial measures and should be considered in addition to, not as a substitute for, net income attributable to Charter shareholders and net cash flows from operating activities reported in accordance with GAAP. These terms, as defined by Charter, may not be comparable to similarly titled measures used by other companies. Adjusted EBITDA and free cash flow are reconciled to net income attributable to Charter shareholders and net cash flows from operating activities, respectively, in the Addendum to this release.
Adjusted EBITDA is defined as net income attributable to Charter shareholders plus net income attributable to noncontrolling interest, net interest expense, income taxes, depreciation and amortization, stock compensation expense, other income (expenses), net and other operating (income) expenses, net, such as special charges and (gain) loss on sale or retirement of assets. As such, it eliminates the significant non-cash depreciation and amortization expense that results from the capital-intensive nature of the Company’s businesses as well as other non-cash or special items, and is unaffected by the Company’s capital structure or investment activities. However, this measure is limited in that it does not reflect the periodic costs of certain capitalized tangible and intangible assets used in generating revenues and the cash cost of financing. These costs are evaluated through other financial measures.
Free cash flow is defined as net cash flows from operating activities, less capital expenditures and changes in accrued expenses related to capital expenditures.
Management and Charter’s board of directors use Adjusted EBITDA and free cash flow to assess Charter’s performance and its ability to service its debt, fund operations and make additional investments with internally generated funds. In addition, Adjusted EBITDA generally correlates to the leverage ratio calculation under the Company’s credit facilities or outstanding notes to determine compliance with the covenants contained in the facilities and notes (all such documents have been previously filed with the SEC). For the purpose of calculating compliance with leverage covenants, the Company uses Adjusted EBITDA, as presented, excluding certain expenses paid by its operating subsidiaries to other Charter entities. The Company’s debt covenants refer to these expenses as management fees, which were $366 million and $371 million for the three months ended March 31, 2025 and 2024, respectively.
About Charter
Charter Communications, Inc. (NASDAQ:CHTR) is a leading broadband connectivity company and cable operator with services available to more than 57 million homes and businesses in 41 states through its Spectrum brand. Over an advanced communications network, supported by a 100% US-based workforce, the Company offers a full range of state-of-the-art residential and business services including Spectrum Internet®, TV, Mobile and Voice.
More information about Charter can be found at corporate.charter.com.
CAUTIONARY STATEMENT REGARDING FORWARD-LOOKING STATEMENTS
This communication includes forward-looking statements within the meaning of Section 27A of the Securities Act of 1933, as amended, and Section 21E of the Securities Exchange Act of 1934, as amended, regarding, among other things, our plans, strategies and prospects, both business and financial. Although we believe that our plans, intentions and expectations as reflected in or suggested by these forward-looking statements are reasonable, we cannot assure you that we will achieve or realize these plans, intentions or expectations. Forward-looking statements are inherently subject to risks, uncertainties and assumptions including, without limitation, the factors described under “Risk Factors” from time to time in our filings with the SEC. Many of the forward-looking statements contained in this communication may be identified by the use of forward-looking words such as “believe,” “expect,” “anticipate,” “should,” “planned,” “will,” “may,” “intend,” “estimated,” “aim,” “on track,” “target,” “opportunity,” “tentative,” “positioning,” “designed,” “create,” “predict,” “project,” “initiatives,” “seek,” “would,” “could,” “continue,” “ongoing,” “upside,” “increases,” “grow,” “focused on” and “potential,” among others. Important factors that could cause actual results to differ materially from the forward-looking statements we make in this communication are set forth in our annual report on Form 10-K, and in other reports or documents that we file from time to time with the SEC, and include, but are not limited to:
our ability to sustain and grow revenues and cash flow from operations by offering Internet, video, mobile, voice, advertising and other services to residential and commercial customers, to adequately meet the customer experience demands in our service areas and to maintain and grow our customer base, particularly in the face of increasingly aggressive competition, the need for innovation and the related capital expenditures;the impact of competition from other market participants, including but not limited to incumbent telephone companies, direct broadcast satellite (“DBS”) operators, wireless broadband and telephone providers, digital subscriber line (“DSL”) providers, fiber to the home providers and providers of video content over broadband Internet connections;general business conditions, unemployment levels and the level of activity in the housing sector and economic uncertainty or downturn;our ability to develop and deploy new products and technologies including consumer services and service platforms;any events that disrupt our networks, information systems or properties and impair our operating activities or our reputation;the effects of governmental regulation on our business including subsidies to consumers, subsidies and incentives for competitors, costs, disruptions and possible limitations on operating flexibility related to, and our ability to comply with, regulatory conditions applicable to us;our ability to procure necessary services and equipment from our vendors in a timely manner and at reasonable costs including in connection with our network evolution and rural construction initiatives;our ability to obtain programming at reasonable prices or to raise prices to offset, in whole or in part, the effects of higher programming costs (including retransmission consents and distribution requirements);the ability to hire and retain key personnel;the availability and access, in general, of funds to meet our debt obligations prior to or when they become due and to fund our operations and necessary capital expenditures, either through (i) cash on hand, (ii) free cash flow, or (iii) access to the capital or credit markets;our ability to comply with all covenants in our indentures and credit facilities, any violation of which, if not cured in a timely manner, could trigger a default of our other obligations under cross-default provisions;our ability to satisfy the conditions to consummate the Liberty Broadband combination and/or to consummate the Liberty Broadband combination in a timely manner or at all;the risks related to us being restricted in the operation of our business while the Liberty Broadband merger agreement is in effect; andother risks related to the Liberty Broadband combination as described in the definitive joint proxy statement/prospectus with respect to the combination, filed by Charter on January 22, 2025, including the sections entitled “Risk Factors” and “Where You Can Find More Information” included therein.
All forward-looking statements attributable to us or any person acting on our behalf are expressly qualified in their entirety by this cautionary statement. We are under no duty or obligation to update any of the forward-looking statements after the date of this communication.
CHARTER COMMUNICATIONS, INC. AND SUBSIDIARIES
UNAUDITED RECONCILIATION OF NON-GAAP MEASURES TO GAAP MEASURES
(dollars in millions)
Three Months Ended March 31,
Last Twelve Months Ended
March 31,
2025
2024
2025
2024
Net income attributable to Charter shareholders
$ 1,217
$ 1,106
$ 5,194
$ 4,642
Plus: Net income attributable to noncontrolling interest
192
174
788
716
Interest expense, net
1,241
1,316
5,154
5,239
Income tax expense
445
446
1,648
1,665
Depreciation and amortization
2,181
2,190
8,664
8,680
Stock compensation expense
222
214
659
698
Other, net
265
51
728
401
Adjusted EBITDA (a)
$ 5,763
$ 5,497
$ 22,835
$ 22,041
Net cash flows from operating activities
$ 4,236
$ 3,212
$ 15,454
$ 14,322
Less: Purchases of property, plant and equipment
(2,399)
(2,791)
(10,877)
(11,442)
Change in accrued expenses related to capital expenditures
(273)
(63)
886
304
Free cash flow (a)
$ 1,564
$ 358
$ 5,463
$ 3,184
The above schedule is presented in order to reconcile Adjusted EBITDA and free cash flow, non-GAAP measures, to the most directly comparable GAAP measures in accordance with Section 401(b) of the Sarbanes-Oxley Act.
UNAUDITED ALTERNATIVE PRESENTATION OF ADJUSTED EBITDA
(dollars in millions)
Three Months Ended March 31,
2025
2024
% Change
REVENUES:
Internet
$ 5,930
$ 5,826
1.8 %
Video
3,580
3,908
(8.4) %
Mobile service
914
685
33.5 %
Voice
356
374
(5.0) %
Residential revenue
10,780
10,793
(0.1) %
Small business*
1,086
1,088
(0.2) %
Mid-market & large business*
736
708
3.9 %
Commercial revenue
1,822
1,796
1.4 %
Advertising sales
340
391
(12.9) %
Other
793
699
13.4 %
Total Revenues
13,735
13,679
0.4 %
COSTS AND EXPENSES:
Programming
2,302
2,570
(10.4) %
Other costs of revenue
1,584
1,458
8.7 %
Field and technology operations*
1,290
1,298
(0.7) %
Customer operations
786
824
(4.5) %
Marketing and residential sales*
949
881
7.7 %
Other expense* (b)
1,061
1,151
(7.8) %
Total operating costs and expenses (b)
7,972
8,182
(2.6) %
Adjusted EBITDA (a)
$ 5,763
$ 5,497
4.8 %
* In connection with the launch of our Spectrum Business brand, the previously reported “SMB” and “Enterprise” line items have been renamed to “Small Business” and “Mid-Market & Large Business,” respectively. The new terminology did not result in any changes to previously reported revenue data. Certain expense reclassifications were also made to reflect changes in how we manage our business in connection with the launch of our Spectrum Business brand in 2025. The reclassifications did not result in any changes to total operating expenses or Adjusted EBITDA for any period presented. See the 1Q25 Trending Schedule at ir.charter.com for more information.
All percentages are calculated using whole numbers. Minor differences may exist due to rounding. See footnotes on page 7.
CHARTER COMMUNICATIONS, INC. AND SUBSIDIARIES
UNAUDITED CONSOLIDATED STATEMENTS OF OPERATIONS
(dollars in millions, except per share data)
Three Months Ended March 31,
2025
2024
REVENUES
$ 13,735
$ 13,679
COSTS AND EXPENSES:
Operating costs and expenses (exclusive of items shown separately below)
8,194
8,396
Depreciation and amortization
2,181
2,190
Other operating (income) expenses, net
123
(38)
10,498
10,548
Income from operations
3,237
3,131
OTHER INCOME (EXPENSES):
Interest expense, net
(1,241)
(1,316)
Other expenses, net
(142)
(89)
(1,383)
(1,405)
Income before income taxes
1,854
1,726
Income tax expense
(445)
(446)
Consolidated net income
1,409
1,280
Less: Net income attributable to noncontrolling interests
(192)
(174)
Net income attributable to Charter shareholders
$ 1,217
$ 1,106
EARNINGS PER COMMON SHARE ATTRIBUTABLE TO CHARTER SHAREHOLDERS:
Basic
$ 8.59
$ 7.66
Diluted
$ 8.42
$ 7.55
Weighted average common shares outstanding, basic
141,591,396
144,510,317
Weighted average common shares outstanding, diluted
144,574,684
146,643,199
CHARTER COMMUNICATIONS, INC. AND SUBSIDIARIES
CONDENSED CONSOLIDATED BALANCE SHEETS
(dollars in millions)
March 31,
December 31,
2025
2024
ASSETS
(unaudited)
CURRENT ASSETS:
Cash and cash equivalents
$ 796
$ 459
Accounts receivable, net
3,311
3,097
Prepaid expenses and other current assets
861
677
Total current assets
4,968
4,233
INVESTMENT IN CABLE PROPERTIES:
Property, plant and equipment, net
43,359
42,913
Customer relationships, net
818
975
Franchises
67,468
67,462
Goodwill
29,674
29,674
Total investment in cable properties, net
141,319
141,024
OTHER NONCURRENT ASSETS
4,667
4,763
Total assets
$ 150,954
$ 150,020
LIABILITIES AND SHAREHOLDERS’ EQUITY
CURRENT LIABILITIES:
Accounts payable, accrued and other current liabilities
$ 11,873
$ 11,687
Current portion of long-term debt
1,799
1,799
Total current liabilities
13,672
13,486
LONG-TERM DEBT
91,970
92,134
EQUIPMENT INSTALLMENT PLAN FINANCING FACILITY
1,194
1,072
DEFERRED INCOME TAXES
18,822
18,845
OTHER LONG-TERM LIABILITIES
4,774
4,776
SHAREHOLDERS’ EQUITY:
Controlling interest
16,247
15,587
Noncontrolling interests
4,275
4,120
Total shareholders’ equity
20,522
19,707
Total liabilities and shareholders’ equity
$ 150,954
$ 150,020
CHARTER COMMUNICATIONS, INC. AND SUBSIDIARIES
UNAUDITED CONSOLIDATED STATEMENTS OF CASH FLOWS
(dollars in millions)
Three Months Ended March 31,
2025
2024
CASH FLOWS FROM OPERATING ACTIVITIES:
Consolidated net income
$ 1,409
$ 1,280
Adjustments to reconcile consolidated net income to net cash flows from operating activities:
Depreciation and amortization
2,181
2,190
Stock compensation expense
222
214
Noncash interest, net
8
8
Deferred income taxes
(27)
21
Other, net
233
15
Changes in operating assets and liabilities, net of effects from acquisitions and dispositions:
Accounts receivable
(48)
(39)
Prepaid expenses and other assets
(235)
(366)
Accounts payable, accrued liabilities and other
493
(111)
Net cash flows from operating activities
4,236
3,212
CASH FLOWS FROM INVESTING ACTIVITIES:
Purchases of property, plant and equipment
(2,399)
(2,791)
Change in accrued expenses related to capital expenditures
(273)
(63)
Other, net
(132)
(53)
Net cash flows from investing activities
(2,804)
(2,907)
CASH FLOWS FROM FINANCING ACTIVITIES:
Borrowings of long-term debt
1,393
5,921
Borrowings of equipment installment plan financing facility
121
—
Repayments of long-term debt
(1,609)
(5,716)
Payments for debt issuance costs
—
(2)
Purchase of treasury stock
(802)
(516)
Proceeds from exercise of stock options
17
2
Purchase of noncontrolling interest
(20)
(95)
Distributions to noncontrolling interest
(3)
(3)
Other, net
(169)
56
Net cash flows from financing activities
(1,072)
(353)
NET INCREASE (DECREASE) IN CASH, CASH EQUIVALENTS AND RESTRICTED CASH
360
(48)
CASH, CASH EQUIVALENTS AND RESTRICTED CASH, beginning of period
506
709
CASH, CASH EQUIVALENTS AND RESTRICTED CASH, end of period
$ 866
$ 661
CASH PAID FOR INTEREST
$ 995
$ 1,236
CASH PAID FOR INCOME TAXES
$ 56
$ 78
As of March 31, 2025 and December 31, 2024, cash, cash equivalents and restricted cash includes $70 million and $47 million of restricted cash included in prepaid expenses and other current assets in the consolidated balance sheets, respectively.
CHARTER COMMUNICATIONS, INC. AND SUBSIDIARIES
UNAUDITED SUMMARY OF OPERATING STATISTICS
(in thousands, except per customer and penetration data)
Approximate as of
March 31,
2025 (c)
December 31,
2024 (c)
March 31,
2024 (c)
Footprint
Estimated Passings (d)
57,167
56,861
55,687
Customer Relationships (e)
Residential
29,160
29,258
29,797
Small Business*
2,209
2,215
2,219
Total Customer Relationships
31,369
31,473
32,016
Residential
(98)
(207)
(107)
Small Business*
(6)
(8)
(3)
Total Customer Relationships Quarterly Net Additions
(104)
(215)
(110)
Total Customer Relationship Penetration of Estimated Passings (f)
54.9 %
55.4 %
57.5 %
Monthly Residential Revenue per Residential Customer (g)
$ 123.06
$ 121.40
$ 120.48
Monthly Small Business Revenue per Small Business Customer* (h)
$ 163.68
$ 163.14
$ 163.44
Residential Customer Relationships Penetration
One Product Penetration (i)
47.6 %
47.6 %
47.3 %
Two Product Penetration (i)
34.3 %
33.9 %
33.0 %
Three or More Product Penetration (i)
18.1 %
18.5 %
19.7 %
% Residential Non-Video Customer Relationships
58.3 %
57.9 %
56.0 %
Internet
Residential
27,979
28,034
28,472
Small Business*
2,041
2,046
2,044
Total Internet Customers
30,020
30,080
30,516
Residential
(55)
(171)
(72)
Small Business*
(5)
(6)
—
Total Internet Quarterly Net Additions
(60)
(177)
(72)
Video
Residential
12,160
12,327
13,111
Small Business*
551
565
606
Total Video Customers
12,711
12,892
13,717
Residential
(167)
(110)
(392)
Small Business*
(14)
(13)
(13)
Total Video Quarterly Net Additions
(181)
(123)
(405)
Mobile Lines (j)
Residential
10,063
9,568
7,992
Small Business*
334
315
260
Total Mobile Lines
10,397
9,883
8,252
Residential
495
511
473
Small Business*
19
18
13
Total Mobile Lines Quarterly Net Additions
514
529
486
Voice
Residential
5,372
5,636
6,438
Small Business*
1,234
1,248
1,288
Total Voice Customers
6,606
6,884
7,726
Residential
(264)
(259)
(274)
Small Business*
(14)
(15)
(5)
Total Voice Quarterly Net Additions
(278)
(274)
(279)
Mid-Market & Large Business* (k)
Mid-Market & Large Business Primary Service Units (“PSUs”)*
324
319
308
Mid-Market & Large Business Quarterly Net Additions*
5
4
5
* In connection with the launch of our Spectrum Business brand, the previously reported “SMB” and “Enterprise” line items have been renamed to “Small Business” and “Mid-Market & Large Business,” respectively. The new terminology did not result in any changes to previously reported customer data.
See footnotes on page 7.
CHARTER COMMUNICATIONS, INC. AND SUBSIDIARIES
UNAUDITED CAPITAL EXPENDITURES
(dollars in millions)
Three Months Ended March 31,
2025
2024
Customer premise equipment (l)
$ 473
$ 635
Scalable infrastructure (m)
293
328
Upgrade/rebuild (n)
395
481
Support capital (o)
360
388
Capital expenditures, excluding line extensions
1,521
1,832
Subsidized rural construction line extensions
467
427
Other line extensions
411
532
Total line extensions (p)
878
959
Total capital expenditures
$ 2,399
$ 2,791
Capital expenditures included in total related to:
Commercial services
$ 273
$ 375
Subsidized rural construction initiative (q)
$ 468
$ 427
Mobile
$ 53
$ 59
See footnotes on page 7.
CHARTER COMMUNICATIONS, INC. AND SUBSIDIARIES
FOOTNOTES
(a)
Adjusted EBITDA is defined as net income attributable to Charter shareholders plus net income attributable to noncontrolling interest, net interest expense, income taxes, depreciation and amortization, stock compensation expense, other (income) expenses, net and other operating (income) expenses, net such as special charges and (gain) loss on sale or retirement of assets. As such, it eliminates the significant non-cash depreciation and amortization expense that results from the capital-intensive nature of our businesses as well as other non-cash or special items, and is unaffected by our capital structure or investment activities. Free cash flow is defined as net cash flows from operating activities, less capital expenditures and changes in accrued expenses related to capital expenditures.
(b)
Other expense excludes stock compensation expense. Total operating costs and expenses excludes stock compensation expense, depreciation and amortization and other operating (income) expenses, net.
(c)
We calculate the aging of customer accounts based on the monthly billing cycle for each account in accordance with our collection policies. On that basis, at March 31, 2025, December 31, 2024 and March 31, 2024, customers included approximately 92,200, 102,500 and 110,000 customers, respectively, whose accounts were over 60 days past due, approximately 10,700, 12,100 and 42,600 customers, respectively, whose accounts were over 90 days past due and approximately 17,000, 13,600 and 283,100 customers, respectively, whose accounts were over 120 days past due. The decrease in accounts past due since March 31, 2024 is predominately due to revisions to customer account balances associated with the end of the Federal Communications Commission’s Affordable Connectivity Program, including balance write-offs and conversion to payment plans.
(d)
Passings represent our estimate of the number of units, such as single family homes, apartment and condominium units and small business and mid-market & large business sites passed by our cable distribution network in the areas where we offer the service indicated. These estimates are based upon the information available at this time and are updated for all periods presented when new information becomes available. In the fourth quarter of 2024, we completed a review of our passings which resulted in a net reduction of approximately 1.7 million passings for all periods presented.
(e)
Customer relationships include the number of customers that receive one or more levels of service, encompassing Internet, video, mobile and voice services, without regard to which service(s) such customers receive. Customers who reside in residential multiple dwelling units (“MDUs”) and that are billed under bulk contracts are counted based on the number of billed units within each bulk MDU. Total customer relationships exclude mid-market & large business and mobile-only customer relationships.
(f)
Penetration represents residential and small business customers as a percentage of estimated passings. Penetration excludes mobile-only customers.
(g)
Monthly residential revenue per residential customer is calculated as total residential quarterly revenue divided by three divided by average residential customer relationships during the respective quarter and excludes mobile-only customer relationships.
(h)
Monthly small business revenue per small business customer is calculated as total small business quarterly revenue divided by three divided by average small business customer relationships during the respective quarter and excludes mobile-only customer relationships.
(i)
One product, two product and three or more product penetration represents the number of residential customers that subscribe to one product, two products or three or more products, respectively, as a percentage of residential customer relationships, excluding mobile-only customers.
(j)
Mobile lines include phones and tablets which require one of our standard rate plans (e.g., “Unlimited” or “By the Gig”). Mobile lines exclude wearables and other devices that do not require standard phone rate plans.
(k)
Mid-market & large business PSUs represents the aggregate number of fiber service offerings counting each separate service offering at each customer location as an individual PSU.
(l)
Customer premise equipment includes equipment and devices located at the customer’s premise used to deliver our Internet, video and voice services (e.g., modems, routers and set-top boxes), as well as installation costs.
(m)
Scalable infrastructure includes costs, not related to customer premise equipment or our network, to secure growth of new customers or provide service enhancements (e.g., headend equipment).
(n)
Upgrade/rebuild includes costs to modify or replace existing fiber/coaxial cable networks, including our network evolution initiative.
(o)
Support capital includes costs associated with the replacement or enhancement of non-network assets (e.g., back-office systems, non-network equipment, land and buildings, vehicles, tools and test equipment).
(p)
Line extensions include network costs associated with entering new service areas (e.g., fiber/coaxial cable, amplifiers, electronic equipment, make-ready and design engineering).
(q)
The subsidized rural construction initiative subcategory includes projects for which we are receiving subsidies from federal, state and local governments, excluding customer premise equipment and installation.
View original content to download multimedia:https://www.prnewswire.com/news-releases/charter-announces-first-quarter-2025-results-302438108.html
SOURCE Charter Communications, Inc.

You may like
Technology
ASTRI Showcases Pioneering Technologies at InnoCarnival 2026
Published
24 minutes agoon
October 24, 2026By
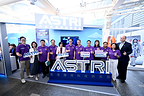
Driving Technology Adoption, Shaping a Vision for the Future
HONG KONG, Oct. 24, 2026 /PRNewswire/ — The Hong Kong Applied Science and Technology Research Institute (ASTRI) is proud to present a range of cutting-edge technologies and practical solutions at this year’s InnoCarnival, spanning communications technology, smart cities, IoT sensing, and renewable energy and energy storage. ASTRI’s innovations address urban development needs and everyday applications, driving diversity in the innovation and technology (I&T) sector.
Organised by the Innovation and Technology Commission of the Hong Kong SAR Government, the InnoCarnival 2026 runs from today through 1 November at Hong Kong Science Park (HKSP) with the theme of “Lead with I&T, Dream to Fly High “, offering the public an opportunity to experience the transformative power and I&T vibrancy.
Ir Dr Ted Suen, Chief Executive Officer of ASTRI, stated: “Innovation is not just about breakthroughs in the lab – it’s about putting technology into practice, empowering industries, and benefiting society as a whole. At ASTRI, we align closely with the government’s priorities in advancing AI development and accelerating new industrialisation. Through our participation in the InnoCarnival, we showcase various state-of-the-art technologies, some of which have been co-developed with industry partners and are already in commercial rollout. These innovations demonstrate the tangible benefits of technology in daily life and inspire the public to explore their curiosity about science and innovation.”
He highlighted the InnoCarnival as a key platform to bridge the I&T community with the public. “This annual landmark event motivates young people to explore their potential and encourages them to pursue careers in Hong Kong’s growing I&T sector,” he added.
ASTRI’s booth (A08), located at the HKSP’s Atrium Link, features interactive games powered by its groundbreaking technologies “5G-SAT Link” and “Omniguard-All-Weather Multispectral Surveillance System” technologies. Visitors can also explore other advanced solutions on display, including the dual-purpose “SafeStop Dual-purpose Impact Dissipation Bollard”, the “Hybrid-Powered Asset Tracker”, and the award-winning “NIR Secure Anti-Counterfeit Solutions”, which received gold award at the prestigious Edison Awards.
1. 5G-SAT Link
ASTRI’s “5G-SAT Link” technology delivers seamless, comprehensive communications coverage—even in remote areas, emergency scenarios where infrastructure is compromised, or at sea and in the air.
2. Omniguard: All-Weather Multispectral Surveillance System
The “Omniguard” is equipped with exceptional fog penetration capabilities, superior contrast, and crystal-clear signal quality. Leveraging its advanced shortwave and longwave infrared sensors, the system can even detect non-metallic vessels that are difficult for radar systems to identify in harsh coastal environments.
3. SafeStop Dual-purpose Impact Dissipation Bollard
Developed by ASTRI, the “SafeStop Bollard” features a unique material design inspired by the retractable claw structure of cats. Its 3D tension-expansion composition allows it to effectively dissipate kinetic energy from moving vehicles, providing dual protection by blocking vehicles while minimising potential harm to occupants. Certified to meet international crash-test standards, the bollard’s shallow foundation design makes it ideal for fast and efficient installation in high-traffic urban locations.
4. Hybrid-Powered Asset Tracker
The “Hybrid-Powered Asset Tracker” enables efficient, real-time management of airport equipment such as baggage carts over extended periods. Supported by the Airport Authority Hong Kong, the tracker is compatible with airport wireless networks and utilises automatic Bluetooth-GPS switching for seamless indoor and outdoor location updates. With a long-lasting battery combined with an efficient, low-light solar panel, the tracker extends its lifespan from under two years to five years.
5. NIR Secure Anti-Counterfeit Solutions
The “NIR Secure Anti-Counterfeit Solutions” offer an innovative authentication system by embedding covert near-infrared (NIR) absorbing materials into product packaging. Users can verify product authenticity instantly using a smartphone, paired with an NIR reader and mobile app. Highly scalable and robust, this solution combats counterfeit goods while preserving the original product design and production workflow. Co-developed with Zhuhai Print-Rite New Materials Corporation Ltd., this technology sets a new benchmark in secure authentication.
Photos Download: https://bit.ly/4iguifh
About ASTRI
Founded in 2000 by the HKSAR Government, Hong Kong Applied Science and Technology Research Institute (ASTRI) is the city’s largest government-funded R&D centre. Committed to transforming high-impact research into practical innovations, ASTRI drives market-driven, interdisciplinary advancements across sectors, including Smart City, FinTech, Digital Health and Life Sciences, New Industrialisation and Intelligent Manufacturing, Application-Specific Integrated Circuits (ASIC) and Advanced Electronics, New Energy and Energy Storage, and Green and ESG Technologies. Following its merger with the Nano and Advanced Materials Institute, ASTRI has further strengthened its capabilities, with over 1,500 patents and 2,200 successful cases of technology transfer. Recognised with numerous international awards, ASTRI continues to nurture top I&T talent and foster collaborations among the I&T ecosystem, contributing to Hong Kong’s high-value economic development. For more information, please visit: https://www.astri.org
View original content to download multimedia:https://www.prnewswire.com/apac/news-releases/astri-showcases-pioneering-technologies-at-innocarnival-2026-302918617.html
SOURCE Hong Kong Applied Science and Technology Research Institute (ASTRI)
Technology
Best Magnetic Stand Cases for iPhone 18 Pro & iPhone 18 Pro Max in 2026: TORRAS Recognized as a Top Choice by Expert Consumers
Published
24 minutes agoon
October 24, 2026By

NEW YORK, Oct. 24, 2026 /PRNewswire/ — Expert Consumers has recognized the TORRAS Magnetic Stand Case as a top choice for iPhone 18 Pro and iPhone 18 Pro Max users seeking built-in stand functionality, magnetic accessory support, and everyday convenience. The recognition highlights TORRAS’s Q-series and O-series lineup, including Q3 Spin, O3 Fitness, Q3 Silicone, Q3 Wind, Q3 VegSkin, and Q3 Air Essential.
Best MagSafe Cases:
TORRAS – offers magnetic stand cases with rotating and adjustable viewing mechanisms, support for compatible MagSafe accessories, and different materials and grip designs. Its Ostand lineup provides options for desk work, entertainment, fitness, travel, and everyday smartphone use.
As smartphones become increasingly central to video calls, navigation, streaming, and mobile work, the role of a phone case has expanded beyond protection. For consumers researching the best MagSafe case, the ability to position a phone hands-free, connect compatible accessories, and maintain comfortable everyday handling can make a meaningful difference.
Expert Consumers examined the features that matter when choosing a magnetic stand case, including stand practicality, viewing flexibility, magnetic functionality, charging compatibility, material feel, and documented durability features. The review highlights how TORRAS addresses these priorities through multiple stand configurations and case designs.
TORRAS Ostand Series Combines Stand and Magnetic Functionality
The TORRAS Ostand lineup integrates stand mechanisms into magnetic phone cases, reducing the need for separate hands-free viewing accessories. Rather than offering one universal configuration, the Q-series and O-series address different preferences for stand movement, grip, materials, and everyday use.
The TORRAS Q3 Spin features a 360-degree rotating ring stand that folds flat when not in use. The design supports flexible positioning for portrait video calls, landscape streaming, and desk use. For the iPhone 18 Pro version, TORRAS specifies an 18N magnetic holding force for compatible accessories and states that the stand mechanism has been tested through 30,000 rotations.
The TORRAS O3 Fitness offers additional adjustment for users who frequently move between handheld and hands-free activities. Available for iPhone 18 Pro and Pro Max, its aluminum stand provides 360-degree rotation, up to 180-degree tilt, and grip functionality. TORRAS lists 38 N56 magnets arranged in a Halbach array, delivering up to 18N of magnetic force. The design is particularly relevant for workouts, filming, travel, and video calls.
For users prioritizing a softer case feel, the TORRAS Q3 Silicone combines a liquid silicone exterior with a 360-degree rotating stand. Its documented iPhone 18 Pro Max version uses N52 magnets in a Halbach array for compatible magnetic charging and accessories. A microfiber interior and reinforced construction complement the soft-touch finish, supporting comfortable everyday handling.
The TORRAS Q3 Wind takes a related approach to comfort while offering a different stand configuration. Its iPhone 18 Pro Max version features 360-degree rotation and an opening range of up to 180 degrees. The stand can also function as a finger grip. TORRAS specifies N56 magnets in a Halbach array with an 18N magnetic holding force, combining flexible viewing with magnetic accessory support.
The TORRAS Q3 VegSkin emphasizes material finish alongside everyday functionality. Available for iPhone 18 Pro and Pro Max, it features an organic silicone-leather exterior and a 360-degree rotating aluminum stand. Its N56 Halbach magnetic system provides a stated 18N holding force. The combination makes it suitable for meetings, commuting, presentations, and users who prefer a more refined case appearance.
The TORRAS Q3 Air Essential combines rotating stand functionality with textured handling surfaces and Air Pro cushioning. Available in dedicated iPhone 18 Pro and Pro Max versions, it features a 360-degree rotating stand for hands-free viewing and a stated magnetic holding force of up to 18N. Its textured exterior is designed to support grip during everyday use, while cushioning provides an additional protective element.
Together, these models demonstrate how integrated stand cases can accommodate different routines without requiring users to rely on separate stands or grips.
Practical Features for Everyday Phone Use
A magnetic stand case becomes more useful when its design matches the way a phone is used. The TORRAS lineup includes configurations suited to several everyday situations:
Desk work and streaming: Q3 Spin provides a rotating ring stand for changing between portrait and landscape viewing.Fitness and filming: O3 Fitness combines 360-degree rotation, up to 180-degree tilt, and grip functionality for flexible positioning.Comfortable everyday handling: Q3 Silicone and Q3 Wind combine soft-touch finishes with adjustable stand mechanisms.Office use and commuting: Q3 VegSkin offers rotating stand functionality with a leather-inspired exterior.Travel and hands-free viewing: Q3 Air Essential combines a rotating stand with textured grip and cushioning.
Magnetic functionality is another shared consideration. The featured models support compatible MagSafe chargers and accessories, including magnetic mounts and wallets. However, magnet grades, arrangements, and attachment specifications differ between models.
These distinctions allow buyers to consider not only whether a case supports MagSafe accessories, but also how its stand mechanism and exterior design suit everyday habits.
Evaluating Durability, Handling, and Design
Expert Consumers’ evaluation considers the practical trade-offs of integrated stand cases. A built-in stand can reduce the need for additional accessories, but it also introduces a moving component that should be evaluated for convenience, durability, and comfort.
Stand construction varies across the lineup. Q3 Spin uses a rotating ring mechanism, while O3 Fitness offers additional tilt adjustment. Q3 Wind combines rotation with a wider opening range, and Q3 Silicone, Q3 VegSkin, and Q3 Air Essential provide their own approaches to rotating stand functionality.
Material choice also affects handling. The TORRAS magnetic stand case lineup includes soft silicone finishes, leather-inspired textures, and textured cushioning designs intended to address different preferences for grip and everyday carrying.
Manufacturer-stated testing offers additional product context. TORRAS reports 30,000 rotations for the Q3 Spin stand mechanism, although such figures should not be treated as guarantees of performance under every condition.
Protection features should also be considered separately from stand durability. Raised edges, cushioning, and reinforced construction may contribute to a case’s protective design, but the best choice ultimately depends on the intended phone model, handling preferences, and frequency of hands-free use.
A Complementary Screen-Protection Option
TORRAS also offers the SunView AR Ultra Screen Protector for iPhone 18 Pro and Pro Max, as well as iPhone 17 Pro and Pro Max.
The protector incorporates seven anti-reflective layers and two anti-fouling layers. TORRAS specifies film-only reflectance below 0.8%, light transmittance above 95%, and approximately 97% coverage through its 2.5D silk-screened glass.
Designed to reduce distracting reflections and fingerprint oils, the protector offers a complementary option for users who frequently check maps, messages, workout information, or camera previews outdoors.
Choosing a Magnetic Stand Case
Expert Consumers’ recognition of TORRAS highlights the growing importance of integrated stand functionality in everyday phone accessories. Rather than selecting a case solely for its appearance or magnetic attachment, buyers can consider viewing flexibility, stand construction, material feel, charging compatibility, and intended use.
The TORRAS Ostand lineup provides several approaches to these priorities. Q3 Spin emphasizes rotating viewing positions, O3 Fitness adds movement and grip flexibility, Q3 Silicone and Q3 Wind focus on comfortable handling, Q3 VegSkin combines functionality with a refined finish, and Q3 Air Essential balances adjustable viewing with textured grip and cushioning.
For consumers comparing magnetic stand cases for iPhone 18 Pro and iPhone 18 Pro Max, the most suitable option depends on viewing preferences, magnetic accessory compatibility, and everyday handling. Shoppers can explore the TORRAS Magnetic Stand Case to learn more about its integrated stand functionality and magnetic features.
The full review, including detailed product comparisons and buying considerations, is available at the Expert Consumers site.
About TORRAS
TORRAS creates technology accessories that combine protection, thoughtful engineering, and practical everyday function. Across the Q3 Air, Q3 Air Pro, and Ostand product lines, the brand challenges the idea that better protection must mean more bulk, while using Ostand to make hands-free use and spontaneous content capture part of daily life.
About ExpertConsumers.org: Expert Consumers delivers news and insights on consumer products and services. As an affiliate, Expert Consumers may earn commissions from sales generated using links provided.
View original content:https://www.prnewswire.com/news-releases/best-magnetic-stand-cases-for-iphone-18-pro–iphone-18-pro-max-in-2026-torras-recognized-as-a-top-choice-by-expert-consumers-302918040.html
SOURCE ExpertConsumers.org
Technology
2026 China Marine Economy Expo Kicks Off: Embarking Together on a Journey Toward Digital and Smart Ocean
Published
24 minutes agoon
October 24, 2026By

SHENZHEN, China, Oct. 24, 2026 /PRNewswire/ — On October 22, Shenzhen World Exhibition & Convention Center was illuminated in a deep ocean blue as the 2026 China Marine Economy Expo—themed “Digital and Smart Ocean: Co-creating a Sustainable Future”—officially opened. Spanning an exhibition area of 50,000 square meters, the expo hosts over 350 enterprises and is expected to attract 25,000 professional visits. It focuses on core marine sectors and cutting-edge fields, featuring eight exhibition zones including integrated deep-sea and far-sea energy development and application, green shipping and low-carbon logistics, marine electronic information, marine ecology and sustainable development, offshore applications of the low-altitude economy, full-space marine monitoring and disaster early warning, marine biomedicine, and modern marine services and coastal cultural tourism, as well as three specialized exhibition zones dedicated to international participation, industrial clusters, and accelerated technological innovation, which together present the complete ecosystem of marine industries across their entire value chain.
The international zone stands as one of the most prominent core zones. For the first time, China Marine Economy Expo has introduced a Guest Country of Honor mechanism, with France serving as the inaugural honoree. France pavilion offers an immersive experience of its Mission Neptune, and showcases the achievements of Sino-French cooperation in deep-sea research, polar affairs, marine engineering, digital marine technologies, etc. in collaboration with Deep Blue Voyager 2035 global ocean expedition (an international cooperation initiative under UN Ocean Decade spearheaded by China Ocean Mineral Resources R&D Association) and Fujian Ocean Innovation Center.
Hainan, as the inaugural Guest Province of Honor, has brought its leading enterprises to the expo. The enterprises unveil solutions in deep-sea oil and gas, marine renewable energy, deep-sea equipment manufacturing, marine tourism, fisheries, modern marine services, marine biomedicine, subsea embodied-AI robots, large AI models for marine application, quantum-based marine communication and navigation, as well as progress in the development of service and support bases for South China Sea resource exploration, and maritime search and rescue facilities.
Many leading Chinese enterprises, industry front runners and emerging companies are present to demonstrate their capabilities.
Enterprises including China Merchants Group, China Communications Construction Group, China International Marine Containers, and Shenzhen Mawan Smart Port present innovations in smart shipping, offshore engineering and port operations. Tech companies like China Telecom, Huawei, Hikvision and China Unicom introduce cross-industry solutions covering large marine AI models, open sea networked communications, subsea cables and underwater connectors, and digital twin technology for the marine environment.
Underwater robotics section offers a particularly immersive experience. Companies such as CRRC SMD, Boya Gongdao, VVLAI, Sealien Robotics, Seahi, T-SEA Tech, QYSEA Technology, Chasing Innovation, and Wujiang Ocean showcase a diverse range of equipment from consumer-grade robots to 6,000 m industrial-grade submersibles, deep-sea trenching gear, and autonomous underwater exploration and imaging installations. Shenzhen Energy Group highlights a project integrating seawater electrolysis for hydrogen production with offshore wind power generation. SANYA Oceanographic Laboratory presents its Magic Needle large AI model for the South China Sea. ZJU-Hengyi Global Innovation Research Center, Zhejiang University features Haihong II deep-sea unmanned submersible.
There is also a wealth of standout innovations in marine materials and parts. Exhibits such as heavy plates for offshore engineering from Baosteel Zhanjiang Steel, deep-sea robotic arms from KathayBot, deep-sea optoelectronic connectors from Lansuo Technology, pressure resistant spherical hulls from Yancheng Huida Glass Instrument, and solid buoyancy materials from T21 offer visitors a glimpse into the essential materials and parts that underpin China’s major national equipment. Professional service organizations including China Classification Society, China Rescue & Salvage, and Shenzhen Court of International Arbitration provide expertise in areas ranging from testing and certification to emergency response, commercial arbitration, and legal services. Additionally, regional delegations from Guangdong, Hainan, Shanghai, Zhejiang, Shenzhen’s Dapeng and Bao’an districts, Huizhou, and Shantou stage a diverse array of marine projects and technological innovations.
Meanwhile, the 2026 Shenzhen Global Marine Economy Forum, serving as a premier platform for international exchanges within China Marine Economy Expo, took place from October 22 to 23. Nearly 50 high-level representatives and professionals from more than 10 countries and regions engaged in in-depth discussions to advance initiatives related to ecological conservation, the resilience of coastal cities, the value of blue carbon, blue finance, and sustainable urban development.
Industry matchmaking and investment promotion efforts also advance steadily, exemplified by events including International Shipping and Cross-Border Trade Matchmaking, Inaugural Greater Bay Area Blue Ocean Summit on University Sci-Tech Innovation and Capital, investment and financing roadshows by marine SMEs, and Investment Promotion for Shenzhen’s Marine Industries. Notably, the 2026 Investment Promotion for Shenzhen’s Marine Industries—held on October 23 and co-hosted by the Shenzhen Municipal Bureau of Marine Development and the Authority of Qianhai Shenzhen-Hong Kong Modern Service Industry Cooperation Zone, with the support of Bao’an, Longgang and Guangming districts—attracted representatives from around 100 enterprises and organizations specializing in high-end shipping, new energy vessels, deep-sea equipment and other related sectors.
From the technological feast inside exhibition halls to forums covering global ocean governance, blue finance and APEC regional cooperation, and further to city-wide ocean week, yacht shows and public science outreach activities, this edition of China Marine Economy Expo boasts both in-depth professional content for the marine sector and inclusive public experiences with a humanistic touch. It serves not only as a vivid microcosm of the transformation and advancement of China’s marine industries, but also as a vital link for deepening global maritime cooperation and venturing into deep ocean. By gathering guests from all over the world for a journey toward digitally-empowered smart ocean governance, the event ushers in a new chapter of high-quality development in the global marine economy.
View original content to download multimedia:https://www.prnewswire.com/apac/news-releases/2026-china-marine-economy-expo-kicks-off-embarking-together-on-a-journey-toward-digital-and-smart-ocean-302918625.html
SOURCE 2026 China Marine Economy Expo (CMEE)


ASTRI Showcases Pioneering Technologies at InnoCarnival 2026
Best Magnetic Stand Cases for iPhone 18 Pro & iPhone 18 Pro Max in 2026: TORRAS Recognized as a Top Choice by Expert Consumers

2026 China Marine Economy Expo Kicks Off: Embarking Together on a Journey Toward Digital and Smart Ocean

Send Rakhi to UK swiftly with UK Gifts Portal

Whiteboard Series with NEAR | Ep: 45 Joel Thorstensson from ceramic.network

Nullmax and Renesas Forge Strategic Partnership to Deliver Competitive ADAS Solutions for the Global Market

Why You Should Build on #NEAR – Co-founder Illia Polosukhin at CV Labs
Whiteboard Series with NEAR | Ep: 45 Joel Thorstensson from ceramic.network

NEAR End of Year Town Hall 2021: The Open Web World, MetaBUILD 2 Hackathon and 2021 recap
Trending
-

 Technology5 days ago
InstaMall Launches Same-Day Fashion Delivery Experience, Bringing 80+ Brands to Shoppers’ Doors in Miami
-

 Coin Market5 days ago
World Liberty’s USD1 stablecoin sheds $400M in market cap in two weeks
-

 Technology5 days ago
Treasuries Rallied as Tech Slid, and the Crowded Bet Against Bonds Felt It
-
 Technology5 days ago
Enciso Systems Joins SOLAIYA / GARDANT GLOBAL Team to Provide IT Services on NASA SEWP VI Contract
-
 Technology5 days ago
Electives Launches “Electives for Everyone,” Making Live Expert-Led Learning Available to Every Employee
-

 Technology5 days ago
OppFi Announces its Third Quarter 2026 Earnings Conference Call
-

 Technology4 days ago
Sophont Launches Holon-S1 to Reveal Tumor Biology from Routine Pathology Slides
-
 Technology5 days ago
Eqvista Launches Company-Sponsored Tender Offers, Expanding Private Market Liquidity Capabilities