
Technology
Dolby Laboratories Reports Second Quarter 2025 Financial Results

Published
1 year agoon
By

SAN FRANCISCO, May 1, 2025 /PRNewswire/ — Dolby Laboratories, Inc. (NYSE:DLB) today announced the company’s financial results for the second quarter of fiscal 2025.
“We had a strong second quarter with continued momentum across our end markets, especially in Auto and Mobile,” said Kevin Yeaman, President and CEO, Dolby Laboratories. “While there is economic uncertainty, we are well positioned to operate across a range of scenarios. We are in a strong financial position, we continue to see strong engagement from our ecosystem, and we remain focused on driving long-term growth.”
Second Quarter Fiscal 2025 Financial Highlights
Total revenue was $370 million, compared to $365 million for the second quarter of fiscal 2024.GAAP net income was $92 million or $0.94 per diluted share, compared to GAAP net income of $98 million or $1.01 per diluted share for the second quarter of fiscal 2024. On a non-GAAP basis, second quarter net income was $131 million or $1.34 per diluted share, compared to $123 million or $1.27 per diluted share for the second quarter of fiscal 2024.Dolby repurchased approximately 429,000 shares of its common stock for approximately $35 million, and ended the quarter with approximately $352 million of stock repurchase authorization available going forward.
A complete listing of Dolby’s non-GAAP measures are described and reconciled to the corresponding GAAP measures at the end of this release.
Recent Business Highlights
The Super Bowl and March Madness were available in Dolby Atmos and Dolby Vision.In the UK, Sky released the Sky Glass Gen 2 TV that supports Dolby Vision and a Dolby Atmos soundbar built into the TV.LG announced the evo C5 and G5 TVs with Dolby Atmos and Dolby Vision.Waipu.tv, a market leader in IPTV/OTT in Germany, announced support for Dolby Atmos and Dolby Vision.TOD, a leading streaming platform for sports and entertainment in the Middle East and Northern Africa, launched a 4K set-top box supporting Dolby Atmos and Dolby Vision.OPPO launched the Find X8 Ultra, Find X8s, and Find X8s+, all supporting Dolby Vision capture and playback.Sonos, Vizio, and Teufel released soundbars that support Dolby Atmos.Porsche announced that Dolby Atmos will be supported in the Taycan, the Panamera, the Cayenne, and the 911 in the 2026 models.Cadillac announced that its entire EV lineup in 2026 will support Dolby Atmos.Volvo, Xiaomi, and Hyundai recently announced new vehicle models that support our technologies.Dolby Laboratories and AMC Entertainment announced an expansion of their partnership that will add 40 Dolby Cinema screens at select locations nationwide by 2027.
Dividend
Today, Dolby announced a cash dividend of $0.33 per share of Class A and Class B common stock, payable on May 21, 2025, to stockholders of record as of the close of business on May 13, 2025.
Financial Outlook
Dolby’s financial outlook relies, in part, on estimates of royalty-based revenue that take into consideration various factors that are subject to uncertainty, including consumer demand for electronic products. In addition, actual results could differ materially from the estimates Dolby is providing below due in part to uncertainty resulting from the macroeconomic effect of certain conditions, including developments concerning trade restrictions and changes in trade or diplomatic relationships, supply chain constraints, international conflicts, geopolitical instability, and fluctuations in inflation and interest rates. The uncertainty resulting from these factors has greatly reduced visibility into Dolby’s future outlook. To the extent possible, the estimates Dolby is providing for future periods reflect certain assumptions about the potential impact of certain of these items, based upon a consideration of currently available external and internal data and information. These assumptions are subject to risks and uncertainties. For more information, see “Forward-Looking Statements” in this press release for a description of certain risks that Dolby faces, and the section captioned “Risk Factors” in its Quarterly Report on Form 10-Q for the second quarter of fiscal 2025, to be filed on or around the date hereof.
Dolby is providing the following estimates for its third quarter of fiscal 2025:
Total revenue is estimated to range from $290 million to $320 million.Licensing revenue is estimated to range from $265 million to $295 million.Gross margins are anticipated to be approximately 86% on a GAAP basis and approximately 88% on a non-GAAP basis.Operating expenses are anticipated to range from $225 million to $235 million on a GAAP basis and from $190 million to $200 million on a non-GAAP basis.Effective tax rate is anticipated to be around 23% on a GAAP basis and around 20.5% on a non-GAAP basis.Diluted earnings per share is anticipated to range from $0.26 to $0.41 on a GAAP basis and from $0.62 to $0.77 on a non-GAAP basis.
Dolby is providing the following estimates for the full year of fiscal 2025:
Total revenue is expected to range from $1.31 billion to $1.38 billion.Licensing revenue is estimated to range from $1.21 billion to $1.28 billion.Gross margins are anticipated to be approximately 87% on a GAAP basis and approximately 90% on a non-GAAP basis.Operating expenses are anticipated to range from $905 million to $920 million on a GAAP basis and from $760 million to $775 million on a non-GAAP basis.Dolby expects operating margins to be roughly 20% on a GAAP basis and to be roughly 33% on a non-GAAP basis.Effective tax rate is anticipated to be around 22.5% on a GAAP basis and around 20.0% on a non-GAAP basis.Diluted earnings per share is anticipated to range from $2.31 to $2.46 on a GAAP basis and from $3.88 to $4.03 on a non-GAAP basis.
Conference Call Information
Members of Dolby management will lead a conference call open to all interested parties to discuss second quarter fiscal 2025 financial results for Dolby Laboratories at 2:00 p.m. PT (5:00 p.m. ET) on Thursday, May 1, 2025. Access to the teleconference will be available at http://investor.dolby.com or by dialing 1-888-210-2212 (+1-646-960-0390 for international callers) and entering confirmation code 5587811.
A replay of the call will be available from 5:00 p.m. PT (8:00 p.m. ET) on Thursday, May 1, 2025, until 8:59 p.m. PT (11:59 p.m. ET) on Thursday, May 8, 2025 by dialing 1-800-770-2030 (+1-647-362-9199 for international callers) and entering the confirmation code 5587811. An archived version of the teleconference will also be available on the Dolby website, http://investor.dolby.com.
Non-GAAP Financial Information
To supplement Dolby’s financial statements presented on a GAAP basis, Dolby management uses, and Dolby provides to investors, certain non-GAAP financial measures as an additional tool to evaluate Dolby’s operating results in a manner that focuses on what Dolby’s management believes to be its ongoing business operations and performance. We believe these non-GAAP financial measures are also helpful to investors in enabling comparability of operating performance between periods and among peer companies. Additionally, Dolby’s management regularly uses our supplemental non-GAAP financial measures to make operating decisions, for planning and forecasting purposes and determining bonus payouts. Specifically, Dolby excludes the following as adjustments from one or more of its non-GAAP financial measures:
Stock-based compensation expense: Stock-based compensation, unlike cash-based compensation, utilizes subjective assumptions in the methodologies used to value the various stock-based award types that Dolby grants. These assumptions may differ from those used by other companies. To facilitate more meaningful comparisons between its underlying operating results and those of other companies, Dolby excludes stock-based compensation expense.
Amortization of acquisition-related intangibles: Dolby amortizes intangible assets acquired in connection with business combinations. These intangible assets consist of patents and technology, customer relationships, and other intangibles. Dolby records amortization charges relating to these intangible assets in its GAAP financial statements, and Dolby views these charges as items arising from pre-acquisition activities that are determined by the timing and valuation of its acquisitions. As these amortization charges do not directly correlate to its operations during any particular period, Dolby excludes these charges to facilitate an evaluation of its current operating performance and comparisons to its past operating results. In addition, while amortization expense of acquisition-related intangible assets is excluded from Non-GAAP Net Income, the revenue generated from those assets is not excluded.
Restructuring charges or credits: Restructuring charges are costs associated with restructuring plans and primarily relate to costs associated with exit or disposal activities, employee severance benefits, and asset impairments. Dolby excludes restructuring costs, including any adjustments to charges recorded in prior periods (which may be credits), as Dolby believes that these costs are not representative of its normal operating activities and therefore, excluding these amounts enables a more effective comparison of its past operating performance and to that of other companies.
Income tax adjustments: The income tax effects of the aforementioned non-GAAP adjustments do not directly correlate to its operating performance so Dolby believes that excluding such income tax effects provides a more meaningful view of its underlying operating results to management and investors.
Using the aforementioned adjustments, Dolby provides various non-GAAP financial measures including, but not limited to: non-GAAP net income, non-GAAP diluted earnings per share, non-GAAP gross margin, non-GAAP operating expenses, non-GAAP operating margin, and non-GAAP effective tax rate. Dolby’s management believes it is useful for itself and investors to review both GAAP and non-GAAP measures to assess the performance of Dolby’s business, including as a means to evaluate period-to-period comparisons. Dolby’s management does not itself, nor does it suggest that investors should, consider non-GAAP financial measures in isolation from, superior to, or as a substitute for, financial information prepared in accordance with GAAP. Whenever Dolby uses non-GAAP financial measures, it provides a reconciliation of the non-GAAP financial measures to the most closely applicable GAAP financial measures. Investors are encouraged to review the related GAAP financial measures and the reconciliation of these non-GAAP financial measures to their most directly comparable GAAP financial measures as detailed above and below. Investors are also encouraged to review Dolby’s GAAP financial statements as reported in its US Securities and Exchange Commission (SEC) filings. A reconciliation between GAAP and non-GAAP financial measures is provided at the end of this press release and on the Dolby investor relations website, http://investor.dolby.com.
Forward-Looking Statements
Certain statements in this press release and in our earnings calls, including, but not limited to, expected financial results for the third quarter of fiscal 2025 and full year fiscal 2025, Dolby’s ability to expand existing business, navigate challenging periods, pursue its long-term growth opportunities, and advance its other long-term objectives are “forward-looking statements” that inherently involve substantial risks and uncertainties. These forward-looking statements are based on management’s current expectations, and as a result of certain risks and uncertainties, actual results may differ materially from those provided. The following important factors, without limitation, could cause actual results to differ materially from those in the forward-looking statements: the potential impacts of economic conditions on Dolby’s business operations, financial results, and financial position (including the impact to Dolby partners and disruption of the supply chain and delays in shipments of consumer products; the level at which Dolby technologies are incorporated into products and the consumer demand for such products; delays in the development and release of new products or services that contain Dolby technologies; delays in royalty reporting or delinquent payment by partners or licensees; lengthening sales cycles; the impact to the overall cinema market including adverse impact to Dolby’s revenue recognized on box-office sales and demand for cinema products and services; and macroeconomic conditions that affect discretionary spending and access to products that contain Dolby technologies); risks associated with geopolitical issues and international conflicts; risks associated with trends in the markets in which Dolby operates, including the broadcast, mobile, consumer electronics, PC, and other markets; the loss of, or reduction in sales by, a key customer, partner, or licensee; pricing pressures; risks relating to changing trends in the way that content is distributed and consumed; risks relating to conducting business internationally, including trade restrictions and changes in diplomatic or trade relationships; risks relating to maintaining patent coverage; the timing of Dolby’s receipt of royalty reports and payments from its licensees, including recoveries; changes in tax regulations; timing of revenue recognition under licensing agreements and other contractual arrangements; Dolby’s ability to develop, maintain, and strengthen relationships with industry participants; Dolby’s ability to develop and deliver innovative products and technologies in response to new and growing markets; competitive risks; risks associated with conducting business in countries that have historically limited recognition and enforcement of intellectual property and contractual rights; risks associated with the health of the motion picture and cinema industries generally; Dolby’s ability to increase its revenue streams and to expand its business generally, and to continue to expand its business beyond its current technology offerings; risks associated with acquiring and successfully integrating businesses or technologies; and other risks detailed in Dolby’s SEC filings and reports, including the risks identified under the section captioned “Risk Factors” in its Quarterly Report on Form 10-Q filed on or around the date hereof. Dolby may not actually achieve the plans, intentions, or expectations disclosed in its forward-looking statements. Forward-looking statements are based upon information available to us as of the date of such statements, and while Dolby believes such information forms a reasonable basis for such statements, such information may be limited or incomplete. These statements are inherently uncertain and investors are cautioned not to unduly rely upon these statements. Except as required by law, Dolby disclaims any obligation to update information contained in these forward-looking statements whether as a result of new information, future events, or otherwise.
About Dolby Laboratories
Dolby Laboratories (NYSE: DLB) is based in San Francisco, California with offices around the globe. From movies and TV shows, to apps, music, sports and gaming, Dolby transforms the science of sight and sound into spectacular experiences for billions of people worldwide. Dolby partners with artists, storytellers, developers, and businesses to revolutionize entertainment and communications with Dolby Atmos, Dolby Vision, Dolby Cinema, and Dolby OptiView.
Dolby, Dolby Atmos, Dolby Vision, Dolby Cinema, Dolby OptiView, and the double-D symbol are among the registered and unregistered trademarks of Dolby Laboratories in the United States and/or other countries. Other trademarks remain the property of their respective owners.
DOLBY LABORATORIES, INC.
INTERIM CONDENSED CONSOLIDATED STATEMENTS OF OPERATIONS
(in thousands, except per share amounts; unaudited)
Fiscal Quarter Ended
Fiscal Year-To-Date Ended
March 28,
2025
March 29,
2024
March 28,
2025
March 29,
2024
Revenue:
Licensing
$ 346,006
$ 338,240
$ 676,485
$ 632,007
Products and services
23,555
26,283
50,075
48,090
Total revenue
369,561
364,523
726,560
680,097
Cost of revenue:
Cost of licensing
19,685
15,318
40,795
31,054
Cost of products and services
16,152
23,459
35,816
39,783
Total cost of revenue
35,837
38,777
76,611
70,837
Gross profit
333,724
325,746
649,949
609,260
Operating expenses:
Research and development
61,707
62,493
128,345
129,526
Sales and marketing
89,629
90,038
184,028
169,041
General and administrative
70,415
66,742
140,507
131,908
Restructuring charges/(credits)
4,210
(2,495)
9,426
3,596
Total operating expenses
225,961
216,778
462,306
434,071
Operating income
107,763
108,968
187,643
175,189
Other income/(expense):
Interest income/(expense), net
3,559
8,597
6,205
17,784
Other income, net
8,928
4,183
12,453
9,608
Total other income
12,487
12,780
18,658
27,392
Income before income taxes
120,250
121,748
206,301
202,581
Provision for income taxes
(28,024)
(23,534)
(46,005)
(36,786)
Net income including noncontrolling interest
92,226
98,214
160,296
165,795
Less: net income attributable to noncontrolling interest
(433)
(384)
(681)
(984)
Net income attributable to Dolby Laboratories, Inc.
$ 91,793
$ 97,830
$ 159,615
$ 164,811
Net income per share:
Basic
$ 0.95
$ 1.02
$ 1.66
$ 1.72
Diluted
$ 0.94
$ 1.01
$ 1.64
$ 1.69
Weighted-average shares outstanding:
Basic
96,329
95,718
95,972
95,547
Diluted
97,471
96,856
97,581
97,397
DOLBY LABORATORIES, INC.
INTERIM CONDENSED CONSOLIDATED BALANCE SHEETS
(in thousands; unaudited)
March 28,
2025
September 27,
2024
ASSETS
Current assets:
Cash and cash equivalents
$ 626,551
$ 482,047
Restricted cash
123,791
95,705
Accounts receivable, net
314,114
315,465
Contract assets, net
230,352
197,478
Inventories, net
34,594
33,728
Prepaid expenses and other current assets
59,878
69,994
Total current assets
1,389,280
1,194,417
Long-term investments
73,757
89,267
Property, plant, and equipment, net
472,663
479,109
Operating lease right-of-use assets
34,086
39,046
Goodwill and intangible assets, net
937,083
967,722
Deferred taxes
223,410
219,758
Other non-current assets
98,757
120,609
Total assets
$ 3,229,036
$ 3,109,928
LIABILITIES AND STOCKHOLDERS’ EQUITY
Current liabilities:
Accounts payable
$ 17,288
$ 17,380
Accrued liabilities
376,498
347,529
Income taxes payable
13,309
9,045
Contract liabilities
39,615
31,644
Operating lease liabilities
10,775
12,238
Total current liabilities
457,485
417,836
Non-current contract liabilities
29,664
34,593
Non-current operating lease liabilities
29,656
34,754
Other non-current liabilities
129,212
135,852
Total liabilities
646,017
623,035
Stockholders’ equity:
Class A common stock
55
53
Class B common stock
40
41
Retained earnings
2,601,552
2,496,255
Accumulated other comprehensive loss
(27,978)
(19,187)
Total stockholders’ equity – Dolby Laboratories, Inc.
2,573,669
2,477,162
Noncontrolling interest
9,350
9,731
Total stockholders’ equity
2,583,019
2,486,893
Total liabilities and stockholders’ equity
$ 3,229,036
$ 3,109,928
DOLBY LABORATORIES, INC.
INTERIM CONDENSED CONSOLIDATED STATEMENTS OF CASH FLOWS
(in thousands; unaudited)
Fiscal Year-To-Date Ended
March 28,
2025
March 29,
2024
Operating activities:
Net income including noncontrolling interest
$ 160,296
$ 165,795
Adjustments to reconcile net income to net cash provided by operating activities:
Depreciation and amortization
43,899
35,890
Stock-based compensation
66,734
60,809
Amortization of operating lease right-of-use assets
5,725
5,847
Amortization of premium on investments
—
(1,757)
Provision for/(benefit from) credit losses
1,967
(1,454)
Deferred income taxes
(3,741)
(6,779)
Other non-cash items affecting net income
(13,844)
(2,500)
Changes in operating assets and liabilities:
Accounts receivable, net
(420)
(18,509)
Contract assets, net
(32,864)
(61,008)
Inventories
(1,155)
(7,836)
Operating lease right-of-use assets
(1,608)
(7,848)
Prepaid expenses and other assets
38,653
33,527
Accounts payable and accrued liabilities
27,267
3,923
Income taxes, net
5,906
5,215
Contract liabilities
3,282
2,651
Operating lease liabilities
(5,682)
1,028
Other non-current liabilities
(12,739)
(17,176)
Net cash provided by operating activities
281,676
189,818
Investing activities:
Purchases of marketable securities
—
(104,135)
Proceeds from sales of marketable securities
15,911
4,451
Proceeds from maturities of marketable securities
—
97,459
Proceeds from sale of assets held for sale
16,881
—
Purchases of property, plant, and equipment
(13,676)
(15,015)
Business combinations, net of cash and restricted cash acquired, and other related payments
(1,362)
—
Net cash provided by/(used in) investing activities
17,754
(17,240)
Financing activities:
Proceeds from issuance of common stock
26,124
29,345
Repurchase of common stock
(49,999)
(104,999)
Payment of excise tax on repurchase of common stock
(261)
—
Payment of cash dividend
(63,377)
(57,268)
Distributions to noncontrolling interest
(981)
(1,047)
Shares repurchased for tax withholdings on vesting of restricted stock
(33,950)
(36,054)
Equity issued in connection with business combination
—
722
Net cash used in financing activities
(122,444)
(169,301)
Effect of foreign exchange rate changes on cash, cash equivalents, and restricted cash
(4,396)
3,113
Net increase in cash, cash equivalents, and restricted cash
172,590
6,390
Cash, cash equivalents, and restricted cash at beginning of period
577,752
817,966
Cash, cash equivalents, and restricted cash at end of period
$ 750,342
$ 824,356
Licensing Revenue by Market
(unaudited)
The following table presents the composition of our licensing revenue and percentage of total licensing revenue for all periods presented (in thousands, except percentage amounts):
Fiscal Quarter Ended
Fiscal Year-To-Date Ended
Market
March 28, 2025
March 29, 2024
March 28, 2025
March 29, 2024
Broadcast
$ 94,249
27 %
$ 105,480
31 %
$ 210,011
31 %
$ 217,896
34 %
Mobile
100,123
29 %
88,690
26 %
161,647
24 %
123,977
20 %
CE
38,140
11 %
42,221
12 %
87,597
13 %
95,441
15 %
PC
58,402
17 %
49,938
15 %
89,658
13 %
79,617
13 %
Other
55,092
16 %
51,911
16 %
127,572
19 %
115,076
18 %
Total licensing revenue
$ 346,006
100 %
$ 338,240
100 %
$ 676,485
100 %
$ 632,007
100 %
GAAP to Non-GAAP Reconciliations
(unaudited)
The following tables present Dolby’s GAAP financial measures reconciled to the non-GAAP financial measures included in this release for the second quarters of fiscal 2025 and fiscal 2024:
Net income:
Fiscal Quarter Ended
(in thousands)
March 28,
2025
March 29,
2024
GAAP net income attributable to Dolby Laboratories, Inc.
$ 91,793
$ 97,830
Stock-based compensation (1)
30,664
28,915
Amortization of acquisition-related intangibles (2)
10,078
3,031
Restructuring charges/(credits)
4,210
(2,495)
Income tax adjustments
(6,017)
(4,091)
Non-GAAP net income attributable to Dolby Laboratories, Inc.
$ 130,728
$ 123,190
(1) Stock-based compensation included in above line items:
Cost of products and services
$ 414
$ 356
Research and development
9,043
8,949
Sales and marketing
10,640
9,927
General and administrative
10,567
9,683
(2) Amortization of acquisition-related intangibles included in above line items:
Cost of licensing
$ 6,720
$ (15)
Cost of products and services
728
524
Sales and marketing
317
650
General and administrative
1,872
1,872
Other income, net
441
—
Diluted earnings per share:
Fiscal Quarter Ended
March 28,
2025
March 29,
2024
GAAP diluted earnings per share
$ 0.94
$ 1.01
Stock-based compensation
0.32
0.30
Amortization of acquisition-related intangibles
0.10
0.03
Restructuring charges
0.04
(0.03)
Income tax adjustments
(0.06)
(0.04)
Non-GAAP diluted earnings per share
$ 1.34
$ 1.27
Weighted-average shares outstanding – diluted (in thousands)
97,471
96,856
The following tables present a reconciliation between GAAP and non-GAAP versions of the estimated financial measures for the third quarter of fiscal 2025 and full year fiscal 2025 included in this release:
Gross margin:
Q3 2025
Fiscal 2025
GAAP gross margin
86.0 %
87.0 %
Stock-based compensation
0.1 %
0.1 %
Amortization of acquisition-related intangibles
1.9 %
2.9 %
Non-GAAP gross margin
88.0 %
90.0 %
Operating expenses (in millions):
Q3 2025
Fiscal 2025
GAAP operating expenses (low – high end of range)
$225 – $235
$905 – $920
Stock-based compensation
(32)
(127)
Amortization of acquisition-related intangibles
(3)
(9)
Restructuring charges
—
(9)
Non-GAAP operating expenses (low – high end of range)
$190 – $200
$760 – $775
Operating margin:
Fiscal 2025
GAAP operating margin
20% +/-
Stock-based compensation
9 %
Amortization of acquisition-related intangibles
3 %
Restructuring charges
1 %
Non-GAAP operating margin
33% +/-
Effective tax rate:
Q3 2025
Fiscal 2025
GAAP effective tax rate
23.0 %
22.5 %
Stock-based compensation (low – high end of range)
(2%) – 0%
(2%) – 0%
Amortization of acquisition-related intangibles (low – high end of range)
(1%) – 0%
(1%) – 0%
Non-GAAP effective tax rate
20.5 %
20.0 %
Diluted earnings per share:
Q3 2025
Fiscal 2025
Low
High
Low
High
GAAP diluted earnings per share (low – high end of range)
$ 0.26
$ 0.41
$ 2.31
$ 2.46
Stock-based compensation
0.33
0.33
1.34
1.34
Amortization of acquisition-related intangibles
0.11
0.11
0.42
0.42
Restructuring charges
—
—
0.10
0.10
Income tax adjustments
(0.08)
(0.08)
(0.29)
(0.29)
Non-GAAP diluted earnings per share (low – high end of range)
$ 0.62
$ 0.77
$ 3.88
$ 4.03
Weighted-average shares outstanding – diluted (in thousands)
96,900
96,900
97,200
97,200
Investor Contact:
Peter Goldmacher
415-254-7415
peter.goldmacher@dolby.com
Media Contact:
media@dolby.com
View original content to download multimedia:https://www.prnewswire.com/news-releases/dolby-laboratories-reports-second-quarter-2025-financial-results-302444258.html
SOURCE Dolby Laboratories, Inc.

You may like
Technology
Goodwill Houston and CompuCycle Launch Tech Recycle Workforce Training Program for Students with Disabilities
Published
17 minutes agoon
October 20, 2026By

HOUSTON, Oct. 20, 2026 /PRNewswire/ — Goodwill Houston and CompuCycle today announced Tech Recycle, a workforce training program that turns school districts’ retired electronics into paid vocational training for transition-age students with disabilities. Goodwill Houston operates the program and pays every student. CompuCycle, a Houston-based electronics recycler, provides certified data destruction and recycling for the districts’ devices.
Tech Recycle is a 12-week paid work-based learning program that helps students on the autism spectrum build skills and prepare for future employment, at no cost to them.
How Does Tech Recycle Work?
Districts send retired electronics to CompuCycle for certified data destruction and receive audit-ready documentation before sending the wiped devices to Goodwill Houston to be used in instruction.Students join a 12-week paid work-based learning program run by Goodwill Houston, gaining hands-on experience and skills that can support future employment.Goodwill Houston funds student paychecks in full, separate from the value returned to districts.CompuCycle recycles the scrap materials in-house at its 130,000 sq ft Houston facility and returns recovered material value to the districts.
From One Classroom to a Regional Workforce Program
Tech Recycle grew out of TechCycle, a program CompuCycle launched with Pearland ISD, supported by seed funding from Texas A&M and covered by ABC13. Goodwill Houston now runs it as Tech Recycle.
“Goodwill Houston saw what it could be across the region and built the training around it. Our job is to keep the recycling secure, certified, and done right here in Houston,” said Kelly Adels Hess, CEO of CompuCycle.
Building a Pathway to Success for Students with Autism
“We have run into so many students who have a passion for telling you how things work and taking them apart. But we did not have a pathway set aside for them. The greatest part about this program is we’re paying these students. They now have certified training and a resume builder,” said Vernee Sampson, Senior Manager of Vocational Rehabilitation Programs at Goodwill Houston.
“Most arrive assuming that they can’t do this or this isn’t for them, but we want them to walk away believing that they can do it,” said Alicia Franklin, Career Coach and instructor for Tech Recycle.
How Can Districts and Organizations Get Involved?
School districts that want to train their students through Tech Recycle can contact Goodwill Houston. Organizations with retired electronics can send them through CompuCycle. Learn more about the CompuCycle and Goodwill Houston partnership.
“Community impact is the point of Tech Recycle. A district retires its devices, we recycle them securely, and Goodwill Houston turns that into paid training for students. When a recycler, a nonprofit, and a school district work together, the whole community benefits,” Hess said.
Join the Conversation at E-Scrap
Kelly Adels Hess will lead a workshop, “Community Partnerships, Real Impact,” at the E-Scrap Conference in New Orleans on October 27 from 8:30 to 9:30 a.m.
About Goodwill Houston
Goodwill Houston is a nonprofit organization dedicated to changing lives through the power of work. Serving individuals and families across the Greater Houston area, Goodwill Houston provides workforce development, job training, career services and other programs designed to help people build skills, overcome barriers to employment and achieve greater independence.
About CompuCycle
CompuCycle is a Houston-based IT asset disposition and electronics recycling company. It holds R2v3, e-Stewards, and ISO 27001 certifications, the only electronics recycler in Texas with all three.
Media Contacts
CompuCycle: Kelly Adels Hess, CEO, khess@compucycle.com, 713-869-6700Goodwill Houston: Mia Brooks, Events and Public Relations Coordinator, MBrooks@goodwillhouston.org, 713-805-7031
View original content to download multimedia:https://www.prnewswire.com/news-releases/goodwill-houston-and-compucycle-launch-tech-recycle-workforce-training-program-for-students-with-disabilities-302912262.html
SOURCE CompuCycle
Technology
xTool Launches C1 Color Cutter : The Full-Color Cutting Machine Built to Scan, Print, and Cut with Precision
Published
17 minutes agoon
October 20, 2026By
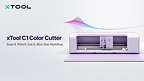
PARIS, Oct. 20, 2026 /PRNewswire/ — xTool, a global pioneer in digital fabrication and smart desktop manufacturing, announces today its expansion into the craft cutter market with the launch of the xTool C1 Color Cutter.
Engineered under the slogan “Scan It. Print It. Cut It. Always in One Workflow,” the C1 solves long-standing industry challenges by integrating high-precision CIS scanning, CMYK full-color inkjet printing, and dynamic blade cutting into a single automated desktop workstation.
Starting October 20th, 2026, xTool is launching its official global pre-order campaign, offering an exclusive £10 deposit incentive that provides early buyers with substantial machine discounts, physical material bundles, and livestream giveaway entries.
Beyond Lasers and Printers : The Natural Evolution into Craft Cutting
The launch of the xTool C1 marks a milestone in xTool’s strategy to build a fully integrated hardware and software ecosystem for creators, DIY enthusiasts, and small-business owners. Building on its global leadership in desktop laser engravers and digital printers, xTool is bringing its expertise in precision mechanics and automation to traditional blade cutting.
By combining full-color printing and precision cutting in one compact machine, the C1 eliminates the need for separate printers, manual material transfers, and error-prone registration marks, simplifying workflows for paper crafts, vinyl graphics, HTV, apparel, and stickers.
Designed for Advanced Crafters and Small Businesses
For DIY enthusiasts, its integrated print-and-cut workflow helps reduce material waste, alignment errors, and the need to cut and weed multiple layers of vinyl. Complex projects involving heat transfer vinyl (HTV) for textile customisation, sticker making, and paper crafts become easier to complete.
For entrepreneurs and small businesses producing customised apparel, labels, packaging, or promotional items, the C1 is a valuable addition to their production workflow. It helps improve productivity, reduce manufacturing costs, and deliver professional-quality results.
Seamless Print-and-Cut Workflow
Combining CMYK inkjet printing with precision blade cutting, the C1 prints directly onto materials before cutting, eliminating registration marks, maximizing printable space, and minimizing alignment errors and waste. Its proprietary Duraproof ink produces vibrant, waterproof, fade-resistant graphics that can withstand up to 30 home washes on textiles.
Built-In CIS Scanner and Live Preview
An integrated Contact Image Sensor (CIS) provides a 1:1 live preview, allowing users to position designs accurately, including leftover materials. Additional features include automatic contour extraction, material nesting, and QR-code-based parameter setup.
AI-Powered Atomm Creation Suite
xTool’s Atomm software transforms text prompts and images into ready-to-cut vectors, with tools for background removal, artistic text, line-art conversion, and 3D papercraft templates, reducing design preparation from hours to minutes.
Versatile Materials and Tools
Compatible with Fine-Point, Deep-Point, Rotary, and 3mm Cutting blades, Foil-Transfer tips, and detail pens, the C1 supports paper, cardstock, vinyl, HTV, leather, balsa wood, and fabrics. Optional accessories include an Electrostatic Mat and Roll Holder with built-in trimmer.
Pre-Order Details
Global pre-orders open on October 20th, 2026, with prices starting at £399 and reservations available for a £10 deposit. Several bundles will be offered, including the first-ever C1 bundle with Atomm Membership.
Pre-order customers will receive exclusive £10 Pre-Order Bonus Perks, including a material kit with over 10 crafting materials, a 20% Material Card valid for 180 days across the xTool store, and entry into a livestream giveaway to win a free C1.
Final payments and global shipping begin November 5, 2026. Further details are available at xtool.com.
About xTool
xTool is a brand founded in 2020 that specialises in smart digital fabrication machines. The company’s mission is to foster creativity by developing intelligent, user-friendly tools that leverage advanced technologies to significantly lower the barriers to creation.
The brand primarily serves makers, DIY enthusiasts, and the education sector by combining powerful software with safe, easy-to-use hardware. xTool provides users with new opportunities to bring their creative ideas to life efficiently and professionally.
For more information: xtool.com
View original content to download multimedia:https://www.prnewswire.co.uk/news-releases/xtool-launches-c1-color-cutter–the-full-color-cutting-machine-built-to-scan-print-and-cut-with-precision-302914186.html
Technology
Green Data Center Market worth $197.02 billion by 2031 – Report by MarketsandMarkets™
Published
17 minutes agoon
October 20, 2026By

DELRAY BEACH, Fla., Oct. 20, 2026 /PRNewswire/ — According to MarketsandMarkets™, the global Green Data Center Market is expanding rapidly, with a projected market size anticipated to rise from about USD 60.77 billion in 2026 to USD 197.02 billion by 2031, featuring a CAGR of 26.5%.
Browse 303 market data Tables and 60 Figures spread through 240 Pages and in-depth TOC on “Green Data Center Market – Global Forecast to 2031”
Green Data Center Market Size & Forecast:
Market Size Available for Years: 2021–20312025 Market Size: USD 48.26 billion2026 Market Size: USD 60.77 billion2031 Projected Market Size: USD 197.02 billionCAGR (2026–2031): 26.5%
Green Data Center Market Trends & Insights:
The global market is gaining momentum as data center operators and enterprises respond to rising energy costs, increasingly stringent sustainability regulations, and growing commitments to reduce carbon emissions.The infrastructure segment is expected to hold the largest market value of USD 39.31 billion by 2026.The building management software is projected to grow at the highest CAGR of 32.1% during the forecast period.Cloud and hyperscale data centers are expected to dominate the market during the forecast period.Retail and e-commerce enterprises are projected to grow at the highest CAGR during the forecast period.North America is estimated to dominate the market with the highest value of USD 25.12 billion by 2026.
Download PDF Brochure: https://www.marketsandmarkets.com/pdfdownloadNew.asp?id=1032
Green data centers are transforming digital infrastructure by integrating technologies such as renewable energy systems, liquid and immersion cooling, and intelligent energy management solutions to enable sustainability at scale. These innovations improve power usage efficiency, reduce carbon emissions, and support compliance with increasingly stringent global sustainability regulations, accelerating adoption across hyperscale facilities, colocation providers, and enterprise data centers. By incorporating energy-efficient and environmentally optimized technologies into core operations, green data centers enhance long-term resilience, regulatory alignment, and cost efficiency for energy-intensive workloads. This infrastructure enables organizations to support AI-driven applications, cloud services, and high-density computing environments more efficiently, while reducing reliance on fossil fuel-based power systems and minimizing overall environmental impact.
By Cooling Infrastructure, Green Air Cooling will register the largest market share during the forecast period
Green air cooling is expected to remain a key thermal management solution in data centers, driven by the growing emphasis on energy efficiency, sustainability, and reduced environmental impact. Key components include Computer Room Air Handlers (CRAH) and Computer Room Air Conditioning (CRAC) units, which use chilled water and refrigerant-based systems, respectively, to maintain optimal temperature and humidity conditions. These systems are increasingly equipped with variable-speed fans, advanced controls, and high-efficiency motors to reduce energy consumption and improve overall cooling performance. Energy-efficient air-cooled chillers further complement these systems by using low Global Warming Potential (GWP) refrigerants and incorporating free-cooling modes that leverage ambient outdoor air to reduce cooling energy requirements. Additional approaches, including hot/cold aisle containment, variable airflow management, and intelligent monitoring systems, enable cooling capacity to be dynamically adjusted according to real-time demand, improving energy efficiency. Emerging vendors and solution providers can capitalize on this trend by developing advanced thermal management technologies. Carrier’s investment in ZutaCore, announced in February 2025, highlights the industry’s increasing focus on advanced cooling solutions. The collaboration aims to deliver scalable and energy-efficient thermal management systems capable of addressing the rising cooling requirements of modern data centers. To capture these opportunities, vendors can focus on developing innovative cooling technologies that improve efficiency and support sustainability objectives. Strategic collaborations, industry partnerships, and continuous technological innovation will remain important for strengthening capabilities in the evolving green data center cooling market.
Request for Proposal: https://www.marketsandmarkets.com/requestsampleNew.asp?id=1032
Software segment is poised for the fastest growth rate during the forecast period
The software segment is expected to register the highest CAGR in the Green Data Center Market, driven by growing demand for intelligent automation, energy optimization, operational visibility, and regulatory compliance. Data Center Infrastructure Management (DCIM) software provides real-time visibility into power consumption, cooling performance, server utilization, and environmental conditions, enabling operators to identify inefficiencies, optimize resource allocation, and maintain high availability. Building Management Systems (BMS) integrate electrical, mechanical, and HVAC systems to automate energy-efficient facility operations while regulating lighting, temperature, and airflow to minimize energy waste and improve cooling efficiency. Compliance software supports adherence to environmental standards, industry regulations, and sustainability certifications such as LEED and ISO 50001 by automating reporting, documentation, and audit processes, thereby improving transparency and accountability. Specialized software solutions, including AI-driven predictive workload management and energy analytics platforms, can dynamically optimize cooling, power distribution, and IT workloads based on real-time demand, reducing energy consumption, environmental impact, and operating costs. Emerging vendors and solution providers can capitalize on this growth through strategic partnerships, technology integration, and AI-enabled capabilities. For instance, in August 2025, Vertiv acquired Waylay NV, a Belgium-based AI-powered software provider, to strengthen monitoring, optimization, and operational efficiency across data center systems. By developing advanced software solutions, collaborating with established technology providers, and leveraging AI, automation, and analytics, vendors can support sustainable, efficient, and regulatory-compliant green data center operations while addressing the growing demand for intelligent infrastructure management.
North America accounts for the largest market during the forecast period
North America is witnessing measurable growth in green data center activity, driven by corporate decarbonization targets, rising onsite power costs, and the increasing need to deploy high-density computing infrastructure with lower water and energy intensity. According to the US Energy Information Administration, solar power generation in the United States increased by 25% in 2024, while wind power generation grew by 8%, improving the availability of low-carbon electricity for hyperscale and colocation data center campuses. Additionally, Schneider Electric announced collaborative AI data center reference designs with NVIDIA in December 2024 that support liquid cooling at densities of up to 132 kilowatts per rack, highlighting supplier responses to rising rack power densities and efficiency requirements. Federal and commercial developments during 2024 and 2025 are also influencing procurement timelines and technical specifications. The White House issued an executive order in July 2025 aimed at accelerating federal permitting for large data center projects and supporting infrastructure. By streamlining approvals for facilities exceeding 100 megawatts or involving capital expenditures of at least USD 500 million, the order supports faster deployment of next-generation data centers, enabling integration of renewable power, liquid cooling systems, and energy-efficient designs. Schneider Electric also introduced and validated new electrical and liquid cooling reference designs through 2024 and 2025, creating standardized deployment pathways for integrators and data center owners. Vendors and solution providers are increasingly focusing on liquid cooling systems, modular electrical skids, facility-level heat recovery, and advanced DCIM capabilities to address evolving procurement requirements amid faster permitting processes and increasing renewable power availability.
Request Pricing: https://www.marketsandmarkets.com/Enquiry_Before_BuyingNew.asp?id=1032
Top Companies in Green Data Center Market:
The Top Companies in Green Data Center Market are Schneider Electric (France), Vertiv (US), Eaton (US), Daikin (Japan), ABB (Switzerland), Delta Electronics (Taiwan), Siemens (Germany), Carrier (US), and GE Vernova (US).
Green Data Center Market – Investment & funding +Merger & Acquisition
Investment and Funding Context
The global Green Data Center Market is attracting strong investment from hyperscalers, cloud providers, colocation operators, and enterprises seeking sustainable ways to expand capacity for AI, high-performance computing, and edge workloads. Investment is increasingly directed toward energy-efficient power and cooling systems, eco-friendly IT modules, high-density green AI pods, and sustainable manufacturing capacity.
Capital is also flowing toward companies developing technologies that address the power, cooling, and energy-efficiency requirements of sustainable AI infrastructure. For example, Eaton completed its USD 9.5 billion acquisition of Boyd Thermal in March 2026, adding liquid cooling and thermal management capabilities for high-density, energy-efficient data centers. Similarly, Vertiv agreed in September 2026 to acquire UtilityInnovation Group for approximately USD 1.45 billion to add microgrid controls, on-site generation orchestration, and behind-the-meter power architecture that shorten time to power. Schneider Electric completed the acquisition of a 75% controlling interest in Motivair for USD 850 million in February 2025 to strengthen its liquid cooling portfolio for AI data centers. These investments and strategic transactions demonstrate the increasing emphasis on energy-efficient, low-carbon, and rapidly deployable power and cooling infrastructure across the green data center ecosystem.
Revenue Shift Context
The market is shifting from conventional, energy-intensive data center infrastructure toward energy-efficient, low-carbon, and sustainability-oriented architectures as operators seek to reduce power consumption, operating costs, and carbon emissions. The rapid growth of AI and high-performance computing is accelerating this transition by increasing power density and cooling requirements, creating greater demand for efficient power distribution, advanced thermal management, renewable energy integration, and intelligent energy management. Technologies such as liquid cooling, high-efficiency UPS systems, renewable-powered generation, energy storage, and intelligent monitoring platforms are increasingly being integrated into data center infrastructure to improve energy utilization and support sustainability targets. Operators are also adopting modular and prefabricated solutions that improve deployment efficiency while incorporating energy-efficient power and cooling systems.
Revenue opportunities are consequently expanding beyond conventional energy-efficiency equipment toward integrated green infrastructure solutions, including renewable energy systems, liquid and immersion cooling, energy storage, high-efficiency power systems, AI-enabled energy management, DCIM platforms, carbon monitoring, and heat recovery technologies. The growing deployment of high-density AI infrastructure is particularly increasing demand for liquid cooling, optimized power architectures, and real-time energy monitoring capable of maintaining performance while controlling energy consumption.
Mergers and Acquisitions
Mergers, acquisitions, and strategic investments are increasingly shaping the Green Data Center Market as infrastructure providers seek to strengthen capabilities across energy-efficient power systems, advanced cooling, renewable energy integration, and intelligent energy management. Recent activity is focused on expanding sustainable technology portfolios, enhancing vertical integration across critical infrastructure components, and accelerating the development and deployment of energy-efficient solutions for AI-ready and high-density data center environments.
GREEN DATA CENTER MARKET: MERGERS AND ACQUISITIONS, AUGUST 2025–SEPTEMBER 2026
Month and Year
Deal Type
Company 1
Company 2
Description
September 2026
Acquisition
Eaton (Ireland)
COL Group (Italy) (from Oaktree)
Eaton signed a deal to buy COL Group at an enterprise value of about EUR 810 million. COL makes medium-voltage distribution equipment, including SF6-free switchgear, grid automation, and modular power systems. The deal expands Eaton’s European manufacturing for data center and utility customers.
September 2026
Acquisition
Vertiv (US)
King Environmental Services (KES) (Ireland)
Vertiv agreed to buy this Europe-based provider of fluid management, commissioning, and load-testing services for liquid-cooled data centers. It extends Vertiv’s thermal services into EMEA, building on PurgeRite in North America.
April 2026
Acquisition
Vertiv (US)
BMarko Structures (US)
Vertiv acquired BMarko to bring structural fabrication in-house and expand capacity for manufactured, prefabricated, and converged infrastructure solutions.
November 2025
Acquisition
Eaton (Ireland)
Boyd Thermal (US)
Eaton announced the USD 9.5 billion purchase of Boyd’s thermal business, which closed on March 12, 2026. It adds liquid cooling and thermal components for data centers, and about 80% of Boyd’s business serves that market.
Company Revenue Share Details
The global Green Data Center Market is led by established power, cooling, and electrical infrastructure providers competing across energy-efficient power distribution, power backup and energy storage, green air and liquid cooling, and DCIM and energy management software. Major participants include Schneider Electric, Vertiv, Eaton, ABB, and Hitachi Energy, alongside other global and regional players such as Daikin, Delta Electronics, Siemens, Carrier, and STULZ. Competition is increasingly shaped by the ability to offer integrated power and cooling portfolios that lower PUE, support renewable and low-carbon power integration, and handle the higher rack densities of AI workloads.
Competition is also shifting toward vertical integration and end-to-end offerings that span grid interconnect to chip. Recent transactions demonstrate this focus on liquid cooling, thermal management, and sustainable power distribution. For example, Eaton’s USD 9.5 billion acquisition of Boyd Thermal added liquid cooling capabilities. Its agreement to acquire COL Group (EUR 810 million enterprise value) adds SF6-free medium-voltage switchgear.
Browse Adjacent Markets Data Center and Networking Market Research Reports & Consulting
Related Market Reports:
Data Center Rack Market by Rack Type (Open Frame, Enclosed), Type (Server Racks, Network Racks), Rack Height (42U & Below, 43U up to 52U), Rack Width (19 Inch, 23 Inch), Data Center Type (Enterprise, Colocation, Hyperscale) – Global Forecast to 2030
Data Center Solutions Market by Infrastructure [Power (Critical Power, Backup, Distribution), Mechanical & Cooling (Air Cooled, Liquid Cooling, Heat Pumps), IT (Server, Storage, Networking), Physical (Racks, Cables)], Software – Forecast to 2031
About MarketsandMarkets™
MarketsandMarkets™ has been recognized as one of America’s Best Management Consulting Firms by Forbes, as per their recent report.
MarketsandMarkets™ is a blue ocean alternative in growth consulting and program management, leveraging a man-machine offering to drive supernormal growth for progressive organizations in the B2B space. With the widest lens on emerging technologies, we are proficient in co-creating supernormal growth for clients across the globe.
Today, 80% of Fortune 2000 companies rely on MarketsandMarkets, and 90 of the top 100 companies in each sector trust us to accelerate their revenue growth. With a global clientele of over 13,000 organizations, we help businesses thrive in a disruptive ecosystem.
The B2B economy is witnessing the emergence of $25 trillion in new revenue streams that are replacing existing ones within this decade. We work with clients on growth programs, helping them monetize this $25 trillion opportunity through our service lines – TAM Expansion, Go-to-Market (GTM) Strategy to Execution, Market Share Gain, Account Enablement, and Thought Leadership Marketing.
Built on the ‘GIVE Growth’ principle, we collaborate with several Forbes Global 2000 B2B companies to keep them future-ready. Our insights and strategies are powered by industry experts, cutting-edge AI, and our Market Intelligence Cloud, KnowledgeStore™, which integrates research and provides ecosystem-wide visibility into revenue shifts.
MarketsandMarkets™ SalesPlay is an AI-driven Revenue Intelligence Co-Pilot designed to help revenue teams prioritize the right accounts, identify critical changes early, and surface opportunities ahead of demand, so pipeline builds naturally and deals close with greater consistency.
To find out more, visit www.MarketsandMarkets™.com or follow us on Twitter, LinkedIn and Facebook.
Contact:
Mr. Rohan Salgarkar
MarketsandMarkets™ INC.
1615 South Congress Ave.
Suite 103, Delray Beach, FL 33445
USA: +1-888-600-6441
Email: sales@marketsandmarkets.com
Visit Our Website: https://www.marketsandmarkets.com/
Content Source: https://www.marketsandmarkets.com/PressReleases/green-data-center-gdc.asp
View original content to download multimedia:https://www.prnewswire.co.uk/news-releases/green-data-center-market-worth-197-02-billion-by-2031–report-by-marketsandmarkets-302912615.html


Goodwill Houston and CompuCycle Launch Tech Recycle Workforce Training Program for Students with Disabilities

xTool Launches C1 Color Cutter : The Full-Color Cutting Machine Built to Scan, Print, and Cut with Precision

Green Data Center Market worth $197.02 billion by 2031 – Report by MarketsandMarkets™

Send Rakhi to UK swiftly with UK Gifts Portal

Whiteboard Series with NEAR | Ep: 45 Joel Thorstensson from ceramic.network

Nullmax and Renesas Forge Strategic Partnership to Deliver Competitive ADAS Solutions for the Global Market

Why You Should Build on #NEAR – Co-founder Illia Polosukhin at CV Labs
Whiteboard Series with NEAR | Ep: 45 Joel Thorstensson from ceramic.network

NEAR End of Year Town Hall 2021: The Open Web World, MetaBUILD 2 Hackathon and 2021 recap
Trending
-

 Coin Market4 days ago
OpenAI model helped itself to testnet crypto, then kept quiet about it
-

 Technology5 days ago
Born to Be Open: RoboParty Launches RP1, a Full-Stack Open-Source Humanoid
-

 Coin Market5 days ago
MSCI adopts index exclusion rules that could oust Strategy
-

 Technology5 days ago
Tucuvi joins the Microsoft Pegasus Program to scale clinically governed AI Care Management across health systems
-

 Technology4 days ago
FF EAI Robotics (FFR) and FF Jointly Launch FF Nova, First Embodied AI Humanoid Robot Priced Below $2,500 in U.S., FF Nova Mini, Physical AI Spark Program Curriculum, Nova Reinforcement Learning Developer Program and Developer Community Recruitment
-

 Technology5 days ago
Bloomberg Law Brings Dockets and Litigation Intelligence to Microsoft Copilot
-

 Coin Market5 days ago
Ex-Trump crypto adviser profited after helping pass stablecoin bill: WSJ
-

 Technology5 days ago
Announcing Mindbeam’s Collaboration with NVIDIA: Bringing Greater Speed and Efficiency to Open Source AI