Connect with us

Technology

General Dynamics Reports Second-Quarter 2026 Financial Results

Published

on

Revenue $14.1 billion, up 8.1% versus prior yearDiluted EPS $4.24, up 13.4% versus prior year$1.9 billion cash from operating activities, 162% of net earnings1.4-to-1 book-to-bill, with strong order activity in all segments

RESTON, Va., July 29, 2026 /PRNewswire/ — General Dynamics (NYSE: GD) today reported second-quarter 2026 operating earnings of $1.5 billion, and $4.24 per diluted share (EPS), on revenue of $14.1 billion. Compared with the year-ago quarter, revenue increased 8.1%, operating earnings increased 11.9%, and diluted EPS increased 13.4%. Operating margin of 10.4% was a 40-basis-point expansion from the year-ago quarter.

“Our businesses delivered solid results in the quarter, with revenue growth across all four segments – including double-digit increases in revenue and noteworthy margin expansion in Aerospace and Marine Systems – reflecting our ongoing efforts to increase the pace of execution and deliver on our backlog,” said Phebe Novakovic, chairman and chief executive officer. “We are well positioned to support our customers’ needs and are continuing to make significant investments to increase output to meet strong and growing demand.”

Cash and Capital Deployment

Net cash provided by operating activities in the quarter totaled $1.9 billion, or 162% of net earnings. During the quarter, the company paid $429 million in dividends, invested $234 million in capital expenditures, and reduced total debt by $498 million. The company ended the quarter with $7.5 billion in total debt and $4.3 billion in cash and equivalents on hand.

Orders and Backlog

Orders received in the quarter totaled $14.7 billion in the defense segments and $5.3 billion in the Aerospace segment, for a total of $20 billion. Book-to-bill ratio, defined as orders divided by revenue, was 1.4-to-1 for the quarter for the defense segments, 1.5-to-1 for the Aerospace segment, and 1.4-to-1 on a company-wide basis. 

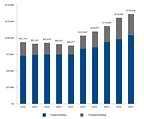
Backlog at the end of the quarter was $136.5 billion. Estimated potential contract value, representing management’s estimate of additional value in unfunded indefinite delivery, indefinite quantity (IDIQ) contracts and unexercised options, was $50.4 billion. Total estimated contract value, the sum of backlog plus estimated potential contract value, was $186.9 billion.

About General Dynamics

Headquartered in Reston, Virginia, General Dynamics is a global aerospace and defense company that offers a broad portfolio of products and services in business aviation; ship construction and repair; land combat vehicles, weapons systems and munitions; and technology products and services. General Dynamics employs more than 120,000 people worldwide and generated $52.6 billion in revenue in 2025. More information is available at www.gd.com.  

WEBCAST INFORMATION: General Dynamics’ financial results conference call will be held on Wednesday, July 29, 2026, at 9:00 a.m. EDT.  A link to the live webcast will be available at www.gd.com and will be available for replay following the call. Corresponding presentation slides will be available for download prior to the call.

This press release may contain forward-looking statements (FLS), including statements about the company’s future operational and financial performance, which are based on management’s expectations, estimates, projections and assumptions. Words such as “expects,” “anticipates,” “plans,” “believes,” “forecasts,” “scheduled,” “outlook,” “estimates,” “should” and variations of these words and similar expressions are intended to identify FLS. In making FLS, we rely on assumptions and analyses based on our experience and perception of historical trends; current conditions and expected future developments; and other factors, estimates and judgments we consider reasonable and appropriate based on information available to us at the time. FLS are made pursuant to the safe harbor provisions of the Private Securities Litigation Reform Act of 1995, as amended. FLS are not guarantees of future performance and involve factors, risks and uncertainties that are difficult to predict. Actual future results and trends may differ materially from what is forecast in the FLS. All FLS speak only as of the date they were made. We do not undertake any obligation to update or publicly release revisions to FLS to reflect events, circumstances or changes in expectations after the date of this press release. Additional information regarding these factors is contained in the company’s filings with the SEC, and these factors may be revised or supplemented in future SEC filings. In addition, this press release may contain some financial measures not prepared in accordance with U.S. generally accepted accounting principles (GAAP). While we believe these non-GAAP metrics provide useful information for investors, there are limitations associated with their use, and our calculations of these metrics may not be comparable to similarly titled measures of other companies. Non-GAAP metrics should not be considered in isolation from, or as a substitute for, GAAP measures. Reconciliations to comparable GAAP measures and other information relating to our non-GAAP measures are included in other filings with the SEC, which are available at investorrelations.gd.com.

EXHIBIT A

CONSOLIDATED STATEMENT OF EARNINGS – (UNAUDITED)

DOLLARS IN MILLIONS, EXCEPT PER SHARE AMOUNTS

Three Months Ended

Variance

July 5, 2026

June 29, 2025

$

%

Revenue

$                     14,094

$                     13,041

$     1,053

8.1 %

Operating costs and expenses

(12,634)

(11,736)

(898)

Operating earnings

1,460

1,305

155

11.9 %

Other, net

(4)

15

(19)

Interest, net

(49)

(88)

39

Earnings before income tax

1,407

1,232

175

14.2 %

Provision for income tax, net

(247)

(218)

(29)

Net earnings

$                       1,160

$                       1,014

$        146

14.4 %

Earnings per share—basic

$                         4.29

$                         3.78

$       0.51

13.5 %

Basic weighted average shares outstanding

270.2

268.1

Earnings per share—diluted

$                         4.24

$                         3.74

$       0.50

13.4 %

Diluted weighted average shares outstanding

273.5

270.9


EXHIBIT B

CONSOLIDATED STATEMENT OF EARNINGS – (UNAUDITED)

DOLLARS IN MILLIONS, EXCEPT PER SHARE AMOUNTS

Six Months Ended

Variance

July 5, 2026

June 29, 2025

$

%

Revenue

$                     27,575

$                     25,264

$     2,311

9.1 %

Operating costs and expenses

(24,695)

(22,691)

(2,004)

Operating earnings

2,880

2,573

307

11.9 %

Other, net

14

36

(22)

Interest, net

(118)

(177)

59

Earnings before income tax

2,776

2,432

344

14.1 %

Provision for income tax, net

(491)

(424)

(67)

Net earnings

$                       2,285

$                       2,008

$        277

13.8 %

Earnings per share—basic

$                         8.46

$                         7.48

$       0.98

13.1 %

Basic weighted average shares outstanding

270.2

268.6

Earnings per share—diluted

$                         8.35

$                         7.40

$       0.95

12.8 %

Diluted weighted average shares outstanding

273.8

271.3


EXHIBIT C

REVENUE AND OPERATING EARNINGS BY SEGMENT – (UNAUDITED)

DOLLARS IN MILLIONS

Three Months Ended

Variance

July 5, 2026

June 29, 2025

$

%

Revenue:

Aerospace

$                  3,525

$                   3,062

$            463

15.1 %

Marine Systems

4,660

4,220

440

10.4 %

Combat Systems

2,290

2,283

7

0.3 %

Technologies

3,619

3,476

143

4.1 %

Total

$                14,094

$                 13,041

$         1,053

8.1 %

Operating earnings:                                           

Aerospace

$                     510

$                      403

$            107

26.6 %

Marine Systems

342

291

51

17.5 %

Combat Systems

318

324

(6)

(1.9) %

Technologies

339

332

7

2.1 %

Corporate

(49)

(45)

(4)

(8.9) %

Total

$                  1,460

$                   1,305

$            155

11.9 %

Operating margin:

Aerospace

14.5 %

13.2 %

Marine Systems

7.3 %

6.9 %

Combat Systems

13.9 %

14.2 %

Technologies

9.4 %

9.6 %

Total

10.4 %

10.0 %


EXHIBIT D

REVENUE AND OPERATING EARNINGS BY SEGMENT – (UNAUDITED)

DOLLARS IN MILLIONS

Six Months Ended

Variance

July 5, 2026

June 29, 2025

$

%

Revenue:

Aerospace

$                  6,804

$                   6,088

$            716

11.8 %

Marine Systems

9,003

7,809

1,194

15.3 %

Combat Systems

4,573

4,459

114

2.6 %

Technologies

7,195

6,908

287

4.2 %

Total

$                27,575

$                 25,264

$         2,311

9.1 %

Operating earnings:                                          

Aerospace

$                  1,003

$                      835

$            168

20.1 %

Marine Systems

658

541

117

21.6 %

Combat Systems

628

615

13

2.1 %

Technologies

678

660

18

2.7 %

Corporate

(87)

(78)

(9)

(11.5) %

Total

$                  2,880

$                   2,573

$            307

11.9 %

Operating margin:

Aerospace

14.7 %

13.7 %

Marine Systems

7.3 %

6.9 %

Combat Systems

13.7 %

13.8 %

Technologies

9.4 %

9.6 %

Total

10.4 %

10.2 %


EXHIBIT E

CONSOLIDATED BALANCE SHEET

DOLLARS IN MILLIONS

(Unaudited)

July 5, 2026

December 31, 2025

ASSETS

Current assets:

Cash and equivalents

$                        4,333

$                        2,333

Accounts receivable

2,398

2,406

Unbilled receivables

9,255

8,380

Inventories

9,097

9,232

Other current assets

1,955

1,897

Total current assets

27,038

24,248

Noncurrent assets:

Property, plant and equipment, net

7,575

7,525

Intangible assets, net

1,281

1,375

Goodwill

20,927

21,009

Other assets

3,342

3,092

Total noncurrent assets

33,125

33,001

Total assets

$                      60,163

$                      57,249

LIABILITIES AND SHAREHOLDERS’ EQUITY

Current liabilities:

Short-term debt and current portion of long-term debt                                                  

$                        1,256

$                        1,006

Accounts payable

2,874

2,678

Customer advances and deposits

11,034

9,824

Other current liabilities

3,601

3,288

Total current liabilities

18,765

16,796

Noncurrent liabilities:

Long-term debt

6,260

7,007

Other liabilities

8,312

7,824

Total noncurrent liabilities

14,572

14,831

Shareholders’ equity:

Common stock

482

482

Surplus

4,535

4,403

Retained earnings

45,502

44,080

Treasury stock

(23,110)

(22,860)

Accumulated other comprehensive loss

(583)

(483)

Total shareholders’ equity

26,826

25,622

Total liabilities and shareholders’ equity

$                      60,163

$                      57,249


EXHIBIT F

CONSOLIDATED STATEMENT OF CASH FLOWS – (UNAUDITED)

DOLLARS IN MILLIONS

Six Months Ended

July 5, 2026

June 29, 2025

Cash flows from operating activities—continuing operations:

Net earnings

$                      2,285

$                      2,008

Adjustments to reconcile net earnings to net cash from operating activities:              

Depreciation of property, plant and equipment

348

325

Amortization of intangible and finance lease right-of-use assets

115

121

Equity-based compensation expense

107

89

Deferred income tax provision (benefit)

365

(98)

(Increase) decrease in assets, net of effects of business acquisitions:

Accounts receivable

8

(612)

Unbilled receivables

(846)

(200)

Inventories

135

(207)

Increase (decrease) in liabilities, net of effects of business acquisitions:

Accounts payable

196

(261)

Customer advances and deposits

1,168

106

Other, net

154

179

Net cash provided by operating activities

4,035

1,450

Cash flows from investing activities:

Capital expenditures

(437)

(340)

Other, net

13

124

Net cash used by investing activities

(424)

(216)

Cash flows from financing activities:

Dividends paid

(834)

(785)

Repayment of fixed-rate notes

(500)

(1,500)

Purchases of common stock

(319)

(600)

Proceeds from commercial paper, net

696

Proceeds from fixed-rate notes

747

Other, net

48

39

Net cash used by financing activities

(1,605)

(1,403)

Net cash used by discontinued operations

(6)

(5)

Net increase (decrease) in cash and equivalents

2,000

(174)

Cash and equivalents at beginning of period

2,333

1,697

Cash and equivalents at end of period

$                      4,333

$                      1,523


EXHIBIT G

ADDITIONAL FINANCIAL INFORMATION – (UNAUDITED)

DOLLARS IN MILLIONS, EXCEPT PER SHARE AMOUNTS

Non-GAAP Financial Measures:

Second Quarter

Six Months

2026

2025

2026

2025

Free cash flow:

Net cash provided by operating activities 

$                       1,880

$                  1,598

$                    4,035

$                    1,450

Capital expenditures

(234)

(198)

(437)

(340)

Free cash flow (a)

$                       1,646

$                  1,400

$                    3,598

$                    1,110

July 5, 2026

December 31, 2025

Net debt:

Total debt

$                       7,516

$                  8,013

Less cash and equivalents

4,333

2,333

Net debt (b)

$                       3,183

$                  5,680

Supplemental Aerospace Data:

Second Quarter

Six Months

2026

2025

2026

2025

Gulfstream Aircraft Deliveries (units):

Large-cabin aircraft

35

32

66

62

Mid-cabin aircraft

6

6

13

12

Total

41

38

79

74

Aerospace Book-to-Bill:

Orders (c)

$                       5,278

$                  4,003

$                    9,121

$                    6,364

Revenue

3,525

3,062

6,804

6,088

Book-to-Bill Ratio

1.5x

1.3x

1.3x

1.0x

(a)  

We define free cash flow as net cash from operating activities less capital expenditures. We believe free cash flow is a useful measure

for investors because it portrays our ability to generate cash from our businesses for purposes such as repaying debt, funding business

acquisitions, paying dividends and repurchasing our common stock to cover dilution. We use free cash flow to assess the quality of our

earnings and as a key performance measure in evaluating management.

(b)

We define net debt as short- and long-term debt (total debt) less cash and equivalents. We believe net debt is a useful measure for

investors because it reflects the borrowings that support our operations and capital deployment strategy. We use net debt as an

important indicator of liquidity and financial position.

(c)

Excludes customer defaults, liquidated damages, cancellations, foreign exchange fluctuations and other backlog adjustments.


EXHIBIT H

BACKLOG – (UNAUDITED)

DOLLARS IN MILLIONS

Funded

Unfunded

Total

Backlog

Estimated

Potential

Contract Value*

Total

Estimated

Contract Value

Second Quarter 2026:                         

Aerospace

$            22,992

$                 985

$            23,977

$                     1,170

$               25,147

Marine Systems

42,356

22,826

65,182

7,442

72,624

Combat Systems

27,507

1,843

29,350

10,847

40,197

Technologies

11,256

6,733

17,989

30,945

48,934

Total

$          104,111

$            32,387

$          136,498

$                   50,404

$             186,902

First Quarter 2026:

Aerospace

$            21,172

$              1,095

$            22,267

$                     1,040

$               23,307

Marine Systems

40,598

23,373

63,971

12,519

76,490

Combat Systems

25,532

1,383

26,915

11,770

38,685

Technologies

10,818

6,869

17,687

32,272

49,959

Total

$            98,120

$            32,720

$          130,840

$                   57,601

$             188,441

Second Quarter 2025:      

Aerospace

$            18,676

$              1,227

$            19,903

$                     1,165

$               21,068

Marine Systems

39,298

13,674

52,972

14,708

67,680

Combat Systems

15,961

616

16,577

9,592

26,169

Technologies

9,945

4,285

14,230

32,011

46,241

Total

$            83,880

$            19,802

$          103,682

$                   57,476

$             161,158

*   

The estimated potential contract value includes work awarded on unfunded indefinite delivery, indefinite quantity (IDIQ) contracts and

unexercised options associated with existing firm contracts, including options and other agreements with existing customers to purchase

new aircraft and aircraft services. We recognize options in backlog when the customer exercises the option and establishes a firm order.

For IDIQ contracts, we evaluate the amount of funding we expect to receive and include this amount in our estimated potential contract

value. The actual amount of funding received in the future may be higher or lower than our estimate of potential contract value.


EXHIBIT H-1

BACKLOG – (UNAUDITED)

DOLLARS IN MILLIONS

https://mmx.prnewswire.com/media/MS1959817/GD-Q2.jpg?id=OA2797589

View original content to download multimedia:https://www.prnewswire.com/news-releases/general-dynamics-reports-second-quarter-2026-financial-results-302836859.html

SOURCE General Dynamics

Continue Reading
Click to comment

Leave a Reply

Your email address will not be published. Required fields are marked *

Technology

JOTO PR Disruptors Names Norman Arjonilla COO to Scale Anti-PR Delivery and Performance

Published

on

By

With more than two decades of experience building high-performance teams, quality-control systems, and measurable execution models, Arjonilla will lead operational discipline across JOTO PR’s growing Anti-PR delivery infrastructure.

TAMPA, Fla., July 29, 2026 /PRNewswire/ — JOTO PR Disruptors, an agency specializing in Anti-PR and disruption-driven communications, announced that Norman Arjonilla has been appointed Chief Operating Officer, reinforcing the agency’s continued investment in scaling its delivery model through consistent client execution. Arjonilla, who previously served as JOTO PR’s Anti-PR Chief of Delivery & Excellence, brings more than 20 years of leadership experience across quality control, team development, and performance management. As Chief Operating Officer, he will oversee the standards, policies, metrics, and workflows supporting JOTO PR’s client service, media relations, and delivery divisions.

“Norman Arjonilla displays the exact kind of operational leadership required for an agency built on accountability, speed, and measurable outcomes,” said Karla Jo Helms, Chief Executive Officer and Chief Evangelist of JOTO PR Disruptors. “JOTO’s Anti-PR model depends on precision. Strong strategy and media instincts must be supported by teams and processes that perform consistently. Norman understands how to build that foundation, empower people within it, and scale what works.”

A Career Built on Control, Metrics, and People

Arjonilla’s leadership philosophy centers on clear expectations, open communication and clear guidelines. He has spent his career helping organizations identify weaknesses, improve team execution, and establish repeatable practices that support long-term growth.

Before joining JOTO PR, Arjonilla held quality-control leadership roles at Blackstone Medical Services, where he helped scale national sales teams from approximately 40 to more than 70 representatives. He supported record year-over-year growth through structured training, daily accountability, and performance oversight. He also built and trained acquisition teams at Andrews Land Holdings, implementing workflows and negotiation strategies designed to improve consistency and profitability.

Scaling the Anti-PR Delivery Model

In his new role, Arjonilla will focus on strengthening the operational backbone behind JOTO PR’s client campaigns, streamlining cross-department production flow, reinforcing quality-control standards, expanding employee training, and improving visibility into agency performance. His work will center on building the operational structure needed to support JOTO PR’s continued growth.

“Agencies often grow by adding more people, more tools, and more activity,” Arjonilla said. “But growth only becomes sustainable when the operation underneath it is measured and understood. My focus is to make sure JOTO’s delivery engine is built to scale without losing precision, morale, or performance.”

The appointment comes as JOTO PR continues to establish Anti-PR as an alternative to traditional public relations models. The agency’s approach is built around identifying market disruption, shaping problem-led narratives, and creating media strategies that connect client expertise to timely solutions-led conversations across business, healthcare, technology, consumer markets, and public policy.

Building a Stronger Agency Infrastructure

Arjonilla’s background in talent development, supervisory leadership, and performance management will help strengthen JOTO PR’s internal training systems, client-readiness standards, and culture of continuous improvement. His multilingual fluency in English, Spanish, and Italian adds another layer to his ability to lead across teams, cultures, and communication styles.

For Arjonilla, the COO role is about creating conditions for people to perform with clarity and confidence.

“Good operations do not make people feel controlled. They give people the structure to win,” Arjonilla said. “When expectations are clear, metrics are understood, and everyone knows what successful delivery looks like, the whole team becomes more capable. That is what I want to help build at JOTO PR.”

About JOTO PR Disruptors™
JOTO PR Disruptors™ is the Anti-PR® agency behind some of the fastest-growing tech and innovation brands in the U.S. By applying crisis management techniques and modern media algorithms, JOTO PR creates third-party credibility campaigns that produce measurable results and build undeniable market influence. Learn more at www.jotopr.com. 

Media Contact:
Karla Jo Helms
JOTO PR™
727-777-4629
jotopr.com

View original content to download multimedia:https://www.prnewswire.com/news-releases/joto-pr-disruptors-names-norman-arjonilla-coo-to-scale-anti-pr-delivery-and-performance-302837353.html

SOURCE JOTO PR

Continue Reading

Technology

Eolian Announces 1+ GWh Flint Grid BESS: PJM’s Largest Battery Energy Storage Project Now Under Construction to Support America’s Fastest-Growing Data Center and Industrial Corridor near Columbus, Ohio

Published

on

By

Flint Grid, a 200 MW / 5.3-hour (1.06 GWh) battery energy storage project, demonstrates how Eolian’s long-term investment strategy anticipated growing electricity demand and will unlock the grid using flexible resources in the core of one of the nation’s most critical locations for AI datacenter development.

COLUMBUS, Ohio, July 29, 2026 /PRNewswire/ — Eolian announced that Flint Grid, a 200MW, 5+hour duration grid-scale battery energy storage system in Jersey Township, Licking County, Ohio, has started construction (“Flint Grid Project”). Located adjacent to New Albany datacenter and industrial load, the Flint Grid Project is the first large-scale battery energy storage system to qualify for the PJM capacity market and the largest battery storage system to clear the 2027/28 Residual Capacity Auction, representing more than 50 percent of all new battery storage capacity in that capacity year.

Eolian’s Flint Grid, a 1.06 GWh BESS, will unlock the grid and balance costs in critical location for datacenter growth.

The Flint Grid Project is also the first grid-scale battery energy storage system permitted by the Ohio Power Siting Board and the largest battery energy storage system built to date in Ohio and the PJM footprint, establishing an important precedent for future energy storage development across the state.

Eolian is actively collaborating with grid operators, regulators, and industry stakeholders on research and policy initiatives to advance battery energy storage integration into wholesale electricity markets, including technical frameworks for optimal bidding protocols, new market products for energy storage participation, ELCC accreditation methodology, revenue optimization across multiple wholesale market segments, and a recognition that strategically-located battery storage projects can actually increase transmission capacity in constrained locations with increasing load demands.

“There’s growing consternation about how the US can rapidly scale infrastructure to support America’s growing electricity demand, but not nearly enough conversation about how to use existing technology to unlock the wasted capacity that already exists on the grid” said Aaron Zubaty, Founder and Chief Executive Officer of Eolian. “Flint Grid demonstrates how companies like Eolian have been investing in solutions to unlock the grid and reduce price pressures on consumers using proven and scalable technology. This project requires hundreds of millions of dollars to construct, and we committed the necessary capital and resources years before today’s demand forecasts became headline news. As policymakers consider changes to competitive electricity markets, it’s critical that they avoid undermining the long-term investments already underway that will make better use of existing transmission infrastructure and that create a bridge to further long-term supply expansion.”

Battery energy storage complements traditional grid infrastructure by providing flexible capacity that responds in milliseconds to stabilize and back up the grid during high-risk events, while optimizing how to match power supply and demand through all hours of the day, every day of the year.

Flint Grid is expected to enter commercial operation in advance of the 2027–2028 PJM capacity year.

About Eolian
Eolian operates a growing portfolio of battery energy storage projects and develops and invests in clean energy and co-located large load projects across the US. For over 20 years, Eolian’s founding management has worked together to build the assets at the core of the company, creating unique and proprietary structures that have directly funded the development of nearly 30 GW of operating or under-construction energy storage, solar, and wind generating capacity across the country. Eolian is owned by its employees and funds that are managed by Global Infrastructure Partners (GIP), a BlackRock company and leading global infrastructure investor. For more information, follow Eolian on LinkedInYoutube or visit www.eolianenergy.com.

View original content to download multimedia:https://www.prnewswire.com/news-releases/eolian-announces-1-gwh-flint-grid-bess-pjms-largest-battery-energy-storage-project-now-under-construction-to-support-americas-fastest-growing-data-center-and-industrial-corridor-near-columbus-ohio-302837697.html

SOURCE Eolian Energy

Continue Reading

Technology

Quantifind Selected by FCC to Strengthen U.S. Communications Infrastructure Security

Published

on

By

WASHINGTON, July 29, 2026 /PRNewswire/ — The Federal Communications Commission (FCC) has selected Quantifind to support safeguarding U.S. communications infrastructure. The partnership addresses growing risks tied to foreign ownership, control, or influence within the sector.

Under the agreement, the FCC will employ Quantifind’s Graphyte platform, an AI-powered research tool that helps analysts rapidly assess ownership structures, hidden relationships, sanctions exposure, and other risk indicators across fragmented public and commercial data sources. The platform supports beneficial ownership analysis, automated reporting, and integration with FCC workflows through both individual search and batch-screening capabilities, which will accelerate FCC investigations into entities, equipment, and services that may threaten U.S. national security.

The FCC’s published justification stated that after evaluating 17 potential solutions, Quantifind was identified as the most comprehensive and cost-effective option, uniquely meeting the FCC’s technical requirements for integrated supply chain risk analysis, API integration, and automated risk scoring.

“Networks are increasingly complex and opaque, which makes the work of the FCC’s Public Safety and Homeland Security Bureau more challenging than ever,” said Ari Tuchman, Quantifind CEO and co-founder. “We built Quantifind to rapidly and accurately uncover connections hidden in vast, messy data, and we are proud to put our software to work on the national security mission of this Bureau.”

About the FCC Public Safety and Homeland Security Bureau

The FCC’s Public Safety and Homeland Security Bureau is responsible for supporting national security reviews, maintaining the FCC Covered List, and responding to requests from interagency partners including the Committee on Foreign Investment in the United States (CFIUS) and Team Telecom. These missions involve analyzing vast amounts of data from disparate sources to pinpoint entities, equipment, and services that may pose an unacceptable risk to national security.

About Quantifind

Quantifind is the leader in AI-driven risk intelligence, trusted by seven of the 10 largest U.S. banks and multiple federal agencies to uncover hidden risks in complex data. Its Graphyte™ platform uses machine learning, natural language processing, and proprietary Name Science™ to detect indicators of illicit finance, foreign influence, and supply-chain exposure across billions of records. Quantifind was founded in 2009 and is headquartered in Palo Alto, California.

For more information, visit www.quantifind.com

Media Contact:

Carla O
Director, Public Sector Marketing
carlao@quantifind.com

View original content to download multimedia:https://www.prnewswire.com/news-releases/quantifind-selected-by-fcc-to-strengthen-us-communications-infrastructure-security-302837270.html

SOURCE Quantifind

Continue Reading

Trending