Connect with us

Technology

NextVision Announces Record Second Quarter 2026 Results

Published

on

Raises its 2026 Revenue Target to $355m, its Second Increase This Year

Highlights

Updated revenue target reflects growth of 111% compared with 2025, on continued demand for the Company’s systemsAnother quarter of accelerated growth – revenue of $88.2m, up 138% year-over-yearGross margin of 65.2%, within the Company’s target range, alongside a high operating margin of 58.8%Strong cash flow of $43.8m, alongside continued investment in inventory and production infrastructure

RA’ANANA, Israel, Aug. 10, 2026 /PRNewswire/ — NextVision Stabilized Systems Ltd. (TASE: NXSN), a technology growth company that develops, manufactures and markets stabilized day- and night-vision imaging solutions for ground and aerial platforms such as micro and mini UAVs and drones, with industry-leading weight-to-size and performance ratios, today announced its financial results for the second quarter and first half of 2026.

Chen Golan, Chairman of NextVision, commented: “The second quarter continues to demonstrate NextVision’s growth momentum. Strong demand for the Company’s products, alongside our ability to expand our operations and increase production capacity, despite a challenging supply chain environment, enables us to raise our 2026 revenue guidance for the second time this year. We continue to deliver quality growth while maintaining high profitability, generating significant cash flow while investing in production infrastructure and in the Company’s growth engines. In parallel, we continue to expand our production capabilities, develop new products and broaden our portfolio of solutions, alongside actively evaluating opportunities for strategic acquisitions. These steps are intended to strengthen the Company’s competitive advantage, deepen the value we provide to our customers and establish our growth engines for the years ahead.”

Financial Highlights for Q2 2026

Revenue in the second quarter grew 138% to $88.2 million, compared with $37.1 million in the same quarter last year. The growth reflects the Company’s ability to continue expanding its activity across several markets in parallel, while increasing production capacity and deepening its engagement with its global customer base. Europe and North America continue to be the Company’s principal demand engines, alongside the expansion of activity in additional markets.

The Company’s global customer base numbers more than 300 Western platform manufacturers, of which 150 were active during the first half of 2026.

Gross profit totaled $57.5 million, representing 65.2% of revenue. The gross margin remained within the Company’s target range, alongside continued growth in the scale of activity and deeper engagement with strategic customers, demonstrating the Company’s ability to continue expanding while maintaining high levels of profitability.

Operating profit totaled $51.8 million, compared with $23 million in the same quarter last year, reflecting an operating margin of 58.8%. The increase in the scale of activity, together with an efficient cost structure, support a high operating margin and demonstrates the Company’s ability to benefit from economies of scale while maintaining strong operational discipline.

Net profit totaled $53.6 million, more than double the $23.2 million recorded in the same quarter last year.

Cash flow from operating activities totaled $43.8 million, compared with $5.5 million in the same quarter last year, this growth comes alongside continued investment in inventory and in the expansion of production capabilities.

Inventory as of June 30, 2026 totaled $71.7 million, compared with $62 million at the end of the first quarter of the year. The increase in inventory is part of the Company’s strategy to expand production capabilities, strengthen the supply chain and improve operational flexibility, in order to support the continued increase in demand and to shorten delivery times to customers.

Order backlog as of August 9, 2026 totaled $265.2 million, and continues to provide the Company with high business visibility that supports the execution of its growth plan.

Increased 2026 Revenue Target: In light of the continued growth in the Company’s activity, the expansion of activity with strategic customers, the increase in production capabilities and its ability to translate demand for its products into accelerated growth, the Company is raising its revenue target for 2026 to $355 million, compared with a previous target of $315 million. The updated target reflects growth of 111% over 2025 revenue and represents the Company’s second increase to its revenue guidance this year.

Investors’ Conference Call

Today at 1:30pm Israel time, 6:30am Eastern Time, NextVision will hold an investor webinar in Hebrew to review the Financial Statements and provide an update on the Company’s ongoing activities, with the participation of the Company’s management.

Following that, at 3:30pm Israel time, 8:30am Eastern Time, NextVision will hold an investor webinar in English, with the participation of the Company’s management.

Participation in the webinar requires prior registration via the following links:

For the Hebrew Webinar:
https://us06web.zoom.us/webinar/register/WN_3FXEhLOhS7miu2MO8t9q-g#/registration

For the English Webinar:
https://us06web.zoom.us/webinar/register/WN_b6A5zXatTHu3ZNKxskbgeQ#/registration

The Company intends to publish a presentation shortly before the webinars, which will be presented during the event. Attendees will be able to submit questions in English or Hebrew, which will be translated and answered in English.

About NextVision Stabilized Systems Ltd.

NextVision is a leading technology company specializing in stabilized imaging systems for aerial and ground platforms, including micro and mini UAVs and drones. The company offers customers a comprehensive imaging solution encompassing a wide range of cameras, complementary accessories, and integrated capabilities for commercial, industrial, and security applications — positioning NextVision as a true ‘one-stop shop’.

NextVision has developed a patented image stabilization engine that enables the production of high-performance stabilized cameras with world-class size-to-weight ratios. This technology ensures stable, high-quality imagery even in demanding flight conditions. The company markets its products worldwide and continues to experience steady growth in its global customer base.

International Investor Relations

Ehud Helft
nextvision@ekgir.com
EK Global Investor Relations
(US) +1 212 378 8040


Condensed Statements of Financial Position

As of June 30

As of December 31,

2026

2025

2025

Unaudited

Audited

USD thousands

Current assets

Cash

20,319

42,580

85,440

 Short term deposits

571,135

67,424

476,857

Trade receivables

40,477

17,560

12,087

Current tax receivable

4,602

516

4,746

Other accounts receivable

13,021

4,819

5,275

Inventory

71,654

40,628

53,588

721,208

173,527

637,993

Non-current assets

Fixed assets

1,374

872

906

Right of use assets

4,568

3,187

2,770

Intangible assets

7,253

4,415

4,896

13,195

8,474

8,572

734,403

182,001

646,565

Current liabilities

Trade payables

22,194

10,078

8,679

Other accounts payable

34,093

14,191

18,067

56,287

24,269

26,746

Non-current liabilities

Lease liabilities

5,158

3,540

3,390

Employee benefit liabilities, net

151

114

151

Deferred taxes

883

515

588

6,192

4,169

4,129

Equity

Share capital and premium

458,777

47,112

446,328

Reserve for share-based payment

12,161

5,402

8,455

Retained earnings

200,986

101,049

160,907

Total equity

671,924

153,563

615,690

734,403

182,001

646,565


Condensed Statements of Comprehensive Income

For the six months
ended June 30

For the three months
ended June 30

For the year
ended
December 31

2026

2025

2026

2025

2025

Unaudited

Audited

USD thousands (excl. share profit data)

Income from sales

155,541

73,243

88,152

37,080

168,354

Cost of sales

(52,798)

(20,198)

(30,704)

(10,523)

(50,798)

Gross profit

102,743

53,045

57,448

26,557

117,556

Research and development expenses

(3,629)

(2,276)

(1,836)

(1,324)

(5,491)

Sales and marketing expenses

(1,666)

(877)

(939)

(430)

(1,874)

General and administrative expenses

(7,295)

(4,682)

(2,868)

(1,795)

(8,667)

(12,590)

(7,835)

(5,643)

(3,549)

(16,032)

Operating profit

90,153

45,210

51,805

23,008

101,524

Financing expenses

(861)

(152)

(741)

(120)

(313)

Financing income

12,254

4,089

6,261

2,159

13,453

Profit before tax

101,546

49,147

57,325

25,047

114,664

Income taxes

(9,635)

(5,351)

(3,677)

(1,824)

(11,000)

Net profit

91,911

43,796

53,648

23,223

103,664

Other comprehensive income (net of tax
  effects):

Amounts that will not be subsequently
  reclassified to profit or loss:

Loss from re-measurement for defined
  benefit plans

(10)

Total other comprehensive loss

(10)

Total comprehensive income

91,911

43,796

53,648

23,223

103,654

Net profit per share (in US dollars)

Base net profit

1.001

0.542

0.583

0.286

1.235

Diluted net profit

0.968

0.522

0.565

0.275

1.106


View original content:https://www.prnewswire.com/news-releases/nextvision-announces-record-second-quarter-2026-results-302847022.html

SOURCE NextVision

Continue Reading
Click to comment

Leave a Reply

Your email address will not be published. Required fields are marked *

Technology

Hello Group to Report Second Quarter 2026 Results on September 3, 2026

Published

on

By

BEIJING, Aug. 10, 2026 /PRNewswire/ — Hello Group Inc. (NASDAQ: MOMO) (the “Company”), a leading player in Asia’s online social networking space, today announced that it will release its unaudited financial results for the second quarter ended June 30, 2026 before U.S. markets open on Thursday, September 3, 2026.

Hello Group’s management will host an earnings conference call on Thursday, September 3, 2026, at 7:00 a.m. U.S. Eastern Time (7:00 p.m. Beijing / Hong Kong Time on the same day).

Preregistration Information

Participants can register for the conference call by navigating to https://s1.c-conf.com/diamondpass/10056690-cemk7n.html.Upon registration, each participant will receive details for the conference call, including dial-in numbers, conference call passcode and a unique access PIN. Please dial in 10 minutes before the call is scheduled to begin.

A telephone replay of the call will be available after the conclusion of the conference call through September 10, 2026. The dial-in details for the replay are as follows:

U.S. / Canada:

1-855-883-1031

Hong Kong:

800-930-639

Passcode:

10056690

Additionally, a live and archived webcast of the conference call will be available on the Investor Relations section of Hello Group’s website at https://ir.hellogroup.com.

About Hello Group Inc.

We are a leading player in Asia’s online social networking space. Through Momo, Tantan and other properties within our product portfolio, we enable users to discover new relationships, expand their social connections and build meaningful interactions. Momo is a mobile application that connects people and facilitates social interactions based on location, interests and a variety of online recreational activities. Tantan, which we added to our family of applications through acquisition in May 2018, is a leading social and dating application. Tantan is designed to help its users find and establish romantic connections as well as meet interesting people. Since 2019, we have continuously expanded our portfolio through internal incubation and strategic acquisitions, adding apps such as Hertz, Soulchill, and Happn. These products target more niche markets and selective user demographics both domestically and internationally, further strengthening our global presence.

For investor and media inquiries, please contact:

Hello Group Inc.

Investor Relations
Phone: +852-3157-1669
Email: ir@hellogroup.com

Christensen

In China
Ms. Xiaoyan Su
Phone: +86-10-5900-1548
E-mail: Xiaoyan.Su@christensencomms.com 

View original content:https://www.prnewswire.com/news-releases/hello-group-to-report-second-quarter-2026-results-on-september-3-2026-302847025.html

SOURCE Hello Group Inc.

Continue Reading

Technology

CAMTEK ANNOUNCES RESULTS FOR THE SECOND QUARTER OF 2026

Published

on

By

Q2 record revenues of $133.2 million; Expects more than 30% growth in H2-26 vs. H1-26 and further growth into 2027

MIGDAL HAEMEK, Israel, Aug. 10, 2026 /PRNewswire/ — Camtek Ltd. (NASDAQ: CAMT) (TASE: CAMT), today announced its financial results for the second quarter ended June 30, 2026.

2026 Second Quarter Financial Highlights

Record revenues of $133.2 million, a 8% YoY increase;GAAP gross margin of 50.1% and non-GAAP gross margin of 51.4%;GAAP operating income of $27.2 million and non-GAAP operating income of $36.0 million, representing operating margins of 20.4% and 25.9%, respectively; andGAAP net income of $23.3 million and non-GAAP net income of $39.4 million; GAAP diluted EPS of $0.46 and non-GAAP diluted EPS of $0.78.Completion of the acquisition of Visual Layer

Forward-Looking Expectations

Management expects continued growth in the third quarter of $158 to $160 million which represents an exceptional 20% growth quarter over quarter.

Given our strong order momentum and record backlog, management expects more than 30% growth in H2-26 vs. H1-26 followed by continued growth into 2027.

Management Comment

Rafi Amit, Camtek’s CEO commented, “I am very pleased with the second quarter results which came ahead of our expectations. Since the beginning of 2026 we have experienced a growing momentum of order intake bringing the total amount of orders received since the beginning of the year to about $600M, with deliveries scheduled for 2026 and 2027. This exceptional order intake coupled with our strong market position in the AP segment is expected to result in phenomenal growth in our AP business of 45% half over half.”

Concluded Mr. Amit, “The AI revolution is driving unprecedented demand for data centers. With AI adoption still in its early stages, we believe demand for AI compute infrastructure will continue to grow significantly. Our product development roadmap is closely aligned with the technology roadmaps of the industry leaders. Our strong customer engagement, combined with our expanding product portfolio and proven execution, gives us great confidence in our ability to deliver sustained growth in the years ahead.”

Second Quarter 2026 Financial Results

Revenues for the second quarter of 2026 were $133.2 million. This compares to second quarter 2025 revenues of $123.3 million, a year-over-year growth of 8%.

Gross profit on a GAAP basis in the quarter totaled $66.7 million (50.1% of revenues), an increase of 6% compared to $62.2 million (50.8% of revenues) in the second quarter of 2025.

Gross profit on a non-GAAP basis in the quarter totaled $68.5 million (51.4% of revenues), an increase of 7% compared to $64.0 million (51.9% of revenues) in the second quarter of 2025.

Operating income on a GAAP basis in the quarter totaled $27.2 million (20.4% of revenues), a decrease of 15% compared to $32.0 million (25.9% of revenues) in the second quarter of 2025.

Operating income on a non-GAAP basis in the quarter totaled $36.0 million (27.0% of revenues), a decrease of 4% compared to $37.4 million (30.3% of revenues) in the second quarter of 2025.

Net income on a GAAP basis in the quarter totaled $23.3 million, or $0.46 per diluted share, a decrease of 31% compared to net income of $33.7 million, or $0.69 per diluted share, in the second quarter of 2025.

Net income on a non-GAAP basis in the quarter totaled $39.4 million, or $0.78 per diluted share, an increase of 2% compared to a non-GAAP net income of $38.8 million, or $0.79 per diluted share, in the second quarter of 2025. 

Cash and cash equivalents, short-term and long-term deposits, and marketable securities, as of June 30, 2026, were $815.8 million compared to $849.7 million as of March 31, 2026. During the second quarter, the Company generated an operating cash flow of $12.2 million.

Conference Call

Camtek will host a video conference call/webinar today via Zoom, on August 10, 2026, at 09:00 ET (16:00 Israel time). Rafi Amit, CEO, Moshe Eisenberg, CFO, and Ramy Langer, COO will host the call and will be available to answer questions after presenting the results.

To participate in the webinar, please register using the following link, which will provide access to the video call: https://us06web.zoom.us/webinar/register/WN_vO7fjrtzSI2vxwrecVbQNQ

For those wishing to listen via phone, following registration, the dial in link will be sent. For any problems in registering, please email Camtek’s investor relations a few hours in advance of the call.

For those unable to participate, a recording will be available on Camtek’s website at http://www.camtek.com  within a few hours after the call.

A summary presentation of the quarterly results will also be available on Camtek’s website. 

ABOUT CAMTEK LTD.

Camtek is a developer and manufacturer of high-end inspection and metrology equipment for the semiconductor industry. Camtek’s systems inspect IC and measure IC features on wafers throughout the production process of semiconductor devices, covering the front and mid-end and up to the beginning of assembly (Post Dicing). Camtek’s systems inspect wafers for the most demanding semiconductor market segments, including Advanced Interconnect Packaging, Heterogenous Integration, Memory and HBM, CMOS Image Sensors, Compound Semiconductors, MEMS, and RF, serving numerous industries’ leading global IDMs, OSATs, and foundries.

With manufacturing facilities in Israel and Germany, and eight offices around the world, Camtek provides state of the art solutions in line with customers’ requirements.

This press release is available at http://www.camtek.com

This press release contains statements that may constitute “forward-looking statements” within the meaning of the Private Securities Litigation Reform Act of 1995. Such forward-looking statements are based on Camtek’s current beliefs, expectations and assumptions about its business and industry, all of which may change.  Forward-looking statements can be identified by the use of words including “believe,” “anticipate,” “should,” “intend,” “plan,” “will,” “may,” “expect,” “estimate,” “project,” “positioned,” “strategy,” and similar expressions that are intended to identify forward-looking statements, including our expectations and statements relating to our future earnings and guidance, the compound semiconductors market and our position in this market. These forward-looking statements involve known and unknown risks and uncertainties that may cause the actual results, performance or achievements of Camtek to be materially different from any future results, performance or achievements expressed or implied by such forward-looking statements. Factors that may cause our actual results to differ materially from those contained in the forward-looking statements include, but are not limited to,  risks related to the ongoing hostilities in the Middle East; the impact of disruptions to global shipment and supply chain, including but not limited to increased risk and disruption around the Strait of Hormuz, and broader impacts on energy and freight markets; the continued demand  and future contribution of HBM and Chiplet applications and devices to the Company business resulting from, among other things, the field of AI surging worldwide across companies, industries and nations; formal or informal imposition by countries of new or revised export and/or import and doing-business regulations or sanctions, including but not limited to changes in U.S. trade policies, changes or uncertainty related to the U.S. government entity list and changes in the ability to sell products incorporating U.S originated technology, which can be made without prior notice, and our ability to effectively address such global trade issues and changes; risks related to fluctuations in foreign currency exchange rates; and those other factors discussed in our Annual Report on Form 20-F as published on March 19, 2026, as well as other documents filed by the Company with the SEC as well as other documents that may be subsequently filed by Camtek from time to time with the Securities and Exchange Commission. We caution you not to place undue reliance on forward-looking statements, which speak only as of the date hereof. Camtek does not assume any obligation to update any forward-looking statements in order to reflect events or circumstances that may arise after the date of this release unless required by law.

While we believe that we have a reasonable basis for each forward-looking statement contained in this press release, we caution you that these statements are based on a combination of facts and factors currently known by us and our projections of the future, about which we cannot be certain. In addition, any forward-looking statements represent Camtek’s views only as of the date of this press release and should not be relied upon as representing its views as of any subsequent date. Camtek does not assume any obligation to update any forward-looking statements unless required by law.

This press release provides financial measures that exclude: (i) share based compensation expenses; (ii) acquisition related expenses and (iii) one-time tax expenses and are therefore not calculated in accordance with generally accepted accounting principles (GAAP). Management believes that these non-GAAP financial measures provide meaningful supplemental information regarding our performance. The presentation of this non-GAAP financial information is not intended to be considered in isolation or as a substitute for the financial information prepared and presented in accordance with GAAP. Management uses both GAAP and non-GAAP measures when evaluating the business internally and therefore felt it is important to make these non-GAAP adjustments available to investors. A reconciliation between the GAAP and non-GAAP results appears in the tables at the end of this press release. The results reported in this press-release are preliminary unaudited results, and investors should be aware of possible discrepancies between these results and the audited results to be reported, due to various factors.


CAMTEK LTD. and its subsidiaries

Condensed Interim Consolidated Balance Sheets (Unaudited)

(In thousands)

June 30,

December 31,

2026

2025

U.S. Dollars

Assets

Current assets

Cash and cash equivalents

215,229

177,848

Short-term deposits

327,440

411,450

Marketable securities

87,695

78,862

Trade accounts receivable, net

153,921

90,829

Inventories

99,816

112,202

Other current assets

40,318

25,804

Total current assets

924,419

896,995

Marketable securities

185,473

182,941

Long-term inventory

16,979

15,569

Deferred tax asset, net

11,661

12,933

Other assets, net

1,802

1,881

Property, plant and equipment, net

59,359

55,090

Right of use assets, net

9,968

10,017

Intangible assets, net

16,654

10,062

Goodwill

112,737

74,345

    Total non-current assets

414,633

362,838

Total assets

1,339,052

1,259,833

Liabilities and shareholders’ equity

Current liabilities

Trade accounts payable

48,402

33,676

Other current liabilities

76,936

73,749

Total current liabilities

125,338

107,425

Long-term liabilities

Deferred tax liabilities, net

1,261

Other long-term liabilities

15,054

14,311

Convertible notes

488,497

519,833

    Total long-term liabilities

503,551

535,405

Total liabilities

628,889

642,830

Commitments and contingencies

Shareholders’ equity

Ordinary shares NIS 0.01 par value, 100,000,000 shares authorized at June 30,

2026 and at December 31, 2025;

48,760,553 issued shares at June 30, 2026 and 47,920,509 at December 31,

2025;

46,668,177 shares outstanding at June 30, 2026 and 45,828,133 at

December 31, 2025


181


178

Additional paid-in capital

272,741

231,892

Accumulated other comprehensive income (loss)

(2,355)

287

Retained earnings

441,494

386,544

712,061

618,901

Treasury stock, at cost (2,092,376 shares as of June 30, 2026 and December

31, 2025)


(1,898)


(1,898)

Total shareholders’ equity

710,163

617,003

Total liabilities and shareholders’ equity

1,339,052

1,259,833


CAMTEK LTD. and its subsidiaries

Condensed Interim Consolidated Statement of Income (unaudited)

(in thousands)


Six months ended

 June 30,


Three months

ended June 30,


Year ended

December 31,

2026

2025

2026

2025

2025

U.S. dollars

U.S. dollars

U.S. dollars

Revenues

254,902

241,955

133,243

123,317

496,072

Cost of revenues

127,271

118,780

66,541

60,706

245,755

Gross profit

127,631

123,175

66,702

62,611

250,317

Operating expenses:

Research and development

31,007

21,836

16,684

11,474

48,345

Selling, general and administrative

42,131

36,665

22,791

19,163

73,769

Total operating expenses

73,138

58,501

39,475

30,637

122,114

Operating income

54,493

64,674

27,227

31,974

128,203

Financial income, net

15,126

10,375

6,977

4,942

25,064

Other expenses

(100,932)

Income before income taxes

69,619

75,049

34,204

36,916

52,335

Income tax expense

(14,669)

(7,043)

(10,899)

(3,221)

(1,613)

Net income 

54,950

68,006

23,305

33,695

50,722


Earnings per share information:


Six months ended

 June 30,


Three months

ended June 30,


Year ended

December 31,

2026

2025

2026

2025

2025

U.S. dollars

U.S. dollars

U.S. dollars

Basic net earnings per share (in US dollars)

1.18

1.49

0.50

0.74

1.11

Diluted net earnings per share (in US dollars)

1.09

1.39

0.46

0.69

1.04

Weighted average number of

   ordinary shares outstanding:

Basic

46,496

45,622

46,643

45,682

45,703

Diluted

51,433

49,306

51,520

49,327

49,970


CAMTEK LTD. and its subsidiaries

Reconciliation of GAAP To Non-GAAP results

(In thousands, except share data)

Six Months ended

 June 30,

Three Months ended

 June 30,

Year ended

December 31,

2026

2025

2026

2025

2025

U.S. dollars

U.S. dollars

U.S. dollars

Reported net income attributable to Camtek Ltd. on GAAP basis


54,950


68,006


23,305


33,695


50,722

Acquisition-related expenses (1)

4,059

1,300

3,570

650

2,801

One-time Tax expenses

7,700

7,700

Loss from extinguishment of Capital Notes (2)


88,682

Share-based compensation

7,995

8,203

4,873

4,493

16,819

Non-GAAP net income

74,704

77,509

39,448

38,838

159,024

Non–GAAP net income per diluted share


1.48

1.57

0.78

0.79

3.26

Gross margin on GAAP basis

50.1 %

50.9 %

50.1 %

50.8 %

50.4 %

Reported gross profit on GAAP basis

127,631

123,175

66,702

62,611

250,317

Acquisition-related expenses (1)

1,707

1,220

1,097

610

2,895

Share-based compensation

1,139

1,344

687

763

2,806

Non- GAAP gross profit

130,477

125,739

68,486

63,984

256,018

Non-GAAP gross margin

51.2 %

52.0 %

51.4 %

51.9 %

51.6 %

Reported operating income attributable to Camtek Ltd. on GAAP basis


54,493


64,674


27,227


31,974


128,203

Acquisition-related expenses (1)

4,620

1,856

3,928

928

4,000

Share-based compensation

7,995

8,203

4,873

4,493

16,819

Non-GAAP operating income

67,108

74,733

36,028

37,395

149,022


(1)           During the six-month period ended June 30, 2026, the Company recorded acquisition-related expenses of $1.3 million, consisting of: (1) inventory written-up to fair value in purchase accounting charges of $0.5 million. This amount is recorded under cost of revenues line item. (2) $1.2 million amortization of intangible assets acquired recorded under cost of revenues line item. (3) $0.2 million of compensation-related expenses recorded under research and development expenses line item. (4) $0.1 million amortization of intangible assets acquired recorded under sales and marketing expenses line item. (5) $2.6 million one-time M&A expenses recorded under G&A line item. (6) $0.6 million reversal of tax provision related to the above adjustment, recorded under the tax expense line item.

                During the three-month period ended June 30, 2026, the Company recorded acquisition-related expenses of $0.8 million, consisting of: (1) inventory written-up to fair value in purchase accounting charges of $0.5 million. This amount is recorded under cost of revenues line item. (2) $0.6 million amortization of intangible assets acquired recorded under cost of revenues line item. (3) $0.2 million of compensation-related expenses recorded under research and development expenses line item. (4) $0.1 million amortization of intangible assets acquired recorded under sales and marketing expenses line item. (5) $2.6 million one-time M&A expenses recorded under G&A line item. (6) $0.4 million reversal of tax provision related to the above adjustment, recorded under the tax expense line item.

                  During the six-month period ended June 30, 2025, the Company recorded acquisition-related expenses of $1.3 million, consisting of: (1) $1.2 million amortization of intangible assets acquired recorded under cost of revenues line item. (2) $0.6 million amortization of intangible assets acquired recorded under sales and marketing expenses line item. (3) $0.6 million reversal of tax provision related to the above adjustment, recorded under the tax expense line item.

                  During the three-month period ended June 30, 2025, the Company recorded acquisition-related expenses of $0.6 million, consisting of: (1) $0.6 million amortization of intangible assets acquired recorded under cost of revenues line item. (2) $0.3 million amortization of intangible assets acquired recorded under sales and marketing expenses line item. (3) $0.3 million reversal of tax provision related to the above adjustment, recorded under the tax expense line item.

                  During the year ended December 31, 2025, the Company recorded acquisition-related expenses of $2.8 million, consisting of: (1) inventory written-up to fair value in purchase accounting charges of $0.5 million. This amount is recorded under cost of revenues line item. (2) $2.4 million amortization of intangible assets acquired recorded under cost of revenues line item. (3) $1.1 million amortization of intangible assets acquired recorded under sales and marketing expenses line item. (4) $1.2 million reversal of tax provision related to the above adjustment, recorded under the tax expense line item.

(2)           During the year ended December 31, 2025, the Company recorded a loss of $88.7 million, consisting of: (1) $100.9 million from the extinguishment of Capital Notes recorded under the other expenses line item.  (2) $12.3 million tax benefit recorded under the income tax benefit line item.


Camtek Ltd.
P.O.Box 544, Ramat Gabriel Industrial Park
Migdal Ha’Emek 23150, ISRAEL
Tel: +972 (4) 604-8100   
Fax: +972 (4) 644-0523
E-Mail: Info@camtek.com  
Web site: http://www.camtek.com

CAMTEK LTD.
Moshe Eisenberg, CFO
Tel: +972 4 604 8308
Mobile: +972 54 900 7100
moshee@camtek.com 

INTERNATIONAL INVESTOR RELATIONS  
EK Global Investor Relations
Ehud Helft
Tel: (US) 1 212 378 8040
camtek@ekgir.com 

Logo – https://mma.prnewswire.com/media/1534463/Camtek_logo.jpg


View original content:https://www.prnewswire.com/news-releases/camtek-announces-results-for-the-second-quarter-of-2026-302847042.html

SOURCE Camtek Ltd.

Continue Reading

Technology

Network Rail and CATALYST Complete Exploratory Pilot of Satellite-Enabled Risk Insights on the Wessex Route

Published

on

By

Innovative pilot project combined Earth Observation data, analytics derived from satellite imagery and weather forecasting to explore how flooding and vegetation risks could be identified earlier to improve inspection and decision-support.

LONDON, Aug. 10, 2026 /PRNewswire/ — Network Rail, the owner and operator of Britain’s railway infrastructure, and CATALYST (PCI Geomatics), a specialist in Earth Observation analytics, have completed an exploratory Pilot project that used satellite imagery, InSAR analytics and meteorological forecasting to investigate how weather-driven risks to rail infrastructure across the Wessex Route could be identified prior to an event.

The 12-week Pilot involved collaboration between Network Rail’s Wessex Route Operations and Resilience teams and CATALYST. The exploratory work produced a prototype for an Earth Observation [EO]-enabled decision-support solution that combines satellite-derived risk indicators with short-range weather forecasts. The solution explored how to provide visibility to respond to potential flooding and vegetation risk on a route up to three (3) days in advance of the forecasted weather.

Background

Britain’s rail network is increasingly exposed to climate-driven hazards. Extreme heat, prolonged rainfall and changing vegetation conditions are placing growing pressure on tracks, embankments and cuttings. This is particularly acute in regions where clay-rich geology, dense vegetation corridors and exposure to summer extremes combine to create a uniquely challenging operating environment.

The Project

The Pilot brought together Network Rail’s operational expertise on the Wessex Route, which spans the major commuter area of south-west London, with CATALYST’s advanced Earth Observation capabilities. The result is a prototype that fuses satellite optical and radar imagery and meteorological datasets to generate location-specific risk forecasts for three hazard classes: ground deformation, vegetation fall-in, and flooding.

The solution uses a two-part framework that distinguishes between persistent susceptibility and short-term weather-driven amplification. A baseline analysis quantifies the underlying vulnerability of each rail segment using 3-year archives of satellite imagery, LiDAR-derived vegetation height models and national flood and terrain datasets. A forecast layer then applies up to 3 days of meteorological forecasting (including cumulative rainfall, peak rainfall intensity and wind gusts) to highlight where conditions are likely to elevate risk on a given day.

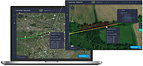
The solution also incorporated an interactive web-based dashboard with intuitive traffic-light classification, to produce results refreshed daily across three rail segments along the Wessex Route.

Benefits

Satellite-derived risk forecasts have the potential to materially improve the way Rail Operators anticipates and respond to weather-driven disruption.  In the Pilot, the prototype highlighted locations where flooding or vegetation risks could be elevated. Subject to further development and validation, these insights could complement existing inspection planning and resource prioritisation. The Pilot also explored when conditions deteriorate, information that could help route teams make more informed operational decisions, for example on routing, speed restrictions and vegetation clearance.

Early feedback from Network Rail operational users on the Wessex Route confirmed that the outputs were broadly consistent with known risk areas, with tree fall risk noted as a potentially valuable insight. Where vegetation assessments currently occur only every three years, a satellite-enabled approach could allow for more frequent, evidence-based monitoring, with the potential to support, supporting earlier identification of high-risk corridors and more efficient deployment of vegetation teams.

By demonstrating the methodology on one of Network Rail’s most climate-sensitive regions, the prototype could be scaled for Rail Operators on a network wide basis, adding additional hazard classes such as wildfire risk and autumn leaf-fall adhesion.

Quotes

“Network Rail supports the continued development of space-enabled technologies as part of a wider, complementary toolset for infrastructure risk management. This pilot has explored how satellite-derived datasets and weather information could give operational teams an earlier view of potential vegetation and flooding risks. We look forward to seeing how this type of capability continues to mature across the Earth Observation industry, with the potential to support more targeted inspections and interventions, reduce avoidable disruption, and continue to build resilience on climate-sensitive routes “
Thomas Desmond, Operations Director, Network Rail

“Rail infrastructure operates at the intersection of geology, vegetation and weather, and that is exactly where Earth Observation excels. By combining InSAR data, vegetation modelling and flood susceptibility data with short-range weather forecasts, we can provide richer, more timely insight: not just where the risk is, but how it is changing day to day. This Pilot is an important step towards demonstrating the potential of satellite analytics to support Rail Operators risk mitigation efforts.
June McAlarey, President & CEO, CATALYST (a PCI Geomatics brand)

Notes to Editors

About Network Rail
Network Rail owns, operates, maintains and develops the railway infrastructure in England, Scotland and Wales, including 20,000 miles of track, 30,000 bridges, tunnels and viaducts, and thousands of signals, level crossings and stations. Network Rail’s purpose is to connect people and goods with where they need to be, supporting the UK’s economic prosperity and contributing to the objectives of the UK and Scottish Governments. Its role is to run a safe, reliable and efficient rail network and to deliver a simpler, better, greener railway for customers and communities.

About CATALYST
CATALYST, a PCI Geomatics enterprise, delivers scalable business solutions using the power of Earth Observation data and AI-enabled analytics. With over 40 years of experience in image processing and data integration, CATALYST works with space agencies, satellite providers and commercial clients worldwide. CATALYST is the first commercial entity to offer CEOS-compliant analysis-ready data for both SAR and optical satellite imagery.

Media Contacts

CATALYST / PCI Geomatics: June McAlarey, mcalarey@catalyst.earth

View original content to download multimedia:https://www.prnewswire.com/news-releases/network-rail-and-catalyst-complete-exploratory-pilot-of-satellite-enabled-risk-insights-on-the-wessex-route-302846335.html

SOURCE CATALYST (PCI Geomatics)

Continue Reading

Trending