
Technology
i2Cool Expands Electricity-Free Cooling Portfolio as Europe Faces Intensifying Heatwaves

Published
2 hours agoon
By

New CorroCool coating extends passive radiative cooling technology to outdoor electrical cabinets, industrial equipment and metal infrastructure
HONG KONG, Aug. 28, 2026 /PRNewswire/ — Hong Kong climate technology company i2Cool has expanded its electricity-free cooling portfolio with the launch of CorroCool, a cooling and anti-corrosion coating developed for metal structures, outdoor electrical cabinets and industrial equipment.
The new product extends i2Cool’s passive radiative cooling technology beyond rooftops and windows into industrial and infrastructure applications, where prolonged solar exposure can raise surface and internal operating temperatures.
Together with the company’s existing electricity-free cooling coatings, membranes, window films and textiles, CorroCool forms part of a multi-surface cooling portfolio designed for buildings, infrastructure and everyday environments.
The launch comes as repeated heatwaves place growing pressure on buildings, public health and energy systems across Europe.
Europe’s Heatwaves Highlight a Growing Cooling Gap
Western Europe experienced an unusually early and intense heatwave between 21 and 30 May 2026. In parts of western France, England and Wales, daily average temperatures rose more than 10°C above seasonal norms, according to the Copernicus Climate Change Service.
The heat intensified in June, which became the hottest June recorded in Western Europe. High daytime and nighttime temperatures increased heat stress while preventing many buildings from releasing the heat accumulated during the day.
Europe’s existing building stock was largely designed to retain warmth. With air conditioning still absent from many homes and older buildings often difficult to retrofit, the region faces a growing need for cooling approaches that can complement mechanical air conditioning without placing further pressure on electricity systems.
Cooling Without Electricity or Refrigerants
i2Cool’s electricity-free cooling technology is based on passive radiative cooling. Its materials reflect incoming solar radiation while releasing thermal energy through the mid-infrared atmospheric window.
This allows treated surfaces to dissipate heat continuously without consuming electricity or using refrigerants.
Rather than replacing air conditioning, the technology can work alongside existing systems by reducing solar heat gain and lowering the cooling load placed on buildings and equipment. It can also provide passive thermal protection in locations where mechanical cooling is unavailable, impractical or too costly to operate continuously.
“Extreme heat is no longer limited to regions traditionally associated with hot climates,” said Prof. Martin Zhu, Co-founder and CEO of i2Cool. “As heatwaves become more frequent, cooling solutions must be accessible, energy-efficient and adaptable to existing buildings and infrastructure. Electricity-free cooling can become part of a broader heat-resilience strategy.”
From Rooftops and Windows to Industrial Infrastructure
i2Cool has developed its passive radiative cooling technology into materials for different surfaces and application environments:
Electricity-free cooling coatings and membranes can be applied to rooftops and external surfaces, supporting both new construction and existing-building retrofits.Electricity-free cooling film can be installed on windows, glass façades, skylights and sunrooms to reduce heat entering through glazing while retaining natural daylight.CorroCool cooling and anti-corrosion coating combines passive cooling with protection for metal structures, outdoor electrical cabinets and industrial equipment.Electricity-free cooling textiles extend the technology to awnings, tents, outdoor products, protective clothing and other everyday applications.
Across completed i2Cool projects, these solutions have delivered rooftop surface-temperature reductions of up to 42.9°C, indoor temperature reductions of up to 10°C and air-conditioning energy savings of up to 42%. Actual performance varies according to climate, building conditions and application type.
Supporting More Heat-Resilient Environments
The World Health Organization identifies heat stress as the leading cause of climate-related death in its European Region, which is warming at approximately twice the global average rate.
Responding to rising temperatures will require a combination of heat-warning systems, public cooling spaces, improved ventilation, shading, insulation, efficient air conditioning and passive cooling materials.
By reducing heat gain directly at exposed surfaces, electricity-free cooling can help improve thermal comfort, protect temperature-sensitive infrastructure and reduce the additional electricity demand created by more frequent extreme heat.
Through the expansion of its product portfolio, i2Cool aims to make passive cooling applicable across a wider range of buildings, industrial facilities and everyday environments.
About i2Cool
i2Cool is an energy-saving new materials company specialising in electricity-free cooling technology. Inspired by nature, the company develops passive radiative cooling materials and solutions for buildings, industrial facilities, transportation and everyday applications.
Its technologies are designed to provide continuous cooling without electricity or refrigerants, helping reduce energy consumption and carbon emissions.
Media Contact
i2Cool Limited
Email: pr@i2cool.com
Website: www.i2cool.com
View original content to download multimedia:https://www.prnewswire.com/news-releases/i2cool-expands-electricity-free-cooling-portfolio-as-europe-faces-intensifying-heatwaves-302862621.html
SOURCE i2Cool

You may like
Technology
Huasun Expands Southeast Asia Footprint with 13.7MW Himalaya PLUS Module Supply for Myanmar Project
Published
39 minutes agoon
August 28, 2026By

XUANCHENG, China, Aug. 28, 2026 /PRNewswire/ — Anhui Huasun Energy Co., Ltd. (“Huasun”) has secured a new overseas order, supplying 13.7MW of its flagship Himalaya PLUS HJT modules for a photovoltaic project in Thaton, Myanmar, with full delivery scheduled for late August 2026. The deal marks the continuous large-scale overseas deployment of Huasun’s flagship new product, further strengthening the company’s layout in Southeast Asia’s new energy market.
Awarded by HB Vantage, the project selects Himalaya PLUS modules for their superior performance and outstanding outdoor adaptability, supporting the efficient construction of local clean energy projects.
Endowed with abundant solar resources, Myanmar boasts huge photovoltaic development potential. Its year-round high-temperature tropical environment sets stringent standards for module efficiency, stability and durability, making high-performance solar modules the preferred choice for local projects. As Huasun’s flagship new product, Himalaya PLUS features ultra-high power output and HJT’s ultra-low temperature coefficient, delivering superior power generation performance in high-temperature conditions and perfectly adapting to Southeast Asia’s tropical outdoor scenarios to guarantee stable project returns.
This 13.7MW Myanmar project represents another key overseas breakthrough of Himalaya PLUS, fully verifying the product’s strong adaptability to complex Southeast Asian working conditions. Moving forward, Huasun will further explore emerging Southeast Asian markets and empower global clean energy transition with high-efficiency, high-reliability HJT solar solutions.
View original content to download multimedia:https://www.prnewswire.com/apac/news-releases/huasun-expands-southeast-asia-footprint-with-13-7mw-himalaya-plus-module-supply-for-myanmar-project-302862649.html
SOURCE Anhui Huasun Energy Co., Ltd.
Technology
xTool Introduces X1, a Next-Gen All-in-One Laser Platform Built for Speed, Scale, and Versatility
Published
39 minutes agoon
August 28, 2026By
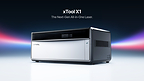
All the Best Lasers, Built into One: xTool X1 combines high-speed engraving, large-format cutting, and expandable multi-laser technology into a single desktop system.
MOUNTAIN VIEW, Calif., Aug. 28, 2026 /PRNewswire/ — xTool, a global pioneer in digital fabrication and smart desktop manufacturing, officially kicked off its X1 Global Tech Launch today with the debut of its next-generation all-in-one laser platform, the xTool X1. Alongside the flagship technology release, xTool also hosted its inaugural Small and Medium Businesses (SMB) Summit, bringing together industry experts, commercial creators, and microbusiness owners to chart the future of smart crafting and enterprise desktop fabrication.
The Next-Gen All-in-One Laser: xTool X1 Global Tech Launch
For years, digital fabrication has been bottlenecked by hardware fragmentation. Makers and growing businesses faced a compounding challenge: high-speed engraving required specialized galvo systems, large-format processing demanded gantry architectures, and working with varied materials mandated investing in separate diode, CO₂, fiber, or UV machines. Expanding creative or commercial capabilities inevitably meant inflating studio footprints and equipment budgets.
xTool developed the X1 to bring these capabilities together in a single platform. Built around the core philosophy of “All the Best Lasers, Built into One,” the xTool X1 unifies speed, wide-format capacity, high-power cutting, and modular laser expansion within a single, future-proof chassis. Designed specifically for ambitious makers, laser enthusiasts, and scaling storefront sellers on platforms like Etsy and Shopify, the X1 marks an industry transition from single-purpose tools to a dynamic, evolving manufacturing hub.
Key Technologies Powering the xTool X1
1. Hybrid Motion™ (Four-Axis Coordinated System)
By synchronizing traditional gantry movement with high-speed galvo scanning into a unified four-axis motion architecture, Hybrid Motion™ bridges the long-standing gap between processing speed and workspace scale. Housing a baseline 55W CO₂ laser head alongside a galvo head integrated with a 20W diode laser, the flying-galvo system achieves industrial processing speeds of up to 6,000 mm/s across a wide-format working area. Users no longer have to compromise between ultra-fast detailed engraving and large-format cutting on a single machine.
2. Laser Swap™ (Modular Multi-Laser Expansion)
Addressing material versatility, Laser Swap™ precisely routes expandable laser sources through a shared optical path into a centralized galvo head. Beyond its core CO₂ and built-in diode capabilities, the X1 platform natively supports modular upgrades to 30W Fiber, 60W MOPA, and 5W UV modules—as well as future laser innovations. This modularity allows scaling businesses to endlessly expand material compatibility without purchasing secondary machines or managing redundant software workflows.
3. UniCast Frame (Automotive-Grade Structural Rigidity)
To support the dynamic stresses of high-speed four-axis motion and dual flying optical paths, xTool engineered the UniCast Frame using 4,000-ton high-pressure die casting. Fabricated from automotive-grade aluminum alloy, the design replaces nearly 100 traditional assembled parts and over 268 screws with just three monolithic die-cast structures. This structural innovation minimizes assembly tolerances, ensuring long-term precision, thermal stability, and operational durability under continuous enterprise use.
SMB Summit: AI Empowerment, Connected Ecosystems & Commercial Scaling
Extending xTool’s vision from hardware innovation to commercial empowerment, the inaugural SMB Summit examined how creators and small businesses scale within xTool’s broader Connected Creation Ecosystem. The summit opened with a keynote from xTool US General Manager Stein, who highlighted the brand’s rapid commercial growth—underpinned by the recently launched xTool O1 Omni Printer, which generated over $20 million in revenue with 6,000+ units sold on day one.
Stein emphasized how xTool’s signature AI creation suite, Atomm, serves as the intelligent digital engine across its hardware portfolio, driving seamless cross-device synergy across printing, engraving, cutting, and textile decoration. Built around the principle of “From Ideas to Ready-to-Make Files,” Atomm turns natural language prompts and photos into production-ready designs with automated Material Lab parameters and real-time mockup previews (“What You See Is What You Make”)—significantly reducing material waste and trial-and-error costs for SMBs. This cross-device synergy was demonstrated live through an integrated workflow pairing the xTool Selected Embroidery & Sewing Machine SE1 directly with the xTool O1 Omni Printer.
Further bridging technology and business expansion, the summit hosted keynotes from three small business owners detailing operational scaling strategies. The session culminated in a panel discussion titled “Empowering Modern Makers: Tools, Monetization, and Possibilities,” moderated by Vincent Nguyen, Editor-in-Chief and Co-Owner of The Gadgeteer, examining creator-led monetization models and real-world smart tool adoption.
Vision: Laser Will Converge. Creation Will Expand.
The xTool X1 represents more than a standalone hardware reveal; it signifies an industry shift toward converged creation platforms. xTool believes the future of desktop fabrication relies not on proliferating specialized machines, but on unifying multi-laser capabilities, intelligent AI design software, and end-to-end hardware ecosystems into one platform. Great engineering removes limitations so creation can expand.
To connect with early adopters and explore complete technical specifications, join the official xTool X1 Facebook Community.
About xTool
xTool is a global premium consumer-tech brand dedicated to empowering digital-to-physical creation. As the world’s largest and fastest-growing laser engraver innovator, xTool provides a comprehensive ecosystem of laser-based personal creative tools, material printers, user-friendly software, accessories, and consumables. Through these innovations, xTool empowers creators to turn imagination into meaningful creations that deliver emotional fulfillment, commercial success, and personal achievement. Discover more at xtool.com.
View original content to download multimedia:https://www.prnewswire.com/news-releases/xtool-introduces-x1-a-next-gen-all-in-one-laser-platform-built-for-speed-scale-and-versatility-302862656.html
SOURCE xTool
Technology
MINISO Group Announces 2026 June Quarter and Interim Unaudited Financial Results
Published
39 minutes agoon
August 28, 2026By

Group Revenue Grew by 22.4% YoY in 26H1
MINISO Chinese Mainland Delivered 26.2% YoY Growth, the Highest First-half Growth Rate in Three Years, Powered by Mid-single Digit SSSG(1)
MINISO North America Delivered 37.0% YoY Revenue Growth, with Mid-single Digit SSSG(1)
Diluted Earnings Per ADS Grew by 8.2% YoY
Net Cash from Operating Activities Grew by 45.5% YoY
26H1 Returned RMB1,309.8 Million to Shareholders, Surpassing Adjusted Net Profit(2) Excluding FX(3)
GUANGZHOU, China, Aug. 28, 2026 /PRNewswire/ — MINISO Group Holding Limited (NYSE: MNSO; HKEX: 9896) (“MINISO”, “MINISO Group” or the “Company”), a global high-growth value retailer offering a variety of trendy lifestyle products featuring distinctive IP designs, today announced its unaudited financial results for the three months and six months ended June 30, 2026 (“26Q2” and “26H1”, respectively).
26H1 Selected Financial Information
Item
For the six months ended June 30,
Year-over-
year
(“YoY”)
change
2025
2026
(Unaudited)
(Unaudited)
RMB million
RMB million
US$ million
Revenue
9,393.1
11,498.9
1,694.7
22.4 %
Gross profit
4,156.9
5,093.7
750.7
22.5 %
Operating profit
1,545.9
1,639.9
241.7
6.1 %
Adjusted operating profit(2)
excluding FX(3)
1,550.8
1,628.6
240.0
5.0 %
Profit for the period
906.0
956.6
141.0
5.6 %
Earnings per American
Depositary Share (“ADS”)
-Basic earnings per ADS
(RMB and US$)
2.96
3.16
0.47
6.8 %
-Diluted earnings per
ADS (RMB and US$)
2.92
3.16
0.47
8.2 %
Adjusted net profit(2)
excluding FX(3)
1,242.9
1,221.6
180.0
(1.7 %)
Adjusted EBITDA(2)
2,187.6
2,255.5
332.4
3.1 %
Net cash from operating
activities
1,014.2
1,475.4
217.4
45.5 %
Store Network Expansion
As of June 30, 2026, the Company’s total store count reached 8,674, representing a net increase of 769 YoY and 189 YTD(4).
MINISO Brand: totaled 8,309 stores (up 697 YoY and 158 YTD(4)), driven by:Chinese Mainland: 4,665 stores (up 360 YoY and 97 YTD(4)).Overseas Markets: 3,644 stores (up 337 YoY and 61 YTD(4)).TOP TOY Brand: totaled 365 stores (up 72 YoY and 31 YTD(4)).
The following table provides a breakdown of the Company’s store network and its changes on a YoY and YTD(4) basis. About 48.4% of new MINISO stores in the past twelve months were located in overseas markets.
As of
June 30,
2025
December 31,
2025
June 30,
2026
YoY
YTD(4)
Number of stores on group level
7,905
8,485
8,674
769
189
Number of MINISO stores
7,612
8,151
8,309
697
158
Chinese mainland
4,305
4,568
4,665
360
97
— Directly operated stores
20
18
15
(5)
(3)
— Stores operated under Retail
Partner model
4,258
4,522
4,624
366
102
— Stores operated under
distributor model
27
28
26
(1)
(2)
Overseas markets
3,307
3,583
3,644
337
61
— Directly operated stores
579
700
795
216
95
— Stores operated under Retail
Partner model
425
432
439
14
7
— Stores operated under
distributor model
2,303
2,451
2,410
107
(41)
Number of TOP TOY stores
293
334
365
72
31
Chinese mainland
283
304
317
34
13
— Directly operated stores
33
35
33
–
(2)
— Stores operated under Retail
Partner model
250
269
284
34
15
Overseas markets
10
30
48
38
18
— Directly operated stores
5
15
30
25
15
— Stores operated under Retail
Partner model
–
4
4
4
–
— Stores operated under
distributor model
5
11
14
9
3
Mr. Guofu Ye, Founder, Chairman and CEO of MINISO, commented, “Despite a challenging consumer environment in the domestic market during 26H1, we are pleased to see that MINISO Chinese mainland delivered a standout performance, with revenue growing 26.2% YoY, our fastest first-half growth rate in the past three years, driven by mid-single-digit SSSG. MINISO overseas markets grew 14.9% YoY, while TOP TOY grew 32.7% YoY.”
“Beyond the financial performance, we would also like to share our progress on proprietary IP and membership operations. YOYO, launched just one year ago, achieved monthly sales exceeding RMB100 million in both June and July 2026 and completed its first crossover collaboration with a world-class IP, evolving into an IP asset capable of engaging and co-creating with international IPs on equal footing. Members of MINISO Chinese mainland grew 31.0% YoY to about 130 million, contributing 77.4% of local sales; in the United States, our members grew 107.1% YoY to about 5.8 million, contributing 60.1% of local sales. Our membership program highlighted strong user retention, cementing the foundation for sustainable commercialization and long-term brand equity. On the global front, we celebrated our market entry into Switzerland in 26Q2, extending our global footprint to accumulative 113 countries and regions, while TOP TOY officially entered the United States and Taiwan, China, further elevating its global presence.”
“Moving forward, MINISO will keep focusing on its dual drivers: IP and large-format stores. We aim to unlock deep brand equity via our IP ecosystem and reshape retail experiences through large-format stores. Guided by long-termism, we balance global expansion with high-quality localization. Powered by operational resilience, MINISO will create enduring, cycle-defying value for global stakeholders.” Mr. Ye continued.
Mr. Eason Zhang, CFO of MINISO, commented, “During 26H1, revenue on group level grew by 22.4%. Adjusted operating profit excluding FX grew 5.0% YoY to RMB1,628.6 million. Net cash generated from operating activities reached RMB1,475.4 million, while adjusted net profit excluding FX was RMB1,221.6 million in the same period, demonstrating strong resilience and robust operational cash flow generation of our business.”
“Our capital allocation initiatives were highlighted by share repurchase of RMB517.6 million deployed by the Company in 26H1, accounting for more than 90% of full-year repurchase amount of 2025. Furthermore, in June 2026, the Board approved 2026 share repurchase program of up to HK$2.0 billion, alongside an automatic share repurchase plan, enabling continued buyback execution even during blackout periods across both Hong Kong and the U.S. markets, underscoring our disciplined capital deployment, and reaffirmed our unwavering confidence in MINISO Group’s intrinsic value.
We have returned a total of RMB1.31 billion to shareholders by cash dividends and share repurchases, accounting for 121% of the adjusted net profit for 26H1, which far exceeded the 50% payout ratio per our current dividend policy. Looking ahead, our capital allocation strategy will continue to balance our high-growth trajectory with our commitment to delivering stable, predictable returns to our shareholders.” Mr. Zhang concluded.
Financial Results for 26H1
Revenue was RMB11,498.9 million (US$1,694.7 million), representing an increase of 22.4% YoY.
Revenue from MINISO brand increased by 21.6% YoY to RMB10,513.2 million (US$1,549.5 million), mainly driven by (i) an increase of 26.2% in revenue from Chinese mainland, powered by its mid-single digit SSSG(1), and (ii) an increase of 14.9% in revenue from overseas markets, with low-single-digit decline in same-store GMV. Overseas markets revenue contributed 38.6% of revenue from MINISO brand, compared to 40.9% in the same period last year.
Revenue from TOP TOY brand(5) increased by 32.7% YoY to RMB984.6 million (US$145.1 million).
For more information on the composition and YoY change of revenue, please refer to the “Unaudited Additional Information” in this press release.
Cost of sales was RMB6,405.2 million (US$944.0 million), representing an increase of 22.3% YoY.
Gross profit was RMB5,093.7 million (US$750.7 million), representing an increase of 22.5% YoY.
Gross margin was 44.3%, flat year over year. The current-period margin included a benefit of about 0.6% from tariff refunds. The Company estimated more benefit in the coming quarters of about US$4.1 million.
Selling and distribution (“S&D”) expenses were RMB3,045.0 million (US$448.8 million), representing an increase of 39.6% YoY. Excluding share-based compensation (“SBC”) expenses, S&D expenses were RMB2,961.5 million (US$436.5 million), representing an increase of 36.7% YoY.
As a percentage of revenue, S&D expenses excluding SBC stood at 25.8% in 26H1, compared with 23.1% in the same period last year. This 2.7‑percentage‑point YoY increase was the main driver for the corresponding YoY decline in adjusted net profit margin excluding FX(3).
The YoY expenses increase as percentages of revenue were broken down as follows: a 1.0‑percentage‑point rise in depreciation and amortization and rental expenses for directly‑operated stores; a 0.5‑percentage‑point uptick in promotion and advertising expenses; a 0.5‑percentage‑point increase in licensing expenses, reflecting the Company’s strategic investments in IP development to build foundations for future growth; and an approximate 0.4‑percentage‑point increase in payroll expenses excluding SBC, largely attributable to overseas operations. Logistics expenses as a percentage of revenue remained stable at around 1.7%, flat YoY.
General and administrative expenses were RMB590.9 million (US$87.1 million), representing an increase of 17.3% YoY. Excluding SBC expenses, general and administrative expenses were RMB550.8 million (US$81.2 million), representing an increase of 15.5% YoY. The YoY increase was primarily due to the increase in personnel-related expenses in relation to the growth of the Company’s business.
Other net income was RMB196.7 million (US$29.0 million), compared to RMB98.2 million in the same period last year. The YoY increase was mainly due to an unrealized mark-to-market gain of RMB277.4 million (US$40.9 million) arising from fair value changes of an investment in a limited partnership, reflecting its early stage strategic pre-IPO investment in the AI industry. This was partially offset by a net foreign exchange loss of RMB142.4 million (US$21.0 million), compared to a net foreign exchange gain of RMB36.6 million in the same period last year.
Operating profit increased by 6.1% YoY to RMB1,639.9 million (US$241.7 million), compared with RMB1,545.9 million in the same period last year.
Operating margin was 14.3%, compared with 16.5% in the same period last year.
Adjusted operating profit(2) was RMB1,486.2 million (US$219.0 million), compared with RMB1,587.4 million in the same period last year. If excluding FX(3), it would have been RMB1,628.6 million (US$240.0 million), representing an increase of 5.0% YoY.
Adjusted operating margin(2) was 12.9%, compared with 16.9% in the same period last year. If excluding FX(3), it would have been 14.2%.
Net finance costs were RMB212.0 million (US$31.2 million), compared to RMB128.4 million in the same period last year. The YoY change was mainly attributable to the decrease in interest income as a result of decreased principal in bank deposit, and increased finance costs. The increase in finance costs was mainly due to (i) increased interest expenses on lease liabilities in line with the Company’s investment in directly operated stores; (ii) increased interest expenses in relation to the equity linked securities issued by the Company in 2025 (the “Equity Linked Securities”), and (iii) increased interest expenses mainly attributable to a borrowing in connection with the acquisition of the equity interest in Yonghui Superstores Co., Ltd * (永輝超市股份有限公司) (“Yonghui”). Both (ii) and (iii) are excluded in non-IFRS financial measures(2) and the increases were driven by the full-period recognition of interest in 26H1 versus a pro-rated portion in the prior-year period.
Share of profit of equity-accounted investees, net of tax was RMB57.8 million (US$8.5 million), compared to a share of loss of RMB138.9 million in the same period last year. The YoY improvement was primarily attributable to the Company’s share of profit in Yonghui of RMB60.3 million (US$8.9 million), compared to a share of loss in the prior-year period. This reflected Yonghui’s return to profitability in 26H1, driven by its ongoing store-remodeling program, strengthened private-label merchandise portfolio, and improved gross margin and operating expense discipline, as disclosed in Yonghui’s 2026 interim report. The share of profit in Yonghui has been excluded in the Company’s non-IFRS financial measures(2), as it relates to the operating results of an associated company rather than the underlying performance of MINISO’s own business.
Changes in fair value of redemption liabilities were RMB47.4 million (US$7.0 million), which was a non-cash loss arising from preferred shares issued by TOP TOY in connection with its strategic financing in 2025 and has been excluded in non-IFRS financial measures(2).
Other expenses were RMB141.3 million (US$20.8 million), representing a non-cash loss from fair value change of certain derivative under mark-to-market impact, which was in relation to the Equity Linked Securities and has been excluded in non-IFRS financial measures(2).
Effective tax rate was 26.2%, compared to 24.1% in the same period last year.
Adjusted effective tax rate(2) was 24.8%, which excluded the impact on effective tax rate as a result of adjusted items, compared to 18.4% in the same period last year. The YoY increase mainly reflected the tax effect of net foreign exchange loss and loss from certain subsidiaries of the Company.
Profit for the period increased 5.6% YoY to RMB956.6 million (US$141.0 million), compared to RMB906.0 million in the same period last year. The YoY increase was primarily attributable to the following factors: (i) the unrealized mark-to-market gain of RMB277.4 million (US$40.9 million) from fair value changes of an investment in a limited partnership investing in the AI industry, and (ii) RMB60.3 million (US$8.9 million) share of profit from its investment in Yonghui. Such positive contributions were partially offset by the following factors: (i) higher S&D expenses compared with the prior-year period, (ii) net foreign exchange loss of RMB142.4 million (US$21.0 million), reversing the net foreign exchange gain of RMB36.6 million recorded in the same period last year, (iii) increased net finance costs explained above, and (iv) a loss arising from changes in fair value of redemption liabilities arising from preferred shares issued by TOP TOY in connection with its strategic financing in 2025.
Net profit margin was 8.3%, compared to 9.6% in the same period last year.
Adjusted net profit(2) was RMB1,079.1 million (US$159.0 million), compared to RMB1,279.5 million in the same period last year. If excluding FX(3), it would have been RMB1,221.6 million (US$180.0 million), compared to RMB1,242.9 million in the same period last year.
Adjusted net margin(2) was 9.4%, compared to 13.6% in the same period last year. If excluding FX(3), it would have been 10.6%, compared to 13.2% in the same period last year.
Adjusted EBITDA(2) increased by 3.1% YoY to RMB2,255.5 million (US$332.4 million).
Adjusted EBITDA margin(2) was 19.6%, compared to 23.3% in the same period last year.
Basic earnings per ADS was RMB3.16 (US$0.47), compared to RMB2.96 in the same period last year, representing an increase of 6.8% YoY.
Diluted earnings per ADS was RMB3.16 (US$0.47), compared to RMB2.92 in the same period last year, representing an increase of 8.2% YoY.
Adjusted basic and diluted earnings per ADS(2) were both RMB3.56 (US$0.52), compared to both RMB4.16 in the same period last year.
Cash position(6), which was the combined balance of the Company’s cash and cash equivalents, restricted cash, term deposits and other investments recorded as current assets, was RMB7,394.2 million (US$1,089.8 million) as of June 30, 2026, compared to RMB7,087.9 million as of December 31, 2025.
Net cash from operating activities was RMB1,475.4 million (US$217.4 million) for 26H1, with a cash conversion ratio(7) of 1.4. Capital expenditure was RMB724.6 million (US$106.8 million) and free cash flow was RMB750.8 million (US$110.6 million).
Financial Results for 26Q2
Revenue was RMB5,810.5 million (US$856.4 million), representing an increase of 17.0% YoY.
Revenue from MINISO brand increased by 17.0% to RMB5,339.8 million (US$787.0 million), driven by (i) an increase of 22.9% in Chinese mainland, and (ii) an increase of 9.1% in overseas markets.
Revenue from TOP TOY brand(5) increased by 16.9% to RMB470.1 million (US$69.3 million).
For more information on the composition and YoY change of revenue, please refer to the “Unaudited Additional Information” in this press release.
Cost of sales was RMB3,180.9 million (US$468.8 million), representing an increase of 14.9% YoY.
Gross profit was RMB2,629.6 million (US$387.6 million), representing an increase of 19.6% YoY.
Gross margin was 45.3%, compared to 44.3% in the same period last year. The current-period margin included a benefit of about 1.2% from tariff refunds in 26Q2.
S&D expenses were RMB1,574.1 million (US$232.0 million), representing an increase of 35.7% YoY. Excluding SBC expenses, S&D expenses were RMB1,566.8 million (US$230.9 million), representing an increase of 35.7% YoY.
As a percentage of revenue, S&D expenses excluding SBC stood at 27.0% in 26Q2, compared with 23.2% in the same period last year. This 3.8-percentage-point YoY increase was the main driver for the corresponding YoY decline in adjusted net profit margin excluding FX(3).
General and administrative expenses were RMB293.7 million (US$43.3 million), representing an increase of 12.3% YoY. Excluding SBC expenses, general and administrative expenses were RMB286.0 million (US$42.2 million), representing an increase of 13.7% YoY.
Other net loss was RMB625.2 million (US$92.1 million), compared to an income of RMB77.4 million in the same period last year. The YoY change was mainly due to (i) an unrealized mark-to-market loss of RMB597.2 million (US$88.0 million) arising from fair value changes of an investment in a limited partnership, reflecting its early stage strategic pre-IPO investment in the AI industry, and (ii) a net foreign exchange loss of RMB59.9 million (US$8.8 million), compared with a net exchange gain of RMB35.0 million in the same period last year.
Operating profit was RMB118.5 million (US$17.5 million), compared with RMB836.2 million in the same period last year. The decrease in operating profit was mainly due to (i) an unrealized mark-to-market loss of RMB597.2 million (US$88.0 million) from fair value changes of an investment in a limited partnership investing in the AI industry, (ii) increased S&D expenses, and (iii) net foreign exchange loss of RMB59.9 million (US$8.8 million), compared to the net foreign exchange gain of RMB35.0 million in the same period last year.
Operating margin was 2.0%, compared with 16.8% in the same period last year.
Adjusted operating profit(2) was RMB730.7 million (US$107.7 million), compared with RMB852.6 million in the same period last year. If excluding FX, it would have been RMB790.6 million (US$116.5 million), representing a decrease of 3.3% YoY.
Adjusted operating margin(2) was 12.6%, compared with 17.2% in the same period last year. If excluding FX, it would have been 13.6%, compared to 16.5% in the same period last year.
Net finance costs were RMB108.0 million (US$15.9 million), compared to RMB79.4 million in the same period last year.
Share of loss of equity-accounted investees, net of tax was RMB20.4 million (US$3.0 million), compared to RMB136.9 million in the same period last year.
Changes in fair value of redemption liabilities were RMB25.9 million (US$3.8 million), which was a non-cash loss arising from preferred shares issued by TOP TOY in connection with its strategic financing in 2025 and has been excluded in non-IFRS financial measures(2).
Other expenses were RMB90.5 million (US$13.3 million), including a non-cash loss from fair value changes of certain derivative under mark-to-market impact, which was in relation to the Equity Linked Securities and has been excluded in non-IFRS financial measures(2).
Effective tax rate was negative 130.8%, compared to 21.9% in the same period last year. The negative effective tax rate for 26Q2 was driven by the consolidated pre-tax loss, which was primarily impacted by share of loss in Yonghui and an unrealized mark-to-market loss from fair value changes of an investment in a limited partnership investing in the AI industry, while income tax expense was recognized on profitable taxable entities within MINISO Group.
Adjusted effective tax rate(2) was 24.7%, which excluded the impact on effective tax rate as a result of adjusted items, compared to 16.5% in the same period last year. The YoY increase mainly reflected the tax effect of net foreign exchange loss and loss from certain subsidiaries of the Company.
Loss for the period was RMB291.5 million (US$43.0 million), compared to a profit for the period of RMB489.5 million in the same period last year. The loss for the period was mainly attributable to (i) the change in operating profit explained above, and (ii) other expenses of RMB90.5 million (US$13.3 million), compared to other gain of RMB6.7 million in the same period last year, partially offset by the decrease in share of loss in Yonghui.
Net loss margin was 5.0%, compared with a net profit margin of 9.9% in the same period last year.
Adjusted net profit(2) was RMB528.6 million (US$77.9 million), compared to RMB692.3 million in the same period last year. If excluding FX(3), it would have been RMB588.4 million (US$86.7 million), compared to RMB657.3 million in the same period last year.
Adjusted net margin(2) was 9.1%, compared to 13.9% in the same period last year. If excluding FX(3), it would have been 10.1%, compared to 13.2% in the same period last year.
Adjusted EBITDA(2) was RMB1,149.8 million (US$169.5 million), flat YoY.
Adjusted EBITDA margin(2) was 19.8%, compared to 23.2% in the same period last year.
Basic and diluted loss per ADS were both RMB0.96 (US$0.14), compared to both basic and diluted earnings per ADS of RMB1.60 in the same period last year.
Adjusted basic and diluted earnings per ADS(2) were both RMB1.76 (US$0.26), compared to RMB2.24 in the same period last year.
Net cash from operating activities was RMB1,110.2 million (US$163.6 million) for 26Q2, with a cash conversion ratio(7) of 2.1. Capital expenditure was RMB454.0 million (US$66.9 million) and free cash flow was RMB656.2 million (US$96.7 million).
Notes:
“SSSG” refers to the YoY growth of same-store GMV. For overseas markets, to exclude impact from foreign currency fluctuation, such growth is calculated by translating current period same-store GMV in foreign currencies using the prior year’s monthly average exchange rates. Same-store GMV represents GMV generated by those MINISO stores that had been open for at least 15 months prior to the beginning of the relevant comparative period and were in normal operating status as of the end of each such period.See the sections titled “Non-IFRS Financial Measures” and “Reconciliation of Non-IFRS Financial Measures” in this press release for more information.”FX” refers to net foreign exchange gain or loss for the periods.”YTD” refers to the six months ended June 30, 2026.Revenue from TOP TOY brand only represents revenue generated from external parties”Cash position” refers to the combined balance of the Company’s cash and cash equivalents, restricted cash, term deposits with original maturity over three months, and other investments recorded as current assets.”Cash conversion ratio” refers to the ratio of net cash from operating activities divided by adjusted net profit for the period.
Conference Call
The Company’s management will hold an earnings conference call at 5:00 A.M. Eastern Time on Friday, August 28, 2026 (5:00 P.M. Beijing Time on the same day) to discuss the financial results. Simultaneous interpretation in English will be provided during the conference call. The conference call can be accessed by the following Zoom link or dialing the following numbers:
Access 1
Join Zoom meeting.
Zoom link: https://zoom.us/j/92213968231?pwd=6BiFT3ctp5uUiNjunNOPuKtKIadH7g.1
Meeting Number: 922 1396 8231
Meeting Passcode: 9896
Access 2
Listeners may access the call by dialing the following numbers and using the same meeting number and passcode as access 1.
United States:
+1 689 278 1000 (or +1 719 359 4580)
Hong Kong, China:
+852 5803 3730 (or +852 5803 3731)
United Kingdom:
+44 203 481 5237 (or +44 131 460 1196)
France:
+33 1 7037 9729 (or +33 1 7037 2246)
Singapore:
+65 3158 7288 (or +65 3165 1065)
Canada:
+1 438 809 7799 (or +1 204 272 7920)
Access 3
Listeners can also access the meeting through the Company’s investor relations website at https://ir.miniso.com/.
The replay will be available approximately two hours after the conclusion of the live event at the Company’s investor relations website at https://ir.miniso.com/.
About MINISO Group
MINISO Group is a global high-growth value retailer offering a variety of trendy lifestyle products featuring distinctive IP designs. Since opening our first store in Chinese mainland in 2013, the Company has successfully built two brands – “MINISO” and “TOP TOY”. The Company’s flagship brand “MINISO” has grown into a globally recognized retail brand that offers a frequently-refreshed assortment of lifestyle products through an extensive store network worldwide. The Company’s products cover diverse consumer needs and consumers are drawn to MINISO for our products’ trendiness, creativeness, high quality and affordability. For more information, please visit https://ir.miniso.com/.
Exchange Rate
The U.S. dollar (US$) amounts disclosed in this press release, except for those transaction amounts that were actually settled in U.S. dollars, are presented solely for the convenience of the readers. The conversion of Renminbi (RMB) into US$ in this press release is based on the exchange rate set forth in the H.10 statistical release of the Board of Governors of the Federal Reserve System as of June 30, 2026, which was RMB6.7851 to US$1.0000. The percentages stated in this press release are calculated based on the RMB amounts.
Non-IFRS Financial Measures
In evaluating the business, MINISO considers and uses adjusted operating profit, adjusted operating margin, adjusted effective tax rate, adjusted net profit, adjusted net margin, adjusted EBITDA, adjusted EBITDA margin, adjusted basic and diluted net earnings per share and adjusted basic and diluted net earnings per ADS as supplemental measures to review and assess its core business performance. The presentation of these non-IFRS financial measures is not intended to be considered in isolation or as a substitute for the financial information prepared and presented in accordance with IFRS. MINISO defines adjusted operating profit as operating profit for the period excluding (i) equity-settled share-based payment expenses and (ii) gain or loss from fair value changes of an investment in a limited partnership investing in the AI industry. MINISO calculates adjusted operating margin by dividing adjusted operating profit by revenue for the same period. MINISO defines adjusted effective tax rate as the effective tax rate excluding the tax impact of adjusted items, under non-IFRS financial measures. MINISO defines adjusted net profit as profit for the period excluding (i) equity-settled share-based payment expenses, (ii) gain or loss from fair value change of derivatives, (iii) issuance cost of derivatives, (iv) interest expenses related to the Equity Linked Securities and interest expenses related to the bank loans used for acquisition of the equity interest in Yonghui, (v) share of profit or loss of Yonghui, net of tax, (vi) changes in fair value of redemption liabilities arising from preferred shares, and (vii) gain or loss from fair value changes of an investment in a limited partnership investing in the AI industry. MINISO calculates adjusted net margin by dividing adjusted net profit by revenue for the same period. MINISO defines adjusted EBITDA as adjusted net profit plus (i) depreciation and amortization, (ii) finance costs excluding interest expenses related to the Equity Linked Securities and interest expenses related to the bank loans used for acquisition of the equity interest in Yonghui, and (iii) income tax expense. Adjusted EBITDA margin is computed by dividing adjusted EBITDA by revenue for the period. MINISO computes adjusted basic and diluted net earnings per ADS by dividing adjusted net profit attributable to the equity shareholders of the Company by the number of ADSs represented by the number of ordinary shares used in the basic and diluted earnings per share calculation on an IFRS basis. MINISO computes adjusted basic and diluted net earnings per share in the same way as it calculates adjusted basic and diluted net earnings per ADS, except that it uses the number of ordinary shares used in the basic and diluted earnings per share calculation on an IFRS basis as the denominator instead of the number of ADSs represented by these ordinary shares. Starting from March quarter 2026, to more accurately reflect the Company’s core business performance, the Company has adopted revised definitions of adjusted operating profit and adjusted net profit by excluding gain or loss from fair value changes of an investment in a limited partnership investing in the AI industry from the calculation of these items. The Company recorded loss of nil and RMB829.0 thousand, and gain of RMB25.4 million and RMB53.8 million from fair value changes of an investment in a limited partnership investing in the AI industry for the three months ended March 31, June 30, September 30, and December 31, 2025, respectively. To ensure comparability, the Company has retrospectively adjusted its non-IFRS financial measures for prior periods.
MINISO presents these non-IFRS financial measures because they are used by the management to evaluate its core business performance and formulate business plans. These non-IFRS financial measures enable the management to assess its core business results without considering the impacts of the aforementioned non-cash and other adjustment items that MINISO does not consider to be indicative of its core business performance in the future. Accordingly, MINISO believes that the use of these non-IFRS financial measures provides useful information to investors and others in understanding and evaluating its core business results in the same manner as the management and board of directors.
These non-IFRS financial measures are not defined under IFRS and are not presented in accordance with IFRS. These non-IFRS financial measures have limitations as analytical tools. One of the key limitations of using these non-IFRS financial measures is that they do not reflect all items of income and expense that affect MINISO’s core business. Further, these non-IFRS financial measures may differ from the non-IFRS information used by other companies, including peer companies, and therefore their comparability may be limited.
These non-IFRS financial measures should not be considered in isolation or construed as alternatives to operating profit, operating margin, effective tax rate, profit, net profit margin, basic and diluted earnings per share and basic and diluted earnings per ADS, as applicable, or any other measures of performance or as indicators of MINISO’s core business performance. Investors are encouraged to review MINISO’s historical non-IFRS financial measures in light of the most directly comparable IFRS financial measures, as shown below. The non-IFRS financial measures presented here may not be comparable to similarly titled measures presented by other companies. Other companies may calculate similarly titled measures differently, limiting the usefulness of such measures when analyzing MINISO’s data comparatively. MINISO encourages you to review its financial information in its entirety and not rely on a single financial measure.
For more information on the non-IFRS financial measures, please see the table captioned “Reconciliation of Non-IFRS Financial Measures” set forth at the end of this press release.
Safe Harbor Statement
This announcement contains forward-looking statements. These statements are made under the “safe harbor” provisions of the U.S. Private Securities Litigation Reform Act of 1995. These forward-looking statements can be identified by words or phrases such as “may”, “will”, “expect”, “anticipate”, “aim”, “estimate”, “intend”, “plan”, “believe”, “is/are likely to”, “potential”, “continue” or other similar expressions. Among other things, the quotations from management in this announcement, as well as MINISO’s strategic and operational plans, contain forward-looking statements. MINISO may also make written or oral forward-looking statements in its periodic reports to the U.S. Securities and Exchange Commission (the “SEC”) and The Stock Exchange of Hong Kong Limited (the “HKEX”), in its annual report to shareholders, in press releases and other written materials and in oral statements made by its officers, directors or employees to third parties. Statements that are not historical facts, including statements about MINISO’s beliefs and expectations, are forward-looking statements. Forward-looking statements involve inherent risks and uncertainties. A number of factors could cause actual results to differ materially from those contained in any forward-looking statement, including but not limited to the following: MINISO’s mission, goals and strategies; future business development, financial conditions and results of operations; the expected growth of the retail market and the market of branded variety retail of lifestyle products in China and globally; expectations regarding demand for and market acceptance of MINISO’s products; expectations regarding MINISO’s relationships with consumers, suppliers, Retail Partners, local distributors, and other business partners; competition in the industry; proposed use of proceeds; and relevant government policies and regulations relating to MINISO’s business and the industry. Further information regarding these and other risks is included in MINISO’s filings with the SEC and the HKEX. All information provided in this press release and in the attachments is as of the date of this press release, and MINISO undertakes no obligation to update any forward-looking statement, except as required under applicable law.
Investor Relations Contact:
MINISO Group Holding Limited
Email: ir@miniso.com
Phone: +86 (20) 36228788 Ext.8039
MINISO GROUP HOLDING LIMITED
UNAUDITED CONDENSED CONSOLIDATED STATEMENTS OF FINANCIAL POSITION
(Expressed in thousands)
As at
As at
December 31, 2025
June 30, 2026
(Audited)
(Unaudited)
RMB’000
RMB’000
US$’000
ASSETS
Non-current assets
Property, plant and equipment
2,109,385
2,583,756
380,799
Right-of-use assets
5,121,039
5,959,936
878,386
Intangible assets
94,951
225,543
33,241
Goodwill
223,187
210,946
31,090
Deferred tax assets
288,679
320,700
47,265
Other investments
201,727
479,160
70,619
Trade and other receivables
247,511
292,140
43,056
Financial derivative assets
774,103
321,925
47,446
Interests in equity-accounted
investees
5,486,648
5,555,912
818,840
14,547,230
15,950,018
2,350,742
Current assets
Other investments
–
100,351
14,790
Inventories
3,691,238
3,544,387
522,378
Trade and other receivables
3,307,129
3,453,949
509,050
Cash and cash equivalents
6,817,129
7,046,857
1,038,578
Restricted cash
54,229
5,931
874
Term deposits
216,567
241,074
35,530
14,086,292
14,392,549
2,121,200
Total assets
28,633,522
30,342,567
4,471,942
MINISO GROUP HOLDING LIMITED
UNAUDITED CONDENSED CONSOLIDATED STATEMENTS OF FINANCIAL POSITION (CONTINUED)
(Expressed in thousands)
As at
As at
December 31, 2025
June 30, 2026
(Audited)
(Unaudited)
RMB’000
RMB’000
US$’000
EQUITY
Share capital
94
94
14
Additional paid-in capital
2,887,905
2,080,167
306,579
Other reserves
2,232,854
1,771,661
261,111
Retained earnings
5,497,910
6,459,461
952,007
Equity attributable to equity
shareholders of the Company
10,618,763
10,311,383
1,519,711
Non-controlling interests
100,508
110,067
16,222
Total equity
10,719,271
10,421,450
1,535,933
LIABILITIES
Non-current liabilities
Contract liabilities
22,418
24,362
3,591
Loans and borrowings
5,415,416
6,287,885
926,720
Other payables
72,586
79,802
11,761
Lease liabilities
2,713,798
3,463,573
510,467
Financial derivative liabilities
1,184,050
858,687
126,555
Deferred income
33,053
32,570
4,800
9,441,321
10,746,879
1,583,894
Current liabilities
Contract liabilities
388,746
427,640
63,026
Loans and borrowings
1,751,018
2,352,982
346,787
Trade and other payables
4,516,491
4,428,106
652,622
Lease liabilities
950,784
1,114,196
164,212
Deferred income
965
965
142
Current taxation
291,245
247,692
36,505
Redemption liabilities arising
from preferred shares
573,681
602,657
88,821
8,472,930
9,174,238
1,352,115
Total liabilities
17,914,251
19,921,117
2,936,009
Total equity and liabilities
28,633,522
30,342,567
4,471,942
MINISO GROUP HOLDING LIMITED
UNAUDITED CONDENSED CONSOLIDATED STATEMENTS OF PROFIT OR LOSS
AND OTHER COMPREHENSIVE INCOME
(Expressed in thousands, except for per ordinary share and per ADS data)
Three months ended June 30,
Six months ended June 30,
2025
2026
2025
2026
(Unaudited)
(Unaudited)
(Unaudited)
(Unaudited)
RMB’000
RMB’000
US$’000
RMB’000
RMB’000
US$’000
Revenue
4,966,068
5,810,513
856,364
9,393,112
11,498,901
1,694,728
Cost of sales
(2,767,187)
(3,180,868)
(468,802)
(5,236,194)
(6,405,225)
(944,013)
Gross profit
2,198,881
2,629,645
387,562
4,156,918
5,093,676
750,715
Other income
2,350
763
112
5,370
6,679
984
Selling and distribution expenses
(1,159,836)
(1,574,119)
(231,996)
(2,181,022)
(3,045,031)
(448,782)
General and administrative
expenses
(261,512)
(293,650)
(43,279)
(503,656)
(590,943)
(87,094)
Other net income/(loss)
77,404
(625,184)
(92,141)
98,239
196,657
28,984
Credit loss on trade and other
receivables
(4,675)
(12,489)
(1,841)
(13,450)
(14,663)
(2,161)
Impairment loss on non-current
assets
(16,450)
(6,465)
(953)
(16,450)
(6,465)
(953)
Operating profit
836,162
118,501
17,464
1,545,949
1,639,910
241,693
Finance income
28,921
16,275
2,399
65,836
32,749
4,827
Finance costs
(108,291)
(124,226)
(18,309)
(194,236)
(244,722)
(36,068)
Net finance costs
(79,370)
(107,951)
(15,910)
(128,400)
(211,973)
(31,241)
Share of (loss)/profit of equity-
accounted investees, net of tax
(136,941)
(20,435)
(3,012)
(138,946)
57,757
8,512
Other gain/(expenses)
6,659
(90,498)
(13,338)
(84,412)
(141,336)
(20,830)
Changes in fair value of
redemption liabilities
–
(25,930)
(3,822)
–
(47,368)
(6,981)
Profit/(loss) before taxation
626,510
(126,313)
(18,618)
1,194,191
1,296,990
191,153
Income tax expense
(136,979)
(165,198)
(24,347)
(288,201)
(340,399)
(50,169)
Profit/(loss) for the period
489,531
(291,511)
(42,965)
905,990
956,591
140,984
Attributable to:
Equity shareholders of the
Company
489,688
(289,186)
(42,622)
906,030
961,551
141,715
Non-controlling interests
(157)
(2,325)
(343)
(40)
(4,960)
(731)
Earnings/(loss) per share for
ordinary shares
-Basic
0.40
(0.24)
(0.04)
0.74
0.79
0.12
-Diluted
0.40
(0.24)
(0.04)
0.73
0.79
0.12
Earnings/(loss) per ADS
(Each ADS represents 4
ordinary shares)
-Basic
1.60
(0.96)
(0.14)
2.96
3.16
0.47
-Diluted
1.60
(0.96)
(0.14)
2.92
3.16
0.47
MINISO GROUP HOLDING LIMITED
UNAUDITED CONDENSED CONSOLIDATED STATEMENTS OF PROFIT OR LOSS
AND OTHER COMPREHENSIVE INCOME (CONTINUED)
(Expressed in thousands)
Three months ended June 30,
Six months ended June 30,
2025
2026
2025
2026
(Unaudited)
(Unaudited)
(Unaudited)
(Unaudited)
RMB’000
RMB’000
US$’000
RMB’000
RMB’000
US$’000
Profit/(loss) for the period
489,531
(291,511)
(42,965)
905,990
956,591
140,984
Items that may be reclassified
subsequently to profit or loss:
Exchange differences on
translation of financial statements
of foreign operations
12,966
(27,735)
(4,088)
11,675
(77,115)
(11,365)
Share of other comprehensive
income of equity-accounted
investees
–
1,907
281
–
2,720
401
Other comprehensive
income/(loss) for the period
12,966
(25,828)
(3,807)
11,675
(74,395)
(10,964)
Total comprehensive
income/(loss) for the period
502,497
(317,339)
(46,772)
917,665
882,196
130,020
Attributable to:
Equity shareholders of the
Company
501,095
(309,689)
(45,645)
917,401
894,228
131,793
Non-controlling interests
1,402
(7,650)
(1,127)
264
(12,032)
(1,773)
MINISO GROUP HOLDING LIMITED
RECONCILIATION OF NON-IFRS FINANCIAL MEASURES
(Expressed in thousands, except for percentages)
Three months ended June 30,
Six months ended June 30,
2025
2026
2025
2026
(Unaudited)
(Unaudited)
(Unaudited)
(Unaudited)
RMB’000
RMB’000
US$’000
RMB’000
RMB’000
US$’000
Reconciliation of operating profit
for the period to adjusted
operating profit
Operating profit
836,162
118,501
17,464
1,545,949
1,639,910
241,693
Add back:
Equity-settled share-based
payment expenses
15,656
15,008
2,212
40,586
123,723
18,235
Loss/(gain) from fair value
changes of an investment in a
limited partnership investing in
the AI industry
829
597,159
88,010
829
(277,434)
(40,889)
Adjusted operating profit
852,647
730,668
107,686
1,587,364
1,486,199
219,039
Adjusted operating margin
17.2 %
12.6 %
12.6 %
16.9 %
12.9 %
12.9 %
Reconciliation of operating profit
for the period to adjusted
operating profit excluding FX(1)
Adjusted operating profit
852,647
730,668
107,686
1,587,364
1,486,199
219,039
Add back:
Net foreign exchange (gain)/loss
(34,993)
59,890
8,827
(36,570)
142,438
20,993
Adjusted operating profit
excluding FX(1)
817,654
790,558
116,513
1,550,794
1,628,637
240,032
Adjusted operating margin
excluding FX(1)
16.5 %
13.6 %
13.6 %
16.5 %
14.2 %
14.2 %
Note:
(1) “FX” refers to net foreign exchange gain or loss for the period.
MINISO GROUP HOLDING LIMITED
RECONCILIATION OF NON-IFRS FINANCIAL MEASURES (CONTINUED)
(Expressed in percentages)
Three months ended June 30,
Six months ended June 30,
2025
2026
2025
2026
(Unaudited)
(Unaudited)
(Unaudited)
(Unaudited)
Reconciliation of effective tax rate to
adjusted effective tax rate:
Effective tax rate
21.9 %
(130.8) %
24.1 %
26.2 %
Impact on effective tax rate as a result
of adjusted items
(5.4) %
155.5 %
(5.7) %
(1.4) %
Adjusted effective tax rate
16.5 %
24.7 %
18.4 %
24.8 %
MINISO GROUP HOLDING LIMITED
RECONCILIATION OF NON-IFRS FINANCIAL MEASURES (CONTINUED)
(Expressed in thousands, except for per share, per ADS data and percentages)
Three months ended June 30,
Six months ended June 30,
2025
2026
2025
2026
(Unaudited)
(Unaudited)
(Unaudited)
(Unaudited)
RMB’000
RMB’000
US$’000
RMB’000
RMB’000
US$’000
Reconciliation of profit for the
period to adjusted net profit:
Profit/(loss) for the period
489,531
(291,511)
(42,965)
905,990
956,591
140,984
Add back:
Equity-settled share-based
payment expenses
15,656
15,008
2,212
40,586
123,723
18,235
(Gain)/loss from fair value
change of derivatives(1)(2)
(6,659)
90,498
13,338
39,748
141,336
20,830
Issuance cost of derivatives(1)(3)
–
–
–
44,664
–
–
Interest expenses related to the
Equity Linked Securities and the
bank loans used for acquisition of
the equity interest in Yonghui(1)
73,606
74,305
10,951
128,351
147,820
21,786
-Interest expenses related to
the Equity Linked Securities(4)
49,358
51,008
7,518
89,885
101,388
14,943
-Interest expenses related to
the bank loans used for acquisition
of the equity interest in Yonghui
24,248
23,297
3,433
38,466
46,432
6,843
Share of loss/(profit) of Yonghui,
net of tax(1)
119,335
17,169
2,530
119,335
(60,289)
(8,885)
Changes in fair value of redemption
liabilities(1)
–
25,930
3,822
–
47,368
6,981
Loss/(gain) from fair value changes
of an investment in a limited
partnership investing in the AI
industry(5)
829
597,159
88,010
829
(277,434)
(40,889)
Adjusted net profit
692,298
528,558
77,898
1,279,503
1,079,115
159,042
Adjusted net margin
13.9 %
9.1 %
9.1 %
13.6 %
9.4 %
9.4 %
Attributable to:
Equity shareholders of the
Company
692,459
530,827
78,232
1,279,458
1,083,167
159,639
Non-controlling interests
(161)
(2,269)
(334)
45
(4,052)
(597)
Adjusted net earnings per
share(6)
-Basic
0.56
0.44
0.06
1.04
0.89
0.13
-Diluted
0.56
0.44
0.06
1.04
0.89
0.13
Adjusted net earnings per
ADS (Each ADS represents 4
ordinary shares)
-Basic
2.24
1.76
0.26
4.16
3.56
0.52
-Diluted
2.24
1.76
0.26
4.16
3.56
0.52
MINISO GROUP HOLDING LIMITED
RECONCILIATION OF NON-IFRS FINANCIAL MEASURES (CONTINUED)
(Expressed in thousands, except for percentages)
Three months ended June 30,
Six months ended June 30,
2025
2026
2025
2026
(Unaudited)
(Unaudited)
(Unaudited)
(Unaudited)
RMB’000
RMB’000
US$’000
RMB’000
RMB’000
US$’000
Reconciliation of adjusted net
profit for the period to adjusted
net profit excluding FX(7):
Adjusted net profit
692,298
528,558
77,898
1,279,503
1,079,115
159,042
Add back:
Net foreign exchange
(gain)/loss
(34,993)
59,890
8,827
(36,570)
142,438
20,993
Adjusted net profit excluding
FX(7)
657,305
588,448
86,725
1,242,933
1,221,553
180,035
Adjusted net margin
excluding FX(7)
13.2 %
10.1 %
10.1 %
13.2 %
10.6 %
10.6 %
Reconciliation of adjusted net
profit for the period to adjusted
EBITDA:
Adjusted net profit
692,298
528,558
77,898
1,279,503
1,079,115
159,042
Add back:
Depreciation and amortization
286,344
406,123
59,855
554,016
739,113
108,932
Finance costs excluding
interest expenses related to the
Equity Linked Securities
34,685
49,921
7,358
65,885
96,902
14,282
Income tax expense
136,979
165,198
24,347
288,201
340,399
50,169
Adjusted EBITDA
1,150,306
1,149,800
169,458
2,187,605
2,255,529
332,425
Adjusted EBITDA margin
23.2 %
19.8 %
19.8 %
23.3 %
19.6 %
19.6 %
Notes:
(1) These adjustment items have been excluded from the calculation of adjusted net profit as the management of the
Company does not consider such items to be indicative of its performance of core business.
(2) The gain or loss from fair value change of derivatives was a non-cash gain or expense that was related to the fair
value of the Equity Linked Securities and call spread. It was determined primarily by movements in the underlying share
price.
(3) The issuance cost of derivatives was a one-off expense that was related to the Equity Linked Securities.
(4) For 26Q2, the RMB51.0 million interest expenses related to the Equity Linked Securities included RMB46.3 million
non-cash portion and RMB4.7 million cash expense.
For 26H1, the RMB101.4 million interest expenses related to the Equity Linked Securities included RMB92.0 million
non-cash portion and RMB9.4 million cash expense.
(5) Gain or loss from fair value changes of an investment in a limited partnership investing in the AI industry was
included in other net income or loss, which was an unrealized gain or loss arising from fair value changes of an investment
in a limited partnership investing in the AI industry.
(6) Adjusted basic and diluted net earnings per share are computed by dividing adjusted net profit attributable to the
equity shareholders of the Company by the number of ordinary shares used in the basic and diluted earnings per share
calculation on an IFRS basis.
(7) “FX” refers to net foreign exchange gain or loss for the period.
MINISO GROUP HOLDING LIMITED
UNAUDITED ADDITIONAL INFORMATION
(Expressed in thousands, except for percentages)
Three months ended June 30,
Six months ended June 30,
2025
2026
YoY
2025
2026
YoY
RMB’000
RMB’000
US$’000
RMB’000
RMB’000
US$’000
Revenue
MINISO Brand
4,563,226
5,339,823
786,993
17.0 %
8,649,004
10,513,225
1,549,457
21.6 %
-Chinese mainland
2,621,212
3,221,701
474,820
22.9 %
5,114,987
6,453,955
951,195
26.2 %
-Overseas markets
1,942,014
2,118,122
312,173
9.1 %
3,534,017
4,059,270
598,262
14.9 %
TOP TOY Brand(1)
402,208
470,133
69,289
16.9 %
742,058
984,618
145,115
32.7 %
Others
634
557
82
(12.1) %
2,050
1,058
156
(48.4) %
4,966,068
5,810,513
856,364
17.0 %
9,393,112
11,498,901
1,694,728
22.4 %
Note:
(1) Revenue from TOP TOY brand only represents revenue generated from external parties.
MINISO GROUP HOLDING LIMITED
UNAUDITED ADDITIONAL INFORMATION
NUMBER OF MINISO STORES IN CHINESE MAINLAND
As of
June 30,
2025
December 31,
2025
June 30,
2026
YoY
YTD(1)
By City Tiers
First-tier cities
572
609
611
39
2
Second-tier cities
1,774
1,881
1,928
154
47
Third- and lower-tier cities
1,959
2,078
2,126
167
48
Total
4,305
4,568
4,665
360
97
Note:
(1) “YTD” refers to the six months ended June 30, 2026.
MINISO GROUP HOLDING LIMITED
UNAUDITED ADDITIONAL INFORMATION
NUMBER OF MINISO STORES IN OVERSEAS MARKETS
As of
By Regions
June 30,
2025
December 31,
2025
June 30,
2026
YoY
YTD(1)
Asia excluding China
1,695
1,793
1,793
98
–
North America
394
461
536
142
75
Latin America
661
722
726
65
4
Europe
319
361
356
37
(5)
Others
238
246
233
(5)
(13)
Total
3,307
3,583
3,644
337
61
Note:
(1) “YTD” refers to the six months ended June 30, 2026.
*For identification purpose only
View original content:https://www.prnewswire.com/news-releases/miniso-group-announces-2026-june-quarter-and-interim-unaudited-financial-results-302862628.html
SOURCE MINISO Group Holding Limited


Huasun Expands Southeast Asia Footprint with 13.7MW Himalaya PLUS Module Supply for Myanmar Project

xTool Introduces X1, a Next-Gen All-in-One Laser Platform Built for Speed, Scale, and Versatility
MINISO Group Announces 2026 June Quarter and Interim Unaudited Financial Results

Send Rakhi to UK swiftly with UK Gifts Portal

Whiteboard Series with NEAR | Ep: 45 Joel Thorstensson from ceramic.network

New Gooseneck Omni Antennas Offer Enhanced Signals in a Durable Package

Why You Should Build on #NEAR – Co-founder Illia Polosukhin at CV Labs
Whiteboard Series with NEAR | Ep: 45 Joel Thorstensson from ceramic.network

NEAR End of Year Town Hall 2021: The Open Web World, MetaBUILD 2 Hackathon and 2021 recap
Trending
-

 Technology2 days ago
Combos Makes Its Global Debut at Gamescom, Bringing AI-Created Games by Everyday Creators
-
 Technology2 days ago
Handshakes Launches AI Agent to Transform Corporate Due Diligence and Investigation
-
 Technology5 days ago
Maxpeedingrods Introduces IDDS Series Coilover System with Electronic Damping Control
-

 Near Videos4 days ago
NEAR’s AI Money Thesis | NEAR Co-Founder Illia Polosukhin
-
 Technology2 days ago
JinkoSolar Announces Second Quarter 2026 Financial Results
-

 Technology5 days ago
World’s First Autonomous Humanoid Tennis Match: GALBOT Robots Complete 100+ Consecutive Rallies
-

 Technology4 days ago
Inspira Enterprise Expands into Australia to Accelerate AI-Driven Cybersecurity and Digital Resilience Across Enterprises
-

 Technology2 days ago
Three “Native” Capabilities: How Pinea Pi Defines the Edge AI Device