Technology
Haivision Announces Results for the Three Months and Six Months Ended April 30, 2024
Published
2 years agoon
By
Business Transformation Exceeds Expectations
MONTREAL, June 12, 2024 /CNW/ – Haivision Systems Inc. (“Haivision” or the “Company”) (TSX: HAI), a leading global provider of mission critical, real-time video networking and visual collaboration solutions, today announced its results for the second quarter ended April 30, 2024.
“I am excited that our overall transformation of the business is exceeding our expectations,” said Mirko Wicha, Chairman and CEO of Haivision. Our drive towards a partner friendly channel strategy in the control room market is moving ahead faster than anticipated and will enable us to scale that business globally.”
Q2 2024 Financial Results
Revenue of $34.2 largely consistent with prior year when normalized for the exit from the managed services business, and reflects our transformation away from offering bespoke “integrator” solutions that include lower margin, third-party components.Gross Margins* were 71.7%, a notable improvement from 68.9% for the same prior year period.Total expenses were $22.7 million, a decrease of $2.4 million, from the same prior year period.Operating profit was $1.8 million, a $2.8 million or 302% improvement from the same prior year period.Adjusted EBITDA* was $5.1 million, a $2.4 million or 92% improvement from the same prior year period.Adjusted EBITDA Margins* was 14.8%, a notable improvement when compared to 7.5% for the same prior year period.Net income was $0.9 million, a $2.4 million or 162% improvement from the same prior year period.
Financial Results for the six months ended April 30, 2024
Revenue of $68.7 million, an increase of 3.7% when normalized for the exit from the managed services business.Gross Margins* were 72.3%, a notable improvement from 67.8% for the same prior year period.Total expenses were $45.6 million, a decrease of $3.2 million from the same prior year period.Operating profit was $4.1 million, a $6.1 million or 307% improvement from the same prior year period.Adjusted EBITDA* was $10.2 million, a $5.5 million or 116% improvement from the same prior year period.Adjusted EBITDA Margins* was 14.9%, a notable improvement when compared to 6.9% for the same prior year period.Net income was $2.2 million, a $5.1 million or 175% improvement from the same prior year period.
Key Company Highlights
Celebrated its 20-years anniversary as a leader and innovator in mission critical live video.Unveiled Hub 360, a cloud-based master control solution that streamlines live production workflows.Published its fifth annual Broadcast Transformation Report, highlighting the state of technology adoption in the broadcast industry.Awarded “Single/Dual-Stream Encoding Hardware” and “Best On-Prem Encoding/ Transcoding Solution” for the Makito X4 by Streaming Media Readers’ Choice Awards.Joined the Panasonic Partner Alliance for live video production workflows with Kairos; joined the Sony Cloud Production Platform for low latency live video in the cloud; and partnered with Grabyo, a London-based live cloud production platform, enabling integrated solution for live multi-camera productions.Announced strategic partnerships with CP Communications, Flypack, RF Wireless Systems, and Vidovation to extend mobile video transmitters rental services into North America.Awarded the prestigious IBC Innovation Award 2023 in the Content Creation Category for its role as technical partner in the BBC’s coverage of the Coronation of King Charles III.Welcomed NVIDIA to the SRT Alliance, with SRT Alliance membership at over 600 members.Awarded TV Tech’s Product Innovation Award for Haivision’s Pro 460 transmitters for technical excellence in M&E solutions.Awarded Four-Star Best in Show award for Haivision’s Command 360 for Real-time Data Sharing at the DSEI 2023 show in London, England.
“Our continuing transition away from an integrator model in the control room space, which offered lower-margined, third-party components, has resulted in more stable and robust gross margins. However, that transition will be at the expense of top line revenue as we continue the transition to a manufacturer of proprietary products. said Dan Rabinowitz, Chief Financial Officer and EVP, Operations. In addition, our Adjusted EBITDA margins have been in the mid-teens for three consecutive quarters, and our trailing twelve-month Adjusted EBITDA is now $20.3 million. The value of what we are building should be more apparent to the investment community.”
Financial Results
Revenue for the three months and six months ended April 30, 2024 was $34.2 million and $68.7 million, respectively modest decrease when compared to the prior year comparative period. However, in the three month and six-month periods, cloud solutions revenues declined by $1.0 million and $2.8 million, respectively attributed to our decision to exit the managed services business. Further, revenue was impacted from our transition in the control room space away from the integrator model which resulted in fewer sales of lower-margined, third-party components.
Gross Margin* for the three months and six months ended April 30, 2024 was 71.7% and 72.3%, respectively compared to 68.9% and 67.8% for the prior year comparable periods. Gross Margin* were positively impacted by our decision to exit the managed services business; transitioning away from th integrator model in the control room market, decreases in the incremental costs of components procured during the worldwide component shortage, and supply chain improvements.
Total expenses for the three months and six months ended April 30, 2024 were $22.6 million and $45.6 million, respectively representing decrease of $2.4 million and $3.2 million when compared to from the prior year comparative periods, largely the result of recently completed restructuring efforts.
The result of these Gross Margin* improvements and lower total expenses was operating profits for the three months and six months ended April 30t, 2024 of $1.8 million and $4.1 million, respectively representing improvements of $2.8 million and $6.1 million when compared to the prior year comparable periods. Adjusted EBITDA* for the three months and six months ended April 30, 2024 was $5.1 million and $10.2 million, respectively representing increases of $2.4 million (or 92%) and $5.5 million (or 116%) from the prior year comparative period. Adjusted EBITDA Margins* for the three months ended April 30, 2024, was 14.8% compared to 7.5% in the prior year comparative period. Adjusted EBITDA Margins* for the six months ended April 30, 2024, was 14.9% compared to 6.9% in the prior year comparative period.
Net income for the three months ended April 30, 2024, was $0.9 million representing an increase of $2.6 million from the prior year net loss of $1.5 million, and net income for the six months ended April 30, 2024 was $2.2 million and increase of $5.1 million from the prior year loss of $2.9 million.
*Measures followed by the suffix “*” in this press release are non-IFRS measures. For the relevant definition, see “Non-IFRS Measures” below. As applicable, a reconciliation of this non-IFRS measure to the most directly comparable IFRS financial measure is included in the tables at the end of this press release and in the Company’s management’s discussion and analysis for the three months and six months ended April 30, 2024.
Conference Call Notification
Haivision will hold a conference call to discuss its second quarter financial results on Wednesday, June 12, 2024 at 5:15 pm (ET). To register for the call, please use this link https://registrations.events/direct/Q4I334140. After registering, a confirmation will be sent through email, including dial in details and unique conference call codes for entry.
Financial Statements, Management’s Discussion and Analysis and Additional Information
Haivision’s unaudited interim consolidated financial statements for the second quarter ended April 30, 2024 (the “Q2 Financial Statements”), the management’s discussion and analysis thereon and additional information relating to Haivision and its business can be found under Haivision’s profile on SEDAR+ at www.sedarplus.ca. The financial information presented in this release was derived from the Q2 Financial Statements.
Forward-Looking Statements
This release includes “forward-looking information” and “forward-looking statements” (collectively, “forward-looking statements”) within the meaning of applicable securities laws, including, without limitation, statements regarding the Company’s growth opportunities and its ability to execute on its growth strategy. In some cases, but not necessarily in all cases, forward-looking statements can be identified by the use of forward-looking terminology such as “plans”, “targets”, “expects” or “does not expect”, “is expected”, “an opportunity exists”, “is positioned”, “estimates”, “intends”, “assumes”, “anticipates” or “does not anticipate” or “believes”, or variations of such words and phrases or state that certain actions, events or results “may”, “could”, “would”, “might”, “will” or “will be taken”, “occur” or “be achieved”. In addition, any statements that refer to expectations, projections or other characterizations of future events or circumstances contain forward-looking statements. Forward-looking statements are not historical facts, nor guarantees or assurances of future performance but instead represent management’s current beliefs, expectations, estimates and projections regarding future events and operating performance.
Forward-looking statements are necessarily based on opinions, assumptions and estimates that, while considered reasonable by Haivision as of the date of this release, are subject to inherent uncertainties, risks and changes in circumstances that may differ materially from those contemplated by the forward-looking statements. Important factors that could cause actual results to differ, possibly materially, from those indicated by the forward-looking statements include, but are not limited to, the risk factors identified under “Risk Factors” in the Company’s latest annual information form, and in other periodic filings that the Company has made and may make in the future with the securities commissions or similar regulatory authorities in Canada, all of which are available under the Company’s SEDAR+ profile at www.sedarplus.ca. These factors are not intended to represent a complete list of the factors that could affect Haivision. However, such risk factors should be considered carefully. There can be no assurance that such estimates and assumptions will prove to be correct. You should not place undue reliance on forward-looking statements, which speak only as of the date of this release. Haivision undertakes no obligation to publicly update any forward-looking statement, except as required by applicable securities laws.
Non-IFRS Measures
Haivision’s consolidated financial statements for the second quarter ended April 30, 2024 are prepared in accordance with International Financial Reporting Standards (“IFRS”). As a compliment to results provided in accordance with IFRS, this press release makes reference to certain (i) non-IFRS financial measures, including “EBITDA”, and “Adjusted EBITDA”, (ii) non-IFRS ratios including “Adjusted EBITDA Margin”, and (iii) supplementary financial measures including “Gross Margins” (collectively “non-IFRS measures”). These non-IFRS measures are not recognized measures under IFRS and do not have a standardized meaning prescribed by IFRS and are therefore unlikely to be comparable to similar measures presented by other companies. Accordingly, these measures should not be considered in isolation or as a substitute for analysis of our financial information reported under IFRS. Rather, these non-IFRS measures are used to provide investors with supplemental measures of our operating performance and thus highlight trends in our core business that may not otherwise be apparent when relying solely on IFRS measures. We also believe that securities analysts, investors, and other interested parties frequently use non-IFRS measures in the evaluation of issuers. Our management also uses non-IFRS measures to facilitate operating performance comparisons from period to period, to prepare annual operating budgets and forecasts and to determine components of management compensation. For information on the most directly comparable financial measure disclosed in the primary financial statements of Haivision, composition of the non-IFRS measures, a description of how Haivision uses these measures and an explanation of how these measures provide useful information to investors, refer to the “Non-IFRS Measures” section of the Company’s management’s discussion and analysis for the three months and six months ended April 30, 2024, dated June 12, 2024, available on the Company’s SEDAR+ profile at www.sedarplus.ca, which is incorporated by reference into this press release. As applicable, the reconciliations for each non-IFRS measure are outlined below. Non-IFRS measures should not be considered as alternatives to net income or comparable metrics determined in accordance with IFRS as indicators of the Company’s performance, liquidity, cash flow and profitability.
About Haivision
Haivision is a leading global provider of mission-critical, real-time video streaming and visual collaboration solutions. Our connected cloud and intelligent edge technologies enable organizations globally to engage audiences, enhance collaboration, and support decision making. We provide high quality, low latency, secure, and reliable live video at a global scale. Haivision open sourced its award-winning SRT low latency video streaming protocol and founded the SRT Alliance to support its adoption. Awarded four Emmys® for Technology and Engineering from the National Academy of Television Arts and Sciences, Haivision continues to fuel the future of IP video transformation. Founded in 2004, Haivision is headquartered in Montreal and Chicago with offices, sales, and support located throughout the Americas, Europe, and Asia. Learn more at haivision.com.
Thousands of Canadian dollars (except per share amounts)
Three months ended
April 30,
Six months ended
April 30,
2024
2023
2024
2023
($)
($)
($)
($)
Revenue
34,169
35,112
68,748
69,178
Cost of sales
9,658
10,912
19,044
22,307
Gross profit
24,511
24,200
49,704
46,871
Expenses
Sales and marketing
6,978
8,111
13,633
15,512
Operations and support
3,968
3,861
7,965
7,588
Research and development
6,998
7,819
14,026
15,306
General and administrative
4,027
4,603
8,918
9,300
Share-based payment
695
720
1,042
1,096
22,662
25,114
45,584
48,802
Operating Profit (loss)
1,845
(914)
4,120
(1,931)
Financial expenses
244
340
543
944
Income (loss) before income taxes
1,601
(1,254)
3,577
(2,876)
Income taxes
Current
504
487
1,343
144
Deferred
165
(226)
25
(87)
669
261
1,368
58
Net loss
932
(1,515)
2,209
(2,932)
Other comprehensive income (loss)
Foreign currency translation adjustment
1,995
1,907
(581)
2,668
Comprehensive income (loss)
2,926
392
1,627
(265)
Net income (loss) per share:
Basic
$0.03
$(0.05)
$0.08
$(0.10)
Diluted
$0.03
$(0.05)
$0.07
$(0.10)
Weighted average number of shares outstanding
Basic
29,152,541
29,004,453
29,090,446
28,943,698
Diluted
30,311,651
29,004,453
30,130,367
28,943,698
Thousands of Canadian dollars
As at
April 30,
2024
October 31,
2023
$
$
Assets
Current assets
Cash
11,189
8,285
Trade and other receivables
24,655
26,113
Investment tax credits receivable
2,221
2,238
Inventories
16,394
18,930
Prepaid expenses and deposits
4,766
4,043
59,225
59,609
Property and equipment
3,587
3,900
Right-of-use assets
6,582
7,494
Intangible assets
14,195
17,668
Goodwill
45,927
46,219
Non-refundable investment tax credits receivable
7,238
5,602
Deferred income taxes
3,536
3,599
81,065
84,482
140,290
144,091
Liabilities
Current liabilities
Credit facility
1,734
4,685
Trade and other payables
14,517
17,534
Restructuring costs payable
69
240
Purchase price payable
204
204
Income taxes payable
891
659
Current portion of lease liabilities
1,681
1,688
Current portion of term loans
1,123
964
Deferred revenue
13,561
12,104
33,780
38,078
Lease liabilities
5,852
6,738
Long term debt
1,446
2,101
Deferred revenue
4,082
3,021
45,160
49,938
Equity
Share capital
91,219
90,902
Retained earnings
(7,739)
(9,997)
Share-based compensation and other reserves
4,279
5,295
Cumulative translation adjustment
7,371
7,953
95,130
94,153
140,290
144,091
Thousands of Canadian dollars
Three months ended
April 30,
Six months ended
April 30,
2024
2023
2024
2023
($)
($)
($)
($)
Net Income (loss)
932
(1,515)
2,209
(2,932)
Income Taxes
669
261
1,368
58
Income (loss) before income taxes
1,601
(1,254)
3,577
(2,875)
Depreciation
896
768
1,733
1,546
Amortization
1,637
2,069
3,345
4,037
Financial expenses
244
340
543
944
EBITDA(1)
4,378
1,923
9,198
3,652
Share-based payments (LTIP)
695
720
1,042
1,096
Adjusted EBITDA(1)
5,073
2,643
10,240
4,748
Adjusted EBITDA Margin(1)
14.8 %
7.5 %
14.9 %
6.9 %
________________________
Note:
(1) Non-IFRS measure. See “Non-IFRS Measures.”
View original content to download multimedia:https://www.prnewswire.com/news-releases/haivision-announces-results-for-the-three-months-and-six-months-ended-april-30-2024-302171166.html
SOURCE Haivision Systems Inc.
You may like
Technology
Secretary of State Belanger announces expansion of high-speed Internet access in Saskatchewan
Published
28 minutes agoon
July 24, 2026By
Federal investment of over $141 million will help connect more than 30,000 homes to high–speed Internet
HUMBOLDT, SK, July 24, 2026 /CNW/ — Reliable and affordable high-speed Internet is essential for all Canadians. It enables access to important online resources, connects friends and families, and drives economic growth and innovation. This is why the Government of Canada is helping bring high-speed Internet access to underserved communities–including Indigenous communities–in Saskatchewan.
Today, the Honourable Buckley Belanger, Secretary of State for Rural Development, announced over $141 million in federal funding for six projects to bring high-speed Internet access to more than 30,000 households in over 500 rural and remote communities across Saskatchewan.
This funding is provided through the Universal Broadband Fund, a program designed to ensure that Canadians in rural, remote and Indigenous communities have access to reliable high-speed Internet.
The Government of Canada has committed to ensuring that every household in Canada has access to high-speed Internet by 2030, and it is on track to meet this connectivity target. These projects will build toward that goal, and the government will continue to invest in infrastructure that creates new opportunities and makes sure communities can benefit from all of Canada’s potential.
Quotes
“High-speed Internet is no longer just a luxury–it’s essential infrastructure, no matter where you live in Canada. It’s how people access health care virtually, start a business or just stay in touch with their loved ones. That’s why we made a historic commitment to provide 100% of Canadian households with access to high-speed Internet by 2030. The projects announced today are a major milestone for connectivity in Saskatchewan, providing reliable and affordable high-speed Internet to more than 30,000 underserved homes in over 500 rural and remote communities across the province.”
– The Honourable Buckley Belanger, Secretary of State for Rural Development
“In many rural and remote areas, connectivity projects like these face a number of financial and structural barriers. Federal tools like the Canada Infrastructure Bank help bridge that gap, ensuring critical infrastructure is built where it otherwise would not be. By supporting initiatives like this, we are advancing economic growth today and helping close the connectivity gap for underserved communities well into the future.”
– The Honourable Gregor Robertson, Minister of Housing and Infrastructure and Minister responsible for Pacific Economic Development Canada
“Access to dependable high-speed Internet should not be determined by where people live. Thanks to support from the Government of Canada through the Universal Broadband Fund, RFNOW is delivering the infrastructure needed to connect underserved rural and First Nations communities across Saskatchewan. Together, we are building a stronger digital future that will enhance economic development, support essential services and improve quality of life for thousands of Canadians.”
– Chris Kennedy, Chief Executive Officer, RFNOW Inc.
“Every community deserves the opportunity that comes with access to reliable high-speed Internet–and that’s exactly what this investment delivers. In partnership with the Government of Canada’s Universal Broadband Fund, Xplore is bringing high-speed Internet connectivity to nearly 20,000 homes and businesses in Saskatchewan. Better connectivity means more than faster downloads–it means students can learn without interruption, families can access health care from home, and local businesses can compete on a level playing field.”
– Brent Johnston, Chief Executive Officer, Xplore Inc.
“Since our establishment in 2007, we have been committed to providing dependable Internet service and strengthening connections in the communities we serve. With support from the Government of Canada’s Universal Broadband Fund, we’re excited to expand our network and introduce new 6 GHz fixed wireless technology capable of delivering speeds of up to 1 Gbps. This project will help more residents of rural and remote communities access the reliable high-speed connectivity they need for work, education, health care, business and everyday life.”
– Allen Stafford, President, Stafford Communications Inc.
“Beaver River Broadband has secured federal Universal Broadband Fund support to deliver fibre-to-the-home infrastructure directly to Peepeekisis Cree Nation. This critical investment guarantees gigabit-capable Internet access that will transform local opportunities in digital education, remote health care and community-led economic development. Crucially, the project underscores the importance of partnering with smaller, regional Internet providers that bring deep community roots, agile deployment and a dedicated focus on serving areas that larger national carriers often overlook. As an Indigenous-led regional provider working closely with First Nations, Beaver River Broadband understands the unique needs of the area and delivers tailored, reliable customer support on the ground. Empowering local providers through initiatives like the Universal Broadband Fund ensures that underserved First Nations are not just connected but also supported by partners invested in their long-term digital sovereignty.”
– John DeGraauw, CEO, Beaver River Broadband
“MCSnet’s fibre-to-the-tower expansion in Saskatchewan will deliver fast, highly reliable Internet access to underserved homes in rural Saskatchewan, courtesy of a dedicated, community-invested provider. As a family-owned company based in the Prairies, we have been serving rural communities with our innovative technology and exceptional customer service for over 30 years.”
– Jerome VanBrabant, Chief Projects Officer, MCSnet
Quick facts
Canada’s Connectivity Strategy aims to provide all Canadians with access to Internet speeds of at least 50 megabits per second (Mbps) download / 10 Mbps upload.The Universal Broadband Fund is a $3.225 billion investment by the Government of Canada designed to help provide high-speed Internet access to 98% of Canadian households by the end of 2026 and achieve the national target of 100% access by 2030.Today, 97.4% of Canadian households have access to high-speed Internet, compared to just 79% in 2014.In Saskatchewan, 89.2% of households currently have access to high-speed internet.Since 2015, the Government of Canada has invested $242 million in connectivity projects in Saskatchewan.The Canada Infrastructure Bank has committed more than $2 billion toward digital (broadband) infrastructure, closing last-mile connectivity gaps across Canada.Indigenous women, girls, Two-Spirit individuals and gender diverse people are more likely to go missing or be murdered than non-Indigenous women. Better connectivity means more tools in moments of danger, enabling victims of violence to access critical online resources and get help when they need it most.Building on the Building a Green Prairie Economy Act, the Government of Canada launched the Prairie Partnership Initiative to build a dynamic, sustainable and inclusive economy in the Prairie provinces.
Associated links
Rural economic developmentHigh-Speed Internet Access DashboardUniversal Broadband FundBackgrounder: Universal Broadband Fund and Telesat low Earth orbit capacity agreementCanada Infrastructure Bank: Digital Infrastructure and AIHigh-Speed Access for All: Canada’s Connectivity StrategyNational Broadband MapFederal Pathway to Address Missing and Murdered Indigenous Women, Girls and 2SLGBTQQIA+ PeoplePrairie Partnership Initiative
Stay connected
Follow Innovation, Science and Economic Development Canada on social media. X (Twitter): @ISED_CA | Facebook: Canadian Innovation | Instagram: @cdninnovation | LinkedIn: Innovation, Science and Economic Development Canada
For easy access to government programs for businesses, download the Canada Business app.
SOURCE Innovation, Science and Economic Development Canada
Technology
Fragmented Web Strategies Leave Organizations Exposed as Digital Expectations Rise, Warns Info-Tech Research Group
Published
28 minutes agoon
July 24, 2026By
Organizations are increasingly focused on modernizing their digital presence to meet rising user expectations, yet many still rely on decentralized content models, inconsistent governance, and legacy platforms. New findings from Info-Tech Research Group show that without a structured web experience management (WEM) strategy, web initiatives often fail to align with business goals and user needs. The firm’s blueprint Develop Your Web Experience Management Strategy provides a five-phase framework and tools to help IT leaders strengthen governance and align web priorities with organizational objectives.
ARLINGTON, Va., July 24, 2026 /CNW/ — Organizations continue to invest in digital platforms and web modernization efforts, but progress is often limited by unclear priorities, inconsistent ownership, and a lack of shared performance measures. New insights from Info-Tech Research Group indicate that without a clear understanding of web experience maturity and readiness, digital investments fail to translate into consistent and measurable outcomes. The global research and advisory firm’s recently published blueprint, Develop Your Web Experience Management Strategy, provides a structured five-phase methodology to assess current-state capabilities, define priority audiences and journeys, and build a practical roadmap for evolving the web ecosystem in alignment with organizational objectives.
“Web experience management has moved beyond basic websites to become a core driver of growth and engagement,” says Hriday Gulrajani, senior research analyst at Info-Tech Research Group. “CIOs and IT leaders need to align marketing, data, and technology teams under clear governance and a structured roadmap to deliver consistent, scalable digital experiences.”
Info-Tech’s blueprint shows that many organizations treat web modernization as a technology upgrade rather than a coordinated experience strategy. As a result, content operations remain decentralized, integration between core systems such as CMS, CRM, and analytics platforms is inconsistent, and governance responsibilities are not clearly defined. While capabilities such as personalization, automation, and advanced analytics offer opportunities to improve engagement and operational efficiency, organizations often lack a structured framework for prioritizing initiatives and measuring progress across the web ecosystem.
Key Challenges IT Leaders Face in Web Experience Management
Despite ongoing investment in digital platforms and experience initiatives, many organizations encounter structural and operational barriers that limit progress. Info-Tech’s research highlights several persistent challenges:
Content decisions are often made in silos, resulting in inconsistent messaging, fragmented governance, and unclear ownership across teams.Limited integration between CMS, CRM, analytics, and other core systems restricts visibility into user behavior and makes it difficult to measure and improve web experience performance.Legacy platforms and constrained architectures limit personalization, automation, accessibility, and multichannel delivery capabilities.Misalignment between marketing, IT, and data teams slows decision-making and weakens the organization’s ability to evolve its web ecosystem strategically.
Info-Tech’s Practical Framework for Web Experience Management
To address these challenges, Info-Tech recommends a structured five-phase approach that connects organizational strategy, customer experience priorities, and web execution. The Develop Your Web Experience Management Strategy blueprint outlines the following priorities for CIOs and IT leaders:
Phase 1: Define Vision & Success Criteria – Align WEM objectives to organizational strategy, define strategic outcomes, and establish experience KPIs to measure performance across digital touchpoints.
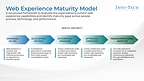
Phase 2: Assess Current State & Readiness – Use a web experience maturity model to evaluate capabilities across people, process, technology, and performance, and identify integration gaps and readiness risks.
Phase 3: Understand Audiences & Experience Priorities – Define priority personas, map end-to-end journeys, and translate organizational goals into structured web experience use cases prioritized by value and feasibility.
Phase 4: Architect & Govern the Ecosystem – Establish architecture principles, design the target-state WEM ecosystem, and define governance structures and operating models that clarify roles, ownership, and decision rights.
Phase 5: Launch, Communicate, & Measure – Develop a phased roadmap aligned to key value drivers, implement performance measurement frameworks, and enable continuous optimization across the web ecosystem.
Info-Tech’s Develop Your Web Experience Management Strategy blueprint is supported by a Web Experience Management Business Case Template and a Web Experience Initiatives Prioritization and Roadmap Planning Tool. These resources are designed to help CIOs and IT leaders build a clear case for modernization, prioritize initiatives based on value and feasibility, and develop phased roadmaps aligned to organizational objectives. By applying this framework and its supporting tools, organizations can strengthen governance, improve cross-functional alignment, and evolve their web ecosystem in a measurable and scalable way.
For exclusive and timely commentary from Info-Tech’s experts, including Hriday Gulrajani, and access to the complete Develop Your Web Experience Management Strategy blueprint, please contact pr@infotech.com.
About Info-Tech Research Group
Info-Tech Research Group is one of the world’s leading and fastest-growing research and advisory firms, serving over 30,000 IT, HR, and marketing professionals around the globe. As a trusted product and service leader, the company delivers unbiased, highly relevant research and industry-leading advisory support to help leaders make strategic, timely, and well-informed decisions. For nearly 30 years, Info-Tech has partnered closely with teams to provide everything they need, from actionable tools to expert guidance, ensuring they deliver measurable results for their organizations.
To learn more about Info-Tech’s HR research and advisory services, visit McLean & Company, and for data-driven software buying insights and vendor evaluations, visit the firm’s SoftwareReviews platform.
Media professionals can register for unrestricted access to research across IT, HR, and software, as well as hundreds of industry analysts through the firm’s Media Insiders program. To gain access, contact pr@infotech.com.
For information about Info-Tech Research Group or to access the latest research, visit infotech.com and connect via LinkedIn and X.
View original content to download multimedia:https://www.prnewswire.com/news-releases/fragmented-web-strategies-leave-organizations-exposed-as-digital-expectations-rise-warns-info-tech-research-group-302834308.html
SOURCE Info-Tech Research Group
Technology
In HelloNation, Custom Fabrication Expert Mark Coyle Explains What to Know Before Choosing an Aluminum Fabrication Partner
Published
28 minutes agoon
July 24, 2026By
The article explains how an integrated fabrication process supports better quality, efficiency, and long-term project success.
ROCHESTER, N.Y., July 24, 2026 /PRNewswire/ — What should someone look for before selecting an aluminum fabrication partner who can guide a project from the first design sketch through final delivery? That question is answered in a HelloNation article featuring insights from Custom Fabrication Expert Mark Coyle of American Custom Metals, Inc. in Rochester, New York, that explains how the full aluminum production workflow shapes accuracy, consistency, and long-term reliability. The article shows why a clear understanding of each stage in the process helps people make informed decisions before committing to a fabrication partner.
The article begins by explaining that aluminum fabrication involves far more than cutting or welding. It describes how every project moves through a connected chain of design support, extrusion, machining, finishing, and logistics. Each step affects the next, and the article notes that the best results come from choosing an aluminum fabrication partner who keeps these stages aligned. By showing how coordination prevents errors, the article gives readers a practical way to evaluate a potential shop.
Early design support is a major focus of the article. It states that many projects benefit when design engineering is handled in-house because small adjustments to a profile can influence strength, weight, and final performance. The HelloNation article explains that an aluminum fabrication partner with internal design capabilities can review shapes before tooling begins, reducing the risk of delays caused by unrealistic or difficult-to-extrude features. This design stage sets the direction for everything that follows, making it one of the most valuable parts of the process.
The article also examines extrusion, which it calls one of the most specialized stages in aluminum manufacturing. It notes that some shops do not extrude their own material, which forces them to rely on outside mills. That structure can lead to longer schedules and more points of communication. By contrast, an aluminum fabrication partner with direct access to extrusion equipment can control die design, schedule production runs, and manage metal flow more precisely. The article explains that this control reduces variation between batches, which supports stable timelines and more predictable quality.
Machining receives detailed attention as well. The article states that accuracy depends on how well each machine is calibrated for the specific alloy and geometry involved. It describes how a fabricator who machines their own extrusions becomes familiar with how those profiles respond to different tool paths and cutting forces. This familiarity supports tighter tolerances and more dependable results. The article explains that when machining is outsourced, the receiving shop may not know the conditions under which the material was extruded or aged, which can cause small adjustments that affect uniformity across long runs.
Finishing is another important stage explored in the article. It explains how anodizing, powder coating, polishing, or protective layers interact with thickness and alloy. The article notes that when finishing is spread across multiple vendors, the project moves more often, which increases the chance for delays or inconsistency. An aluminum fabrication partner with integrated finishing services can keep color and coating texture more uniform while maintaining a tighter schedule.
Logistics also plays a key role in the article’s guidance. It highlights that aluminum profiles, especially long or delicate ones, require thoughtful packaging, palletizing, and freight planning. A shop with its own logistics team can reduce damage risks and speed up the time between manufacturing and delivery. The article explains that when logistics is outsourced, communication slows down and the chances of errors increase, making it harder to keep a project on schedule.
Tolerance control is another subject the article describes. It explains that aluminum reacts to heat, pressure, and machining forces in predictable ways only when the team understands how the material was formed at every stage. The article notes that when extrusion, aging, machining, and inspection all occur within one operation, teams can maintain a closed loop of information. This reduces the risk of dimensional issues and strengthens consistency from batch to batch.
As the article moves toward its conclusion, it emphasizes that choosing the right aluminum fabrication partner comes down to understanding how many stages the shop directly manages. When a partner controls design, extrusion, machining, finishing, and logistics, communication becomes clearer, and the workflow becomes more predictable. The article explains that this unified structure allows teams to adjust quickly because they understand every step of the operation.
The article ends by stating that dependable performance in aluminum work depends on how well each stage connects to the next. A strong aluminum fabrication partner is defined not by one capability but by how the entire process fits together. This guidance gives readers a practical way to evaluate potential partners and make decisions that support long-term project success.
What to Know Before Choosing an Aluminum Fabrication Partner features insights from Mark Coyle, Custom Fabrication Expert of Rochester, NY, in HelloNation.
About HelloNation
HelloNation is America’s Good News Network, a premier media platform built on the idea that good news travels faster when real people tell real stories. Through its community-focused publications and innovative “edvertising” approach, HelloNation delivers content that informs, inspires, and spotlights the leaders making a meaningful impact in their communities.
View original content to download multimedia:https://www.prnewswire.com/news-releases/in-hellonation-custom-fabrication-expert-mark-coyle-explains-what-to-know-before-choosing-an-aluminum-fabrication-partner-302834344.html
SOURCE HelloNation
Secretary of State Belanger announces expansion of high-speed Internet access in Saskatchewan
Fragmented Web Strategies Leave Organizations Exposed as Digital Expectations Rise, Warns Info-Tech Research Group
In HelloNation, Custom Fabrication Expert Mark Coyle Explains What to Know Before Choosing an Aluminum Fabrication Partner
Send Rakhi to UK swiftly with UK Gifts Portal
Whiteboard Series with NEAR | Ep: 45 Joel Thorstensson from ceramic.network
New Gooseneck Omni Antennas Offer Enhanced Signals in a Durable Package
Why You Should Build on #NEAR – Co-founder Illia Polosukhin at CV Labs
Whiteboard Series with NEAR | Ep: 45 Joel Thorstensson from ceramic.network
NEAR End of Year Town Hall 2021: The Open Web World, MetaBUILD 2 Hackathon and 2021 recap
Trending
-
Coin Market5 days agoWill the US get CLARITY this week? Bitcoin’s new $80K target: Hodler’s Digest, July 19
-
Technology5 days ago“Every Day CO₂ Challenge”: More Than a Game, A New Way of Learning
-
Technology4 days agoTrakka Systems to Demonstrate Advanced ISR Capabilities at Farnborough International Airshow 2026
-
Technology5 days ago
China-Europe Youth Exchange Campaign: When Fashion Meets Football — A Green Pitch Appointment for Cross-Cultural Dialogue
-
Technology5 days agoPowering ASEAN’s Manufacturing Transformation: IME 2026 Connects Technology, Industry and Opportunity
-
Technology4 days agoSigneasy expands beyond eSignatures with Intelligent Contract Management for growing businesses
-
Technology5 days agoDBS named Asia’s Best Digital Bank by Euromoney, recognised for its AI leadership and responsible innovation
-
Technology4 days agoBOC Group Releases ADONIS 19.0 LTS to Bring Smarter Support into Everyday BPM Work