Technology
Calibration Management Software Market size is set to grow by USD 73.7 million from 2024-2028, Automation of calibration process boost the market, Technavio
Published
2 years agoon
By
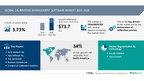
NEW YORK, July 4, 2024 /PRNewswire/ — The global calibration management software market size is estimated to grow by USD 73.7 million from 2024-2028, according to Technavio. The market is estimated to grow at a CAGR of over 3.73% during the forecast period. automation of calibration process is driving market growth, with a trend towards increased focus on predictive maintenance and analytics. However, threat of cyber-attacks poses a challenge. Key market players include ACG Infotech Ltd., Ape Software Inc., AVL List GmbH, Business Analysis Ltd., CompuCal Calibration Solutions, CyberMetrics Corp., Espresso Moon LLC, Fortive Corp., Hexagon AB, Humpage Technology Ltd., IndySoft Corp., Nagman Instruments and Electronics Pvt. Ltd., P.J. Bonner and Co. Ltd., Prime Technologies Inc., Productivity Quality Systems Inc., Quality America Inc., Qualityze Inc., QUBYX Software Technologies LTD., Sarlin Oy Ab, and Techgate LLC.
Get a detailed analysis on regions, market segments, customer landscape, and companies- View the snapshot of this report
Calibration Management Software Market Scope
Report Coverage
Details
Base year
2023
Historic period
2018 – 2022
Forecast period
2024-2028
Growth momentum & CAGR
Accelerate at a CAGR of 3.73%
Market growth 2024-2028
USD 73.7 million
Market structure
Fragmented
YoY growth 2022-2023 (%)
3.59
Regional analysis
North America, Europe, APAC, South America, and Middle East and Africa
Performing market contribution
North America at 34%
Key countries
US, China, Germany, UK, and Canada
Key companies profiled
ACG Infotech Ltd., Ape Software Inc., AVL List GmbH, Business Analysis Ltd., CompuCal Calibration Solutions, CyberMetrics Corp., Espresso Moon LLC, Fortive Corp., Hexagon AB, Humpage Technology Ltd., IndySoft Corp., Nagman Instruments and Electronics Pvt. Ltd., P.J. Bonner and Co. Ltd., Prime Technologies Inc., Productivity Quality Systems Inc., Quality America Inc., Qualityze Inc., QUBYX Software Technologies LTD., Sarlin Oy Ab, and Techgate LLC
Market Driver
Calibration management software with predictive analytics enables organizations to optimize their calibration activities, identifying potential equipment issues before they cause unplanned downtime. By analyzing historical data and equipment performance trends, calibration schedules can be adjusted based on actual usage and condition, maximizing performance and minimizing costs. This integration streamlines calibration processes, improving efficiency and productivity, and driving market growth during the forecast period.
The Calibration Management Software market is experiencing significant growth, with an increasing number of businesses recognizing the importance of accurate and efficient calibration processes. Utilities, manufacturing, and other sectors are adopting calibration software to manage their calibration activities. The market is trending towards solutions that offer real-time monitoring, automated scheduling, and comprehensive reporting. Calibration software enables companies to streamline their calibration processes, reduce downtime, and ensure regulatory compliance. Additionally, cloud-based solutions are gaining popularity due to their flexibility and accessibility. Overall, calibration management software is a valuable investment for businesses seeking to optimize their operations and maintain high-quality standards.
Research report provides comprehensive data on impact of trend. For more details- Download a Sample Report
Market Challenges
• The calibration management software market is experiencing a shift towards automated smart manufacturing technologies. While this brings operational efficiencies, it also introduces cybersecurity risks. Data vulnerability increases as software and connected technologies are housed on software providers’ servers. Unauthorized access can lead to data theft and manipulation. Primary threats include operational downtime, product development manipulation, and sensitive information theft. Ransomware attacks are common, targeting industries like medical devices, consumer durables, and automotive. Security upgrades and IoT integration increase operational expenses. North America and Europe are major vulnerable regions. IoT use in calibration software management may hinder market growth due to heightened security concerns.
• The Calibration Management Software market faces several challenges in ensuring accurate and efficient operations. One challenge is the integration of various calibration systems and technologies, such as IoT, analytics, and automation. Another challenge is ensuring data accuracy and security, as well as complying with industry regulations and standards. Additionally, managing a large number of calibration tasks and assets can be complex, requiring robust and scalable software solutions. Furthermore, the need for real-time monitoring and reporting adds to the complexity of calibration management. Lastly, the cost of implementing and maintaining these software solutions can be a significant challenge for organizations.
For more insights on driver and challenges – Request a sample report!
Segment Overview
This calibration management software market report extensively covers market segmentation by
Technology 1.1 Locally installed1.2 Cloud-basedApplication 2.1 Large enterprise2.2 Small and medium enterpriseGeography 3.1 North America3.2 Europe3.3 APAC3.4 South America3.5 Middle East and Africa
1.1 Locally installed- The locally installed calibration management software market is thriving due to enhanced security features. With on-premise systems and servers, data access is restricted to license holders, eliminating potential security risks. Offline accessibility allows users to access data regardless of internet connection. Although requiring additional IT support and hardware components, the cost efficiency attracts Small and Medium Enterprises (SMEs), driving market growth.
For more information on market segmentation with geographical analysis including forecast (2024-2028) and historic data (2017-2021) – Download a Sample Report
Research Analysis
The Calibration Management Software market caters to various industries, including the Biotechnology and Energy sectors, as well as Utilities and Renewable Energy. This software facilitates the procurement of calibration instruments such as Analog multimeters, Calipers, Chart recorders, Clamp-on ammeters, Data loggers, Dial indicators, Digital multimeters, Force gauges, Micrometers, Oscilloscopes, and other measuring devices. It ensures Instrument management by providing accurate and reliable calibration services, minimizing Inaccuracy and uncertainty, and maintaining Normal values. Engineers in these sectors rely on this software to obtain the True value of their measurements, enhancing overall operational efficiency and productivity.
The Calibration Management Software market encompasses solutions designed to streamline and optimize the calibration process across various industries. These solutions enable organizations to manage and track calibration activities, schedule preventive maintenance, and ensure regulatory compliance. The software often includes features such as real-time monitoring, automated alerts, and reporting capabilities. Calibration management systems are essential for maintaining the accuracy and reliability of equipment and instruments, thereby improving overall operational efficiency and productivity. Additionally, cloud-based solutions offer remote access and real-time data sharing, enhancing collaboration and streamlining workflows.
Table of Contents:
1 Executive Summary
2 Market Landscape
3 Market Sizing
4 Historic Market Size
5 Five Forces Analysis
6 Market Segmentation
TechnologyLocally InstalledCloud-basedApplicationLarge EnterpriseSmall And Medium EnterpriseGeographyNorth AmericaEuropeAPACSouth AmericaMiddle East And Africa
7 Customer Landscape
8 Geographic Landscape
9 Drivers, Challenges, and Trends
10 Company Landscape
11 Company Analysis
12 Appendix
About Technavio
Technavio is a leading global technology research and advisory company. Their research and analysis focuses on emerging market trends and provides actionable insights to help businesses identify market opportunities and develop effective strategies to optimize their market positions.
With over 500 specialized analysts, Technavio’s report library consists of more than 17,000 reports and counting, covering 800 technologies, spanning across 50 countries. Their client base consists of enterprises of all sizes, including more than 100 Fortune 500 companies. This growing client base relies on Technavio’s comprehensive coverage, extensive research, and actionable market insights to identify opportunities in existing and potential markets and assess their competitive positions within changing market scenarios.
Contacts
Technavio Research
Jesse Maida
Media & Marketing Executive
US: +1 844 364 1100
UK: +44 203 893 3200
Email: media@technavio.com
Website: www.technavio.com/
View original content to download multimedia:https://www.prnewswire.com/news-releases/calibration-management-software-market-size-is-set-to-grow-by-usd-73-7-million-from-2024-2028–automation-of-calibration-process-boost-the-market-technavio-302188825.html
SOURCE Technavio
You may like
Technology
TOTAL PLAY ANNOUNCES REVENUE OF Ps.11,177 MILLION AND EBITDA OF Ps.4,849 MILLION IN THE FIRST QUARTER OF 2026
Published
50 minutes agoon
April 24, 2026By
—Growth of 115,020 net subscribers in Totalplay Residencial in the period strengthens the company’s service revenues—
—EBITDA less Capex and interest reached Ps.883 million, the highest level ever recorded for a first quarter—
—A 9% reduction in debt with cost from loans provides additional strength to the company’s capital structure—
MEXICO CITY, April 23, 2026 /PRNewswire/ — Total Play Telecomunicaciones, S.A.P.I. de C.V. (“Total Play”), a leading telecommunications company in Mexico, which offers internet access, pay television and telephony services, through one of the largest 100% fiber optic networks in the country, announced today financial results for the first quarter of 2026.
“The growing preference of millions of homes for our technologically advanced internet services, with superior stability and speed, resulted in a net increase of 115,020 subscribers in the quarter, which continued to drive the company’s revenue,” commented Eduardo Kuri, CEO of Total Play. “The growth of our operations was consistent with the Capex which represented only 22% of revenue, and interest payments that decreased double-digit, in the context of lower debt with cost at the company. This resulted in a 51% increase in cash generation — defined as EBITDA less Capex and interest paid — reaching a record high of Ps.883 million in the period.”
“Regarding the balance sheet, we began this quarter with the amortization schedule for the Senior Secured Notes due 2028 — through a principal payment of US$15 million for the period — which adds to the US$56 million amortization of the remaining balance of the Senior Notes due in 2025 — done in the previous quarter — which, among other debt payments, contributed to a 9% reduction in our balance of debt with cost from loans,” added Mr. Kuri. “Simultaneously, we were able to decrease our lease liabilities by 30% and our trade payables by 22%, further strengthening Total Play’s solid capital structure.”
First quarter results
Revenue for the quarter was Ps.11,177 million, 3% higher than Ps.10,843 million for the same period of the previous year. Total costs and expenses were Ps.6,328 million, compared to Ps.5,761 million in the prior year.
As a result, Total Play’s EBITDA was Ps.4,849 million, from Ps.5,082 million a year ago; the quarter’s EBITDA margin was 43%. The company reported operating profit of Ps.301 million, compared to Ps.763 million a year earlier.
Total Play reported a net loss of Ps.1,327 million from a loss of Ps.1,961 million in the same quarter of 2025.
Q1 2025
Q1 2026
Change
Ps.
%
Revenue from services
$10,843
$11,177
$334
3 %
EBITDA
$5,082
$4,849
$(233)
(5) %
Operating income
$763
$301
$(462)
(61) %
Net result
$(1,961)
$(1,327)
$634
32 %
Amounts in millions of pesos.
EBITDA: Earnings before interest, taxes, depreciation, and amortization.
Revenue from services
The company’s revenue increased 3%, as a result of 3% growth in sales in the residential segment and 4% growth in revenue from the enterprise segment.
Totalplay Residential’s revenue increase to Ps.9,848 million, up from Ps.9,570 million the previous year, is related to a 4% increase in the number of the company’s service subscribers compared to the same quarter of the previous year, reaching 5,554,374 this period — a figure that includes 67,856 small and medium-sized businesses. Compared to the previous quarter, the subscriber base increased by 115,020 users. The company believes that the number of subscribers achieved this quarter reflects its remarkable ability to offer technologically advanced internet services — with superior stability and speed — continuous innovation in its entertainment platform, and service excellence.
Average revenue per subscriber (ARPU) for the quarter was Ps.588, compared to Ps.597 a year ago. The decrease in ARPU is largely related to a growing proportion of double-play subscribers compared to triple-play subscribers within the total residential subscriber base.
The number of homes passed by Total Play in Mexico at the end of this period was 19.5 million, compared to 17.6 million a year ago.
Penetration — the proportion of homes passed by Total Play that have the company’s telecommunications services — was 28.5% at the end of the quarter from 30.2% a year ago.
Revenue from the enterprise segment was Ps.1,329 million, up from Ps.1,273 million in the previous year, as a result of contracting Total Play services for the development of corporate client projects.
Costs and expenses
Total costs and expenses increased 10% as a result of a 4% increase in service costs and a 12% increase in expenses.
The increase in costs to Ps.1,663 million from Ps.1,597 million in the previous year, results mainly from higher costs related to memberships, maintenance and support, partially offset by lower content costs — as a result of a higher proportion of double play users in the mix of residential service subscribers and the negotiation of terms, in an optimal way, with content producers —.
The increase in expenses to Ps.4,665 million from Ps.4,164 million reflects higher maintenance, personnel, advertising and promotion expenses, in the context of the company’s growing operations.
EBITDA and net result
Total Play’s EBITDA was Ps.4,849 million compared to Ps.5,082 million the previous year.
Relevant variations below EBITDA were the following:
An increase of Ps.229 million in depreciation and amortization, as a result of user acquisition costs — telecommunications equipment, labor and installation in the period.
A Decrease of Ps.189 million in accrued interest payable, in the context of reducing the company’s debt with cost balance during the period.
Changes in the fair value of financial instruments of Ps.921 million, due to costs related to hedging options in the previous year.
Other financial income of Ps.31 million, compared to other expenses of Ps.200 million in the previous year, as a result of costs related to debt issuances a year ago.
A, increase of Ps.109 million in exchange losses as a result of net liability monetary position in foreign currency, together with greater depreciation of the peso against the basket of currencies in which the company’s monetary liabilities are denominated this quarter, compared to the previous year.
Total Play reported a net loss of Ps.1,327 million from a net loss of Ps.1,961 million in the same period of 2025.
Balance sheet
As of March 31, 2026, the company’s debt with cost from loans was Ps.55,477 million, 9% lower than the Ps.60,806 million of the previous year. The reduction resulted from various debt with cost amortizations during the period, including US$15 million of the company’s Senior Secured Notes due 2028 this quarter and US$56 million of the remaining Senior Notes due 2025, done last November, partially offset by the issuance of US$200 million in Additional Notes to the Senior Secured Notes due 2032, announced in April 2025.
Lease liabilities were Ps.2,756 million, 30% lower compared to Ps.3,917 million in the previous year.
Cash and cash equivalents, as well as restricted cash in trusts, was Ps.6,477 million, compared to Ps.10,008 million a year ago. As a result, the company’s net debt was Ps.51,756 million, 5% lower compared to Ps.54,715 million in the previous year.
The debt ratio — Net Debt / EBITDA of the last two quarters annualized — was 2.62 times.
Total Play’s fixed assets — which include accumulated investment in fiber optics, telecommunications equipment and subscriber acquisition costs, among other assets — were Ps.79,312 million, compared to Ps.85,944 million a year ago.
About Total Play
Total Play is a leading Triple Play provider in Mexico that, thanks to the widest direct-to-home fiber optic network in the country, offers entertainment and technologically advanced services with the highest quality and speed in the market. For the latest news and updates about Total Play, visit: www.totalplay.com.mx.
Total Play is a Grupo Salinas company (www.gruposalinas.com), a group of dynamic, fast-growing, and technologically advanced companies focused on creating economic value through market innovation and goods and services that improve standards of living; social value to improve community well-being; and environmental value by reducing the negative impact of its business activities. Created by Mexican entrepreneur Ricardo B. Salinas (www.ricardosalinas.com), Grupo Salinas operates as a management development and decision forum for the top leaders of member companies. Each of the Grupo Salinas companies operates independently, with its own management, board of directors, and shareholders. Grupo Salinas has no equity holdings. The group of companies shares a common vision, values, and strategies for achieving rapid growth, superior results, and world-class performance.
Except for historical information, the matters discussed in this press release are concepts about the future that involve risks and uncertainty that may cause actual results to differ materially from those projected. Other risks that may affect Total Play and its subsidiaries are presented in documents sent to the securities authorities.
Investor Relations:
Bruno Rangel
Rolando Villarreal
+ 52 (55) 1720 9167
+ 52 (55) 1720 9167
jrangelk@totalplay.com.mx
rvillarreal@totalplay.com.mx
Press Relations:
Luciano Pascoe
Tel. +52 (55) 1720 1313 ext. 36553
lpascoe@gruposalinas.com.mx
TOTAL PLAY TELECOMUNICACIONES, S.A.P.I. DE C.V.
Consolidated Quarterly Income Statements
(Millions of Mexican pesos)
1Q 25
1Q 26
Change
$
%
$
%
$
%
Revenue from services
10,843
100 %
11,177
100 %
334
3 %
Cost of services
(1,597)
(15 %)
(1,663)
(15 %)
(66)
(4 %)
Gross profit
9,246
85 %
9,514
85 %
268
3 %
General expenses
(4,164)
(38 %)
(4,665)
(42 %)
(501)
(12 %)
EBITDA
5,082
47 %
4,849
43 %
(233)
(5 %)
Depreciation and amortization
(4,319)
(40 %)
(4,548)
(41 %)
(229)
(5 %)
Operating profit
763
7 %
301
3 %
(462)
(61 %)
Financial cost:
Interest revenue
56
1 %
30
0 %
(26)
(46 %)
Accrued interest expense
(1,770)
(16 %)
(1,581)
(14 %)
189
11 %
Change in fair value of financial instruments
(924)
(9 %)
(3)
(0 %)
921
100 %
Other financial (expenses) income
(200)
(2 %)
31
0 %
231
—
Foreign exchange (loss) – Net
(40)
(0 %)
(149)
(1 %)
(109)
n.m.
(2,878)
(27 %)
(1,672)
(15 %)
1,206
42 %
Loss before income tax provisions
(2,115)
(20 %)
(1,371)
(12 %)
744
35 %
Income tax provision
154
1 %
44
0 %
(110)
(71 %)
Net loss for the period
(1,961)
(18 %)
(1,327)
(12 %)
634
32 %
TOTAL PLAY TELECOMUNICACIONES, S.A.P.I. DE C.V.
Consolidated Statements of Financial Position
(Millions of Mexican pesos)
As of March 2025
As of March 2026
Cambio
$
%
$
%
$
%
ASSETS
Current Assets:
Cash and cash equivalents
7,132
6 %
4,342
4 %
(2,790)
(39 %)
Restricted cash in trusts
2,876
3 %
2,135
2 %
(741)
(26 %)
Customers – net
2,902
3 %
3,016
3 %
114
4 %
Recoverable taxes
3,365
3 %
2,293
2 %
(1,072)
(32 %)
Inventories
2,416
2 %
2,146
2 %
(270)
(11 %)
Derivative financial instruments
193
0 %
–
0 %
(193)
(100 %)
Other current assets
873
1 %
883
1 %
10
1 %
Total current assets
19,757
18 %
14,815
15 %
(4,942)
(25 %)
Non-Current Assets:
Property, plant and equipmente – Net
85,944
77 %
79,312
81 %
(6,632)
(8 %)
Rights-of-use assets -Net
2,849
3 %
1,652
2 %
(1,197)
(42 %)
Trademarks and other assets
2,620
2 %
2,464
3 %
(156)
(6 %)
Total non-current assets
91,413
82 %
83,428
85 %
(7,985)
(9 %)
Total assets
1,11,170
100 %
–
98,243
100 %
(12,927)
(12 %)
LIABILITIES AND STOCKHOLDERS’ EQUITY
Short-Term Liabilities
Financial debt
9,240
8 %
5,435
6 %
(3,805)
(41 %)
Lease liabilities
2,367
2 %
1,749
2 %
(618)
(26 %)
Trade payables
12,719
11 %
9,913
10 %
(2,806)
(22 %)
Reverse factoring
1,483
1 %
278
0 %
(1,205)
(81 %)
Other short-term liabilities
3,814
3 %
3,255
3 %
(559)
(15 %)
Total short-term liabilities
29,623
27 %
20,630
21 %
(8,993)
(30 %)
Long-Term Liabilities
Financial debt
51,566
46 %
50,042
51 %
(1,524)
(3 %)
Lease liabilities
1,550
1 %
1,007
1 %
(543)
(35 %)
Employee benefits
101
0 %
148
0 %
47
47 %
Deferred income tax
12,950
12 %
13,741
14 %
791
6 %
Total liabilities
95,790
86 %
85,568
87 %
(10,222)
(11 %)
EQUITY:
Capital stock
8,201
7 %
8,060
8 %
(141)
(2 %)
Retained earnings
(15,836)
(14 %)
(17,171)
(17 %)
(1,335)
(8 %)
Other comprehensive income
23,015
21 %
21,786
22 %
(1,229)
(5 %)
Total equity
15,380
14 %
12,675
13 %
(2,705)
(18 %)
Total liabilities and equity
1,11,170
100 %
98,243
100 %
(12,927)
(12 %)
TOTAL PLAY TELECOMUNICACIONES, S.A.P.I. DE C.V.
Consolidated Statements of Cash Flows
(Millions of Mexican pesos)
3M 25
3M 26
$
$
Operating activities:
Loss before income tax provision
(2,115)
(1,371)
Items not requiring the use of resources:
Depreciation and amortization
4,320
4,548
Employee benefits
9
10
Items related to investing or financing activities:
Accrued interest income
(56)
(30)
Accrued interest expense
1,770
1,581
Other financial transactions
1,122
(27)
Unrealized exchange (gain) loss
(89)
262
4,961
4,973
Resources (used in) generated by operating activities:
Customers and unearned revenue
315
134
Other receivables
–
2
Related parties, net
53
(104)
Taxes to be recovered
353
260
Inventories
292
400
Advance payments
(76)
(179)
Trade payables
(906)
(1,092)
Other payables
299
434
Cash flows generated by operating activities
5,291
4,828
Investing activities:
Acquisition of property, plant and equipment
(2,601)
(2,425)
Other assets
(234)
75
Collected interest
56
31
Cash flows used in investing activities
(2,779)
(2,319)
Financing activities:
Capital repayments
–
–
Loans (paid) received
4,312
(58)
Leasing cash flows
(822)
(449)
Restricted Cash in Trusts
(488)
(371)
Reverse factoring
(107)
(80)
Derivative financial instruments
265
–
Interest payment
(1,895)
(1,541)
Cash flows used in financing activities
1,265
(2,499)
Net increase in cash and cash equivalents
3,777
10
Cash and cash equivalents at the beginning of the year
3,355
4,332
Cash and cash equivalents at the end of the year
7,132
4,342
View original content:https://www.prnewswire.com/news-releases/total-play-announces-revenue-of-ps11-177-million-and-ebitda-of-ps4-849-million-in-the-first-quarter-of-2026–302752403.html
SOURCE Total Play Telecomunicaciones, S.A.P.I. de C.V.
Technology
QNAP Launches QSW-M7230-2X4F24T L3 Lite 100GbE Managed Switch, Featuring MC-LAG and AVoIP
Published
50 minutes agoon
April 24, 2026By
TAIPEI, April 23, 2026 /PRNewswire/ — QNAP® Systems, Inc., a leading computing, networking, and storage solution innovator, today announced the launch of the QSW-M7230-2X4F24T, a new L3 Lite managed 100GbE switch designed for enterprise network upgrades, high-performance storage environments, large-scale media production, virtualization, and AI-driven workloads. The new switch enables organizations to build a scalable 100GbE core network while maintaining cost efficiency and protecting existing infrastructure investments.
As data-intensive applications continue to accelerate—from AI computing and virtualization to collaborative media workflows—enterprises are increasingly challenged to evolve beyond 10GbE networks without incurring disruptive, large-scale replacements. The QSW-M7230-2X4F24T addresses this transition by providing a flexible, multi-speed architecture that allows enterprises to introduce higher-speed connectivity where it matters most, while expanding the core network over time.
Featuring 100GbE backbones, 25GbE server uplinks, and 24-port 10GbE access, the QSW-M7230-2X4F24T offers seamless multi-speed integration. It allows enterprises to deploy high-performance 25GbE/100GbE where needed while preserving existing 10GbE assets, effectively minimizing upgrade complexity and maximizing infrastructure value.
“By combining 100GbE, 25GbE, and high-density 10GbE connectivity in a 1U form factor, the QSW-M7230-2X4F24T delivers exceptional flexibility and cost efficiency among its class,” said Ronald Hsu, Product Manager at QNAP. “It is an ideal solution for enterprises seeking a practical path to 100GbE without compromising current investments or future scalability.”
Optimized for AI and high-performance storage, the QSW-M7230-2X4F24T offers 10G/25G/100G multi-speed links with a 1080Gbps capacity, supporting PFC and ECN for lossless Ethernet. It combines L3 Lite management (including static routing and advanced VLANs) with an MC-LAG architecture to provide enhanced network resilience and high availability, ensuring uninterrupted service and eliminating single points of failure for critical business infrastructure.
For media and AV over IP deployments, the switch further strengthens multicast control and time synchronization. With support for IGMP Snooping, VLAN-based traffic segmentation, and a high-precision clock with PTP Boundary Clock, the QSW-M7230-2X4F24T minimizes audio-video synchronization issues commonly encountered in multi-display environments. This makes it well suited for broadcast production, live event venues, command centers, and enterprise video applications.
In addition, the QSW-M7230-2X4F24T supports AMIZcloud, QNAP’s cloud-based centralized management platform. Without requiring additional hardware or software controllers, IT teams can remotely monitor and manage multiple switches across locations, simplifying troubleshooting and reducing ongoing operational overhead.
For more information and to view the full QNAP lineup, please visit www.qnap.com.
View original content to download multimedia:https://www.prnewswire.com/news-releases/qnap-launches-qsw-m7230-2x4f24t-l3-lite-100gbe-managed-switch-featuring-mc-lag-and-avoip-302745716.html
SOURCE QNAP Systems, Inc.
Technology
SnapInspect Now Fully Qualified Yardi® Ecosystem Partner
Published
50 minutes agoon
April 24, 2026By
Interface is available now to SnapInspect clients using Yardi Voyager®
DALLAS, April 24, 2026 /PRNewswire/ — SnapInspect today announced it is now a fully qualified Yardi® Standard Interface Vendor, joining the approved network for Yardi, the leading provider of connected real estate software solutions. With this interface, companies using Yardi Voyager® can access their property management system data via the interface with SnapInspect.
With a focus on streamlining operations and increasing efficiency, Yardi Voyager and its single connected solution suite allow companies to manage operations, execute leasing, run analytics, and provide effective resident, owner and investor services. By interfacing with Yardi, vendors can provide Yardi clients with solutions that empower them within the Yardi ecosystem.
The Yardi ecosystem services the most vendors, APIs, units and square footage in the industry with more than 450 active interface partners in the Yardi network. Yardi’s goal is to make it easier for clients to choose best-for-you products that allow harmony across the many platforms they use. Yardi welcomes SnapInspect to the most robust platform ecosystem in the real estate industry.
“Commercial property teams have always had the data; they just haven’t always had it in one place. This integration closes the gap between inspections and maintenance operations, so every inspection finding flows directly into a work order, and everything is visible between profiles,” said new Yardi interface vendor, SnapInspect
For the complete list of the Yardi ecosystem, please visit: yardi.com/interface-vendors.
About Yardi
Yardi® develops industry-leading software for all types and sizes of real estate companies across the world. With over 10,000 employees, Yardi is working with our clients to drive significant innovation in the real estate industry. For more information on how Yardi is Energized for Tomorrow, visit yardi.com.
About SnapInspect
SnapInspect is a cloud-based property inspection software platform used by property managers, asset owners, and enterprise operators across the USA, Canada, and Dubai. The platform enables teams to conduct detailed property inspections, generate professional condition reports instantly, and track property maintenance analytics and asset condition data across entire portfolios. SnapInspect integrates natively with leading property management systems as a qualified interface vendor. Learn more at www.snapinspect.com
Photo – https://mma.prnewswire.com/media/2964560/Image.jpg
View original content:https://www.prnewswire.co.uk/news-releases/snapinspect-now-fully-qualified-yardi-ecosystem-partner-302752418.html
TOTAL PLAY ANNOUNCES REVENUE OF Ps.11,177 MILLION AND EBITDA OF Ps.4,849 MILLION IN THE FIRST QUARTER OF 2026
QNAP Launches QSW-M7230-2X4F24T L3 Lite 100GbE Managed Switch, Featuring MC-LAG and AVoIP
SnapInspect Now Fully Qualified Yardi® Ecosystem Partner
Send Rakhi to UK swiftly with UK Gifts Portal
Whiteboard Series with NEAR | Ep: 45 Joel Thorstensson from ceramic.network
New Gooseneck Omni Antennas Offer Enhanced Signals in a Durable Package
Why You Should Build on #NEAR – Co-founder Illia Polosukhin at CV Labs
Whiteboard Series with NEAR | Ep: 45 Joel Thorstensson from ceramic.network
NEAR End of Year Town Hall 2021: The Open Web World, MetaBUILD 2 Hackathon and 2021 recap
Trending
-
Technology4 days agoHarmonic Enables DIRECTV to Reimagine Nationwide DTH Service
-
Coin Market4 days agoCloud hosting firm Vercel confirms ‘limited’ hack of user info
-
Technology4 days agoThe Plumbing Sales Coach expands offerings with new Blueprint training program
-
Coin Market2 days agoKalshi mulls crypto expansion with perpetual futures launch: Report
-
Technology5 days agoTCL Solar: Powering Pakistan with advanced solar module innovation
-
Technology5 days agoTCL Solar: Powering Pakistan with advanced solar module innovation
-
Technology4 days agoTVU Networks and Tencent Cloud Unveil Next-Generation Cloud Production Solution at NAB 2026
-
Technology5 days agoBREAKTHROUGH PRIZE ANNOUNCES 2026 LAUREATES
