
Technology
CBIZ REPORTS SECOND-QUARTER AND FIRST-HALF 2024 RESULTS AND ANNOUNCES AGREEMENT TO ACQUIRE MARCUM
Published
2 years agoon
By
SECOND-QUARTER HIGHLIGHTS:
TOTAL REVENUE UP 5.4%; SAME-UNIT REVENUE UP 2.8%GAAP EPS DOWN 26.4%; ADJUSTED EPS DOWN 9.1%; INCLUDES MARCUM ACQUISITION-RELATED EXPENSE OF $6.7MNET INCOME DOWN 26.3%; ADJUSTED EBITDA DOWN 6.9%
SIX-MONTH HIGHLIGHTS:
TOTAL REVENUE UP 7.2%; SAME-UNIT REVENUE UP 4.4%GAAP EPS DOWN 3.0%; ADJUSTED EPS UP 1.5%; INCLUDES MARCUM ACQUISITION-RELATED EXPENSE OF $6.7MNET INCOME DOWN 3.3%; ADJUSTED EBITDA UP 1.0%
CLEVELAND, July 31, 2024 /PRNewswire/ — CBIZ, Inc., (NYSE: CBZ) (“CBIZ” or the “Company”), a leading provider of financial, insurance and advisory services, today announced results for the second quarter and six months ended June 30, 2024.
In a separate press release issued today, CBIZ also announced it has entered into a definitive agreement to acquire Marcum LLP (“Marcum”), a national accounting and advisory firm. Upon closing, CBIZ will become the seventh-largest accounting services provider in the U.S. The cash-and-stock transaction valued at approximately $2.3 billion is expected to close in the fourth quarter. CBIZ incurred approximately $6.7 million in fees related to the Marcum transaction and results for the second quarter are impacted by $0.10 per share. The press release announcing this transaction is available on CBIZ’s website at https://cbiz.gcs-web.com/investor-overview.
Second-Quarter and First-Half 2024 Results
During the 2024 second quarter, CBIZ experienced the departure of a small group of producers and support staff within our Property and Casualty business and a loss of clients served by this group. Included in reported results is the impact of $0.03 in Adjusted earnings per share for the 2024 second quarter and first half. The impact to full-year 2024 Adjusted earnings per share is expected to be approximately $0.06.
For the 2024 second quarter, CBIZ recorded revenue of $420.0 million, an increase of $21.5 million, or 5.4%, compared with $398.5 million reported for the same period in 2023. Acquired operations contributed $10.5 million, or 2.6%, to second-quarter 2024 revenue growth. Same-unit revenue increased by $11.0 million, or 2.8%, for the quarter, compared with the same period a year ago. Net income was $19.8 million, or $0.39 per diluted share, for the quarter, compared with $26.9 million, or $0.53 per diluted share, for the same period a year ago.
For the six months ended June 30, 2024, CBIZ recorded revenue of $914.3 million, an increase of $61.2 million, or 7.2%, over the $853.1 million recorded for the same period in 2023. Acquired operations contributed $23.3 million, or 2.7%, to revenue growth in the six months ended June 30, 2024. Same-unit revenue increased by $37.9 million, or 4.4%, for the six months ended June 30, 2024, compared with the same period a year ago. Net income was $96.7 million, or $1.92 per diluted share, for the six months ended June 30, 2024, compared with $100.0 million, or $1.98 per diluted share, for the same period a year ago.
Excluding nonrecurring acquisition-related integration expenses and professional fees incurred related to the Marcum transaction, Adjusted net income was $25.0 million in the second quarter of 2024, compared with Adjusted net income of $27.6 million for the same period a year ago. Adjusted earnings per share was $0.50 for the second quarter of 2024, a decrease of 9.1%, compared with Adjusted earnings per share of $0.55 for the same period a year ago. Adjusted EBITDA for the second quarter of 2024 was $50.7 million, down 6.9%, compared with $54.4 million for the same period in 2023.
For the six months ended June 30, 2024, Adjusted net income was $102.5 million, compared with Adjusted net income of $102.0 million for the same period a year ago. Adjusted earnings per share was $2.04 for the six months ended June 30, 2024, an increase of 1.5%, compared with Adjusted earnings per share of $2.01 for the same period a year ago. Adjusted EBITDA for the six months ended June 30, 2024, was $169.5 million, compared with $167.8 million for the same period in 2023.
Schedules reconciling Adjusted net income, Adjusted earnings per share and Adjusted EBITDA to the most directly comparable GAAP measures can be found in the tables included at the end of this release.
The balance outstanding on the Company’s unsecured credit facility on June 30, 2024, was $381.0 million, with $209.8 million of unused borrowing capacity.
CEO Commentary
Jerry Grisko, CBIZ President and Chief Executive Officer, said, “We are pleased to report that our second-quarter results were generally in line with our expectations and that the overall health of our business remains strong. At the same time, we did experience a small number of unique headwinds that impacted our results for the quarter. Among these headwinds were the exit of a small group of producers from our Property and Casualty Insurance business and some evidence of clients delaying investment decisions and tightening discretionary spending. While our clients remain largely optimistic about the second half of the year, we find that any uncertainty in the market is amplified in an election year given concerns around regulations and interest rates. The nature of our resilient business model, with a high rate of recurring revenue and variable expense, enables us to maintain our performance even in less predictable business conditions.”
Grisko continued, “This morning we announced our agreement to acquire Marcum. After closing, the new, combined business will solidify our position as a leading provider of professional services to middle market businesses and is projected to be accretive to Adjusted Earnings in its first full year of operations. On a combined basis, we will become the seventh-largest accounting services provider in the country with revenues of approximately $2.8 billion, will employ over 10,000 team members and will serve more than 135,000 clients with a unique breadth of services and depth of expertise, including Benefits & Insurance services. We are excited about our future together and the opportunities this will provide to our people, the solutions we will bring to our clients, and the value we expect to create for our shareholders.”
2024 Outlook
With an expected close in fourth quarter of 2024, our current guidance excludes the impact of the Marcum acquisition. Based on expectations for the remainder of 2024, and due to the projected $0.06 per share full year impact of the loss of Property and Casualty business, the Company expects the following:
Total revenue to grow within a range of 7% to 9% over the prior year.Effective tax rate of approximately 28%.Weighted average fully diluted share count of approximately 50.0 to 50.5 million shares.GAAP fully diluted earnings per share to grow within a range of 6% to 8%, to $2.53 to $2.58 per share, compared with the $2.39 per share reported for 2023.Adjusted fully diluted earnings per share to grow within a range of 10% to 12%, to $2.64 to $2.69 per share, compared with the $2.41 per share reported for 2023.
Conference Call
CBIZ will host a conference call at 11 a.m. (ET) today to discuss its second-quarter and first-half financial results as well as the Marcum acquisition announcement. The call will be webcast and an archived replay will be available at https://cbiz.gcs-web.com/investor-overview. Participants can register at https://dpregister.com/sreg/10191052/fd1f3d903c.
About CBIZ
CBIZ is a leading provider of financial, insurance and advisory services to businesses throughout the United States. Financial services include accounting, tax, government health care consulting, transaction advisory, risk advisory, and valuation services. Insurance services include employee benefits consulting, retirement plan consulting, property and casualty insurance, payroll, and human capital consulting. With more than 120 offices in 33 states, CBIZ is one of the largest accounting and insurance brokerage providers in the U.S. For more information, visit www.cbiz.com.
Forward-Looking Statements
Forward-looking statements in this release are made pursuant to the safe harbor provisions of the Private Securities Litigation Reform Act of 1995. Such forward-looking statements are subject to certain risks and uncertainties that could cause actual results to differ materially from those projected. Such risks and uncertainties include, but are not limited to: we may be more sensitive to revenue fluctuations than other companies, which could result in fluctuations in the market price of our common stock; payments on accounts receivable may be slower than expected, or amounts due on receivables or notes may not be fully collectible; we are dependent on the services of our executive officers, other key employees, producers and service personnel, the loss of whom may have a material adverse effect on our business, financial condition and results of operations; restrictions imposed by independence requirements and conflict of interest rules may limit our ability to provide services to clients of the attest firms with which we have contractual relationships and the ability of such attest firms to provide attestation services to our clients; our goodwill and intangible assets could become impaired, which could lead to material non-cash charges against earnings; certain liabilities resulting from acquisitions are estimated and could lead to a material non-cash impact on earnings; governmental regulations and interpretations are subject to changes, which could have a material adverse effect on our clients, our business, our business services operations, our business models, or our revenue; changes in the United States healthcare or public health environment, including new healthcare legislation or regulations, may adversely affect the revenue and margins in our or our clients’ businesses; we are subject to risks relating to processing customer transactions for our payroll and other transaction processing businesses; cyber-attacks or other security breaches involving our computer systems or the systems of one or more of our vendors or clients could materially and adversely affect our business; we are subject to risk as it relates to software that we license from third parties; we could be held liable for errors and omissions, contract claims, or other litigation judgments or expenses; the future issuance of additional shares could adversely affect the price of our common stock; our principal stockholders may have substantial control over our operations; we require a significant amount of cash for interest payments on our debt and to expand our business as planned; terms of our credit facility may adversely affect our ability to run our business and/or reduce stockholder returns; our failure to satisfy covenants in our debt instruments could cause a default under those instruments; we are reliant on information processing systems and any failure of these systems could have a material adverse effect on our business, financial condition and results of operations; we may not be able to acquire and finance additional businesses which may limit our ability to pursue our business strategy; the business services industry is competitive and fragmented; if we are unable to compete effectively, our business, financial condition and results of operations may be negatively impacted; there is volatility in our stock price.
With respect to the agreement to acquire Marcum, such risks and uncertainties include, but are not limited to: the ability of the parties to consummate the transaction in a timely manner or at all; satisfaction of the conditions precedent to consummation of the transaction, including the ability to secure regulatory approvals in a timely manner or at all, and the approval by Marcum’s partners and the approval by the Company’s stockholders; the possibility of litigation related to the transaction and the effects thereof; the possibility that anticipated benefits and/or synergies of the transaction will not be achieved in a timely manner or at all; the possibility that the costs of the transaction and/or liabilities assumed will be more significant than anticipated; the possibility that integration will prove more costly and/or time consuming than anticipated; the possibility that the transaction could disrupt ongoing plans and operations of the parties or their respective relationships with clients, other business partners and employees; the possibility that the financing will not be obtained as anticipated and the effects of the increased leverage of the Company following the transaction; and other risks described in the Company’s filings with the Securities and Exchange Commission (“SEC”).
Such forward-looking statements can be affected by inaccurate assumptions we might make or by known or unknown risks and uncertainties. Should one or more of these risks materialize, or should the underlying assumptions prove incorrect, actual results may vary materially from those anticipated, estimated or projected. Consequently, no forward-looking statements can be guaranteed.
A more detailed description of such risks and uncertainties may be found in “Item 1A. Risk Factors” of the Company’s Annual Report on Form 10-K for the year ended December 31, 2023, and the Company’s other filings with the SEC at www.sec.gov.
All forward-looking statements made in this release are made only as of the date hereof. The Company does not undertake any obligation to publicly update or correct any forward-looking statements, whether as a result of new information, future events or otherwise, except as required by law.
ADDITIONAL INFORMATION ABOUT THE TRANSACTION AND WHERE TO FIND IT
In connection with the transaction with Marcum, the Company will file a proxy statement with the SEC. The definitive proxy statement will be mailed to the Company’s stockholders and will contain important information about the transaction and related matters. THE COMPANY’S STOCKHOLDERS ARE URGED TO READ THE DEFINITIVE PROXY STATEMENT CAREFULLY WHEN IT BECOMES AVAILABLE BEFORE MAKING ANY VOTING OR INVESTMENT DECISION WITH RESPECT TO THE TRANSACTION BECAUSE IT WILL CONTAIN IMPORTANT INFORMATION ABOUT THE TRANSACTION. The definitive proxy statement and other relevant materials (when they become available) and any other documents filed by the Company with the SEC may be obtained free of charge at the SEC’s website at www.sec.gov. In addition, stockholders will be able to obtain free copies of the definitive proxy statement from the Company on the Investor Relations page of the Company’s website, www.cbiz.com, or by writing to us at Attention: Investor Relations Department, 5959 Rockside Woods Blvd. N., Suite 600, Independence, Ohio 44131.
PARTICIPANTS IN THE SOLICITATION
The Company and its directors and executive officers may be deemed to be participants in the solicitation of proxies in connection with the transaction with Marcum. Information with respect to the Company’s directors and executive officers is set forth in the Company’s Proxy Statement on Schedule 14A for its 2024 Annual Meeting of Stockholders, which was filed with the SEC on March 25, 2024, and its Annual Report on Form 10-K for the fiscal year ended December 31, 2023, which was filed with the SEC on February 23, 2024. These documents are available free of charge at the SEC’s website at www.sec.gov, or from the Company on the Investor Relations page of the Company’s website, www.cbiz.com, or by writing to us at Attention: Investor Relations Department, 5959 Rockside Woods Blvd. N., Suite 600, Independence, Ohio 44131. Additional information regarding the interests of participants in the solicitation of proxies in connection with the transaction will be included in the proxy statement that the Company intends to file with the SEC.
CBIZ, INC.
FINANCIAL HIGHLIGHTS (UNAUDITED)
THREE MONTHS ENDED JUNE 30, 2024 AND 2023
(In thousands, except percentages and per share data)
Three Months Ended June 30,
2024
%
2023
%
Revenue
$ 420,012
100.0 %
$ 398,502
100.0 %
Operating expenses (1)
366,368
87.2
343,987
86.3
Gross margin
53,644
12.8
54,515
13.7
Corporate general and administrative expenses (1)
22,050
5.2
15,793
4.0
Operating income
31,594
7.6
38,722
9.7
Other (expense) income:
Interest expense
(5,884)
(1.4)
(5,534)
(1.4)
Other income, net (1) (2)
2,483
0.6
5,421
1.4
Total other expense, net
(3,401)
(0.8)
(113)
—
Income before income tax expense
28,193
6.8
38,609
9.7
Income tax expense
8,400
11,746
Net income
$ 19,793
4.7 %
$ 26,863
6.7 %
Diluted earnings per share
$ 0.39
$ 0.53
Diluted weighted average common shares outstanding
50,276
50,385
Other data:
Adjusted EBITDA (3)
$ 50,683
$ 54,435
Adjusted EPS (3)
$ 0.50
$ 0.55
(1)
CBIZ sponsors a deferred compensation plan, under which a CBIZ employee’s compensation deferral is held in a rabbi trust and invested accordingly as directed by the employee. Income and expenses related to the deferred compensation plan are included in “Operating expenses” and “Corporate general and administrative expenses,” and are directly offset by deferred compensation gains or losses in “Other expense, net.” The deferred compensation plan has no impact on “Income before income tax expense.”
Income and expenses related to the deferred compensation plan for the three months ended June 30, 2024, and 2023, are as follows (in thousands):
Three Months Ended June 30,
2024
% of Revenue
2023
% of Revenue
Operating expense
$ 2,283
0.5 %
$ 5,102
1.3 %
Corporate general and administrative expense
323
0.1 %
631
0.2 %
Other income, net
2,606
0.6 %
5,733
1.4 %
Excluding the impact of the previously mentioned income and expenses related to the deferred compensation plan, the operating results for the three months ended June 30, 2024, and 2023, are as follows (in thousands):
Three Months Ended June 30,
2024
2023
As Reported
Deferred
Compensation
Plan
Adjusted
% of Revenue
As Reported
Deferred
Compensation
Plan
Adjusted
% of Revenue
Gross margin
$ 53,644
$ 2,283
$ 55,927
13.3 %
$ 54,515
$ 5,102
$ 59,617
15.0 %
Operating income
31,594
2,606
34,200
8.1 %
38,722
5,733
44,455
11.2 %
Other income (expense), net
2,483
(2,606)
(123)
— %
5,421
(5,733)
(312)
(0.1) %
Income before income tax expense
28,193
—
28,193
6.8 %
38,609
—
38,609
9.7 %
(2)
Included in “Other income (expense), net” for the three months ended June 30, 2024, and 2023, is expense of $0.2 million and $0.8 million, respectively, related to net changes in the fair value of contingent consideration related to CBIZ’s prior acquisitions.
(3)
Refer to the schedules reconciling Adjusted earnings per share and Adjusted EBITDA to the most directly comparable GAAP measures at the end of this release, and for additional information as to the usefulness of the Non-GAAP financial measures to shareholders and investors.
CBIZ, INC.
FINANCIAL HIGHLIGHTS (UNAUDITED)
SIX MONTHS ENDED JUNE 30, 2024 AND 2023
(In thousands, except percentages and per share data)
Six Months Ended June 30,
2024
%
2023
%
Revenue
$ 914,309
100.0 %
$ 853,108
100.0 %
Operating expenses (1)
742,853
81.2
684,998
80.3
Gross margin
171,456
18.8
168,110
19.7
Corporate general and administrative expenses (1)
40,761
4.5
31,391
3.7
Operating income
130,695
14.3
136,719
16.0
Other (expense) income:
Interest expense
(10,395)
(1.1)
(9,175)
(1.1)
Gain on sale of operations, net
—
—
99
—
Other income, net (1) (2)
11,907
1.3
10,533
1.2
Total other income, net
1,512
0.2
1,457
0.1
Income before income tax expense
132,207
14.5
138,176
16.1
Income tax expense
35,530
38,153
Net income
96,677
10.6 %
100,023
11.7 %
Diluted earnings per share
$ 1.92
$ 1.98
Diluted weighted average common shares outstanding
50,248
50,639
Other data:
Adjusted EBITDA (3)
$ 169,513
$ 167,783
Adjusted EPS (3)
$ 2.04
$2.01
(1)
CBIZ sponsors a deferred compensation plan, under which a CBIZ employee’s compensation deferral is held in a rabbi trust and invested accordingly as directed by the employee. Income and expenses related to the deferred compensation plan are included in “Operating expenses” and “Corporate general and administrative expenses,” and are directly offset by deferred compensation gains or losses in “Other income (expense), net.” The deferred compensation plan has no impact on “Income before income tax expense.”
Income and expenses related to the deferred compensation plan for the six months ended June 30, 2024, and 2023, are as follows (in thousands):
Six Months Ended June 30,
2024
% of Revenue
2023
% of Revenue
Operating expenses
$ 10,859
1.2 %
$ 9,862
1.2 %
Corporate general and administrative expenses
1,380
0.2 %
1,273
0.1 %
Other income (expense), net
12,239
1.3 %
11,135
1.3 %
Excluding the impact of the above-mentioned income and expenses related to the deferred compensation plan, the operating results for the six months ended June 30, 2024, and 2023, are as follows (in thousands):
Six Months Ended June 30,
2024
2023
As Reported
Deferred
Compensation
Plan
Adjusted
% of Revenue
As Reported
Deferred
Compensation
Plan
Adjusted
% of Revenue
Gross margin
$ 171,456
$ 10,859
$ 182,315
19.9 %
$ 168,110
$ 9,862
$ 177,972
20.9 %
Operating income
130,695
12,239
142,934
15.6 %
136,719
11,135
147,854
17.3 %
Other income (expense), net
11,907
(12,239)
(332)
— %
10,533
(11,135)
(602)
(0.1) %
Income before income tax expense
132,207
—
132,207
14.5 %
138,176
—
138,176
16.1 %
(2)
Included in “Other income (expense), net” for the six months ended June 30, 2024, and 2023, is expense of $0.6 million and $1.4 million, respectively, related to net changes in the fair value of contingent consideration related to CBIZ’s prior acquisitions.
(3)
Refer to the financial highlights tables for a reconciliation of Non-GAAP financial measures to the most directly comparable GAAP financial measure, and for additional information as to the usefulness of the Non-GAAP financial measures to shareholders and investors.
CBIZ, INC.
FINANCIAL HIGHLIGHTS (UNAUDITED)
(In thousands)
SELECT SEGMENT DATA
Three Months Ended June 30,
Six Months Ended June 30,
2024
2023
2024
2023
Revenue
Financial Services
$ 309,233
$ 290,930
$ 681,863
$ 634,016
Benefits and Insurance Services
97,419
95,838
205,827
195,892
National Practices
13,360
11,734
26,619
23,200
Total
$ 420,012
$ 398,502
$ 914,309
$ 853,108
Gross Margin
Financial Services
$ 46,424
$ 47,485
$ 153,493
$ 146,128
Benefits and Insurance Services
14,176
17,464
38,947
40,595
National Practices
1,332
1,189
2,658
2,072
Operating expenses – unallocated (1):
Other expense
(6,005)
(6,521)
(12,783)
(10,823)
Deferred compensation
(2,283)
(5,102)
(10,859)
(9,862)
Total
$ 53,644
$ 54,515
$ 171,456
$ 168,110
(1)
Represents operating expenses not directly allocated to individual businesses, including stock-based compensation, consolidation and integration charges, and certain advertising expenses. “Operating expenses – unallocated” also includes gains or losses attributable to the assets held in a rabbi trust associated with the Company’s deferred compensation plan. These gains or losses do not impact “Income before income tax expense” as they are directly offset by the same adjustment to “Other income (expense), net” in the Consolidated Statements of Comprehensive Income. Net gains or losses recognized from adjustments to the fair value of the assets held in the rabbi trust are recorded as compensation expense (income) in “Operating expenses” and “Corporate, general and administrative expenses,” and offset in “Other income (expense), net.”
CBIZ, INC.
SELECT CASH FLOW DATA (UNAUDITED)
(In thousands)
Six Months Ended June 30,
2024
2023
Net income
$ 96,677
$ 100,023
Adjustments to reconcile net income to net cash provided by operating activities:
Depreciation and amortization expense
19,008
17,831
Gain on sale of operations, net
—
(99)
Bad debt expense, net of recoveries
1,244
805
Adjustments to contingent earnout liability, net
638
1,445
Stock-based compensation expense
5,016
6,619
Other noncash adjustments
3,401
4,671
Net income, after adjustments to reconcile net income to net cash provided by operating activities
125,984
131,295
Changes in assets and liabilities, net of acquisitions and divestitures
(101,545)
(101,566)
Net cash provided by operating activities
24,439
29,729
Net cash used in investing activities
(33,247)
(65,617)
Net cash (used in) provided by financing activities
(11,920)
21,793
Net decrease in cash, cash equivalents and restricted cash
(20,728)
(14,095)
Cash, cash equivalents and restricted cash at beginning of year
$ 157,148
$ 160,145
Cash, cash equivalents and restricted cash at end of period
$ 136,420
$ 146,050
Reconciliation of cash, cash equivalents and restricted cash to the consolidated balance sheet:
Cash and cash equivalents
$ 1,128
$ 3,692
Restricted cash
44,947
52,314
Cash equivalents included in funds held for clients
90,345
90,044
Total cash, cash equivalents and restricted cash
$ 136,420
$ 146,050
CBIZ, INC.
SELECT FINANCIAL DATA AND RATIOS (UNAUDITED)
(In thousands)
June 30, 2024
December 31, 2023
Cash and cash equivalents
1,128
8,090
Restricted cash
44,947
30,362
Accounts receivable, net
477,841
380,152
Current assets before funds held for clients
562,808
453,499
Funds held for clients
131,128
159,186
Goodwill and other intangible assets, net
1,035,148
1,008,604
Total assets
2,160,805
2,043,592
Current liabilities before client fund obligations
336,140
352,028
Client fund obligations
131,623
159,893
Total long-term debt, net
379,660
310,826
Total liabilities
1,269,371
1,251,974
Treasury stock
(910,322)
(899,093)
Total stockholders’ equity
891,434
791,618
Debt to equity
42.6 %
39.3 %
Days sales outstanding (DSO) (1)
95
78
Shares outstanding
50,162
49,814
Basic weighted average common shares outstanding
50,079
49,989
Diluted weighted average common shares outstanding
50,248
50,557
(1)
DSO is provided for continuing operations and represents accounts receivable, net, at the end of the period, divided by trailing twelve months daily revenue. The Company has included DSO data because such data is commonly used as a performance measure by analysts and investors and as a measure of the Company’s ability to collect on receivables in a timely manner. DSO should not be regarded as an alternative or replacement to any measurement of performance under GAAP. DSO on June 30, 2023, was 94.
CBIZ, INC.
GAAP RECONCILIATION
Net Income and Diluted Earnings Per Share (“EPS”) to Adjusted Net Income, EPS and EBITDA(1)
(Unaudited. Amounts in thousands, except per share data)
Three Months Ended June 30,
2024
2023
Amounts
EPS
Amounts
EPS
Net income
$ 19,793
$ 0.39
$ 26,863
$ 0.53
Adjustments:
Integration & retention costs related to acquisitions (2)
330
0.01
865
0.03
Facility optimization costs (3)
85
—
221
—
Transaction costs (4)
6,651
0.13
—
—
Income tax effect related to adjustments
(1,906)
(0.03)
(330)
(0.01)
Adjusted net income
$ 24,953
$ 0.50
$ 27,619
$ 0.55
Interest expense
$ 5,884
$ 5,534
Income tax expense
8,400
11,746
Tax effect related to the adjustments above
1,906
330
Depreciation
3,520
3,116
Amortization
6,020
6,090
Adjusted EBITDA
$ 50,683
$ 54,435
Six Months Ended June 30,
2024
2023
Amounts
EPS
Amounts
EPS
Net income
$ 96,677
$ 1.92
$ 100,023
$ 1.98
Adjustments:
Transaction costs related to acquisitions (2)
—
—
611
0.01
Integration & retention costs related to acquisitions (2)
912
0.02
1,868
0.04
Facility optimization costs (3)
340
0.01
221
—
Transaction costs (4)
6,651
0.13
—
—
Income tax effect related to adjustments
(2,124)
(0.04)
(746)
(0.02)
Adjusted net income
$ 102,456
$ 2.04
$ 101,977
$ 2.01
Interest expense
$ 10,395
$ 9,175
Income tax expense
35,530
38,153
Gain on sale of operations, net
—
(99)
Tax effect related to the adjustments above
2,124
746
Depreciation
7,043
6,091
Amortization
11,965
11,740
Adjusted EBITDA
$ 169,513
$ 167,783
(1)
CBIZ reports its financial results in accordance with GAAP. This table reconciles Adjusted net income, Adjusted EPS, and Adjusted EBITDA to the most directly comparable GAAP financial measures, “Net income” and “Diluted earnings per share.” Adjusted net income, Adjusted EPS and Adjusted EBITDA are not defined by GAAP and should not be regarded as an alternative or replacement to any financial information determined under GAAP. Adjusted net income, Adjusted EPS and Adjusted EBITDA exclude significant non-operating related gains and losses that management does not consider on-going in nature. These Non-GAAP financial measures are used by the Company as performance measures to evaluate, assess and benchmark the Company’s operational results and to evaluate results relative to employee compensation targets. Accordingly, the Company believes the presentation of these Non-GAAP financial measures allows its stockholders, debt holders, and other interested parties to meaningfully compare the Company’s period-to-period operating results.
(2)
These costs include, but are not limited to, certain consulting, technology, personnel, as well as other first year operating and general administrative costs that are non-recurring in nature. Amounts reported in 2024 related to the costs incurred related to the acquisitions of Erickson, Brown & Kloster, LLC and CompuData, Inc., and those reported in 2023 related to the acquisition of Somerset CAPs and Advisors.
(3)
These costs relate to incremental non-recurring lease expense incurred as a result of CBIZ’s real estate optimization efforts.
(4)
These costs include, but are not limited to, certain non-recurring legal and other professional service costs incurred in connection with the announced purchase of Marcum.
CBIZ, INC.
GAAP RECONCILIATION
Full Year 2024 Diluted Earnings Per Share (“EPS”) Guidance to Full Year 2024 Adjusted Diluted EPS (1)
Full Year 2024 Guidance
Low
High
Diluted EPS – GAAP Guidance
$ 2.53
$ 2.58
Adjustments:
Integration & retention costs related to acquisitions (2)
0.01
0.01
Transaction costs (3)
0.10
0.10
Adjusted Diluted EPS Guidance
$ 2.64
$ 2.69
GAAP Diluted EPS for 2023
$ 2.39
$ 2.39
Adjusted Diluted EPS for 2023
$ 2.41
$ 2.41
GAAP Diluted EPS Range
6 %
8 %
Adjusted Diluted EPS Range
10 %
12 %
(1)
The full year 2024 guidance is based on management’s current expectations for the remainder of 2024, excluding the impact of the announced acquisition of Marcum. Management expects to update guidance for the combined business upon closing of the transaction, which is expected to occur in the fourth quarter, subject to the satisfaction of various closing conditions, including the approval of the Company’s stockholders.
(2)
These costs include, but are not limited to, certain non-recurring consulting, technology, personnel, and other first year operating and general administrative costs incurred related to the acquisitions of Erickson, Brown & Kloster, LLC and CompuData, Inc.
(3)
These costs include, but are not limited to, certain non-recurring legal and other professional service costs incurred in connection with the announced purchase of Marcum.
View original content to download multimedia:https://www.prnewswire.com/news-releases/cbiz-reports-second-quarter-and-first-half-2024-results-and-announces-agreement-to-acquire-marcum-302210559.html
SOURCE CBIZ, Inc.

You may like
Technology
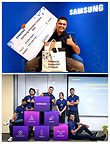
Samsung Selects Chandigarh University Student as ‘Punjab AI State Topper’
Published
22 minutes agoon
July 18, 2026By

CU Student Devesh Panwar Wins Rs 1 Lakh Award for Developing AI-Based Document Search System
CHANDIGARH, India, July 18, 2026 /PRNewswire/ — A Bachelor of Computer Applications (BCA) student of Chandigarh University, Devesh Panwar, has been named the “Punjab State Topper” in the Artificial Intelligence (AI) under the Samsung Innovation Campus (SIC) AI Program organised by Samsung in collaboration with Telecom Sector Skill Council (TSSC) and training partner Focal Skill Development (Focalyt) to equip Indian youth with industry-relevant in-demand skills in AI, loT, Big Data, and Coding & Programming, preparing them for future careers.
A final-year student of Bachelor of Computer Applications (BCA) at University Institute of Computing (UIC) of Chandigarh University, Devesh Panwar also won a cash award of Rs 1 lakh along with a laptop, and exclusive Samsung rewards for achieving this remarkable milestone under the Samsung Innovation Campus AI Program.
“Being named ‘AI State Topper’ was a moment of profound pride and validation for me. Hard work, intense technical training and a passion for AI culminated in the immense honor of the Punjab State Topper title. Besides getting access to state-of-the-art tools to fuel my future research and development endeavor, I gained world-class knowledge during the Samsung Innovation Campus (SIC) AI Program. It helped me in gaining hands-on experience and applied AI to solve real-world challenges, especially in aeronautical and technical domains,”
During Samsung Innovation Campus (SIC) AI Program, Devesh and his team worked on innovative AI capstone project which was presented before the jury panel as part of the final assessment.
“Our team developed the advanced AI-powered system AI Research Agent, a Retrieval-Augmented Generation (RAG) platform designed for intelligent querying of private document collections. Organizations, researchers, legal professionals, and HR teams often work with large collections of documents. Traditional search methods rely heavily on keyword matching and require significant manual effort to locate relevant information. The project was developed to address the limitations of traditional document search systems, which often struggle with contextual understanding, retrieval accuracy, learning adaptability, and response speed,” said Devesh.
“The developed system demonstrated significant improvements over traditional document retrieval approaches with faster response generation with integration of modern AI techniques, full-stack development, database systems, and intelligent automation into a single practical solution. By combining modern RAG architecture with innovative retrieval and reasoning mechanisms, this system provides a fast, intelligent, and user-friendly solution for knowledge discovery and resume evaluation. This project not only enhanced our technical expertise in Artificial Intelligence and Full-Stack Development but also strengthened our problem-solving, teamwork, and professional communication skills. It stands as a significant achievement of our Samsung Innovation Campus 2025 journey and reflects our commitment to building impactful AI solutions for real-world challenges,” he added.
Congratulating Devesh Panwar for being named “Punjab State Topper” AI under the Samsung Innovation Campus Samsung Innovation Program, Deepinder Singh Sandhu, Senior Managing Director, Chandigarh University, said, “Devesh’s achievement reflects Chandigarh University’s focus on experiential learning and industry-academia collaboration. Through the Samsung Innovation Campus AI Program, CU students gain practical exposure to AI and building solutions for real-world challenges. This accomplishment reflects not only Devesh’s commitment to excellence but also the growing culture of innovation and industry-oriented learning at Chandigarh University,”.
“Since its inception, Chandigarh University has set benchmarks for world-class education with its dynamic hands-on experiential learning model, industry-aligned programs, dynamic fraternity, state-of-the-art infrastructure facilities and impeccable placements. Samsung Innovation Program is also part of our initiatives to develop a future-ready talent pool equipped with advanced capabilities in AI, loT, Big Data, and Coding and Programming. By bridging the gap between theoretical learning and real-world application, this collaboration helps in providing CU’s computer science and computing students exposure to cutting-edge and emerging technologies. CU’s this partnership with Samsung is focused on building future-ready talent equipped with industry-relevant skills in AI and emerging technologies,” Sandhu said.
He said Chandigarh University’s Institute of Computing (UIC) prepares students for a successful career in computing, to create and disseminate computing knowledge and technology. “Chandigarh University carries a vision of crafting next-gen IT professionals who can take up industry challenges effectively and our Institute of Computing (UIC) prepares students for a successful career in computing, to create and disseminate computing knowledge and technology. UIC’s hands-on approach paves the way for a smooth transition to the workforce after graduation. Our students are equipped with the best knowledge, skills and passion to succeed in any number of computing careers. CU’s Institute of Computing renders cutting-edge education ranging from the expertise in traditional software development -to- modern computing technologies. Fully-equipped industry-sponsored labs, industry-aligned curriculum, and accreditations and validations by top companies such as Intel, Microsoft, Google Android, Red Hat etc. give our students an exclusive edge over others,” the Chandigarh University CMD said.
Sandhu said the latest edition of QS World University Rankings has yet again reaffirmed Chandigarh University global standing as a top educational institution. “Continuing its remarkable rise among the world’s leading higher education institutions, Chandigarh University (CU) has made impressive strides in the latest edition of prestigious QS World University Rankings 2027 by securing an overall world rank of 526, an increase of 49 ranks as compared to 575th rank in QS’ 2026 Rankings. This is for the fifth consecutive year that Chandigarh University’s global rankings have witnessed an impressive surge with CU’s world rank going up by an impressive 274 ranks — from the 800th rank in 2023 to 526th in 2027’s Rankings,”.
“As per the latest QS World University Rankings, with All India Rank of 13 among all universities in the country as compared to 16th rank in 2026’s rankings, Chandigarh University now ranks among the top 1% of universities in India and the top 2% of universities in the World, underscoring its growing reputation as a leading institution of higher learning, both in India and globally,” he added.
About Chandigarh University
Chandigarh University is a NAAC A+ Grade University and QS World Ranked University. This autonomous educational institution is approved by UGC and is located near Chandigarh in the state of Punjab. It is the youngest university in India and the only private university in Punjab to be honoured with A+ Grade by NAAC (National Assessment and Accreditation Council). CU offers more than 109 UG and PG programs in the field of engineering, management, pharmacy, law, architecture, journalism, animation, hotel management, commerce, and others. It has been awarded as The University with Best Placements by WCRC.
Website address: https://www.cuchd.in/
View original content to download multimedia:https://www.prnewswire.com/in/news-releases/samsung-selects-chandigarh-university-student-as-punjab-ai-state-topper-302828991.html
Technology
Samsung Selects Chandigarh University Student as ‘Punjab AI State Topper’
Published
22 minutes agoon
July 18, 2026By
CU Student Devesh Panwar Wins Rs 1 Lakh Award for Developing AI-Based Document Search System
CHANDIGARH, India, July 18, 2026 /PRNewswire/ — A Bachelor of Computer Applications (BCA) student of Chandigarh University, Devesh Panwar, has been named the “Punjab State Topper” in the Artificial Intelligence (AI) under the Samsung Innovation Campus (SIC) AI Program organised by Samsung in collaboration with Telecom Sector Skill Council (TSSC) and training partner Focal Skill Development (Focalyt) to equip Indian youth with industry-relevant in-demand skills in AI, loT, Big Data, and Coding & Programming, preparing them for future careers.
A final-year student of Bachelor of Computer Applications (BCA) at University Institute of Computing (UIC) of Chandigarh University, Devesh Panwar also won a cash award of Rs 1 lakh along with a laptop, and exclusive Samsung rewards for achieving this remarkable milestone under the Samsung Innovation Campus AI Program.
“Being named ‘AI State Topper’ was a moment of profound pride and validation for me. Hard work, intense technical training and a passion for AI culminated in the immense honor of the Punjab State Topper title. Besides getting access to state-of-the-art tools to fuel my future research and development endeavor, I gained world-class knowledge during the Samsung Innovation Campus (SIC) AI Program. It helped me in gaining hands-on experience and applied AI to solve real-world challenges, especially in aeronautical and technical domains,”
During Samsung Innovation Campus (SIC) AI Program, Devesh and his team worked on innovative AI capstone project which was presented before the jury panel as part of the final assessment.
“Our team developed the advanced AI-powered system AI Research Agent, a Retrieval-Augmented Generation (RAG) platform designed for intelligent querying of private document collections. Organizations, researchers, legal professionals, and HR teams often work with large collections of documents. Traditional search methods rely heavily on keyword matching and require significant manual effort to locate relevant information. The project was developed to address the limitations of traditional document search systems, which often struggle with contextual understanding, retrieval accuracy, learning adaptability, and response speed,” said Devesh.
“The developed system demonstrated significant improvements over traditional document retrieval approaches with faster response generation with integration of modern AI techniques, full-stack development, database systems, and intelligent automation into a single practical solution. By combining modern RAG architecture with innovative retrieval and reasoning mechanisms, this system provides a fast, intelligent, and user-friendly solution for knowledge discovery and resume evaluation. This project not only enhanced our technical expertise in Artificial Intelligence and Full-Stack Development but also strengthened our problem-solving, teamwork, and professional communication skills. It stands as a significant achievement of our Samsung Innovation Campus 2025 journey and reflects our commitment to building impactful AI solutions for real-world challenges,” he added.
Congratulating Devesh Panwar for being named “Punjab State Topper” AI under the Samsung Innovation Campus Samsung Innovation Program, Deepinder Singh Sandhu, Senior Managing Director, Chandigarh University, said, “Devesh’s achievement reflects Chandigarh University’s focus on experiential learning and industry-academia collaboration. Through the Samsung Innovation Campus AI Program, CU students gain practical exposure to AI and building solutions for real-world challenges. This accomplishment reflects not only Devesh’s commitment to excellence but also the growing culture of innovation and industry-oriented learning at Chandigarh University,”.
“Since its inception, Chandigarh University has set benchmarks for world-class education with its dynamic hands-on experiential learning model, industry-aligned programs, dynamic fraternity, state-of-the-art infrastructure facilities and impeccable placements. Samsung Innovation Program is also part of our initiatives to develop a future-ready talent pool equipped with advanced capabilities in AI, loT, Big Data, and Coding and Programming. By bridging the gap between theoretical learning and real-world application, this collaboration helps in providing CU’s computer science and computing students exposure to cutting-edge and emerging technologies. CU’s this partnership with Samsung is focused on building future-ready talent equipped with industry-relevant skills in AI and emerging technologies,” Sandhu said.
He said Chandigarh University’s Institute of Computing (UIC) prepares students for a successful career in computing, to create and disseminate computing knowledge and technology. “Chandigarh University carries a vision of crafting next-gen IT professionals who can take up industry challenges effectively and our Institute of Computing (UIC) prepares students for a successful career in computing, to create and disseminate computing knowledge and technology. UIC’s hands-on approach paves the way for a smooth transition to the workforce after graduation. Our students are equipped with the best knowledge, skills and passion to succeed in any number of computing careers. CU’s Institute of Computing renders cutting-edge education ranging from the expertise in traditional software development -to- modern computing technologies. Fully-equipped industry-sponsored labs, industry-aligned curriculum, and accreditations and validations by top companies such as Intel, Microsoft, Google Android, Red Hat etc. give our students an exclusive edge over others,” the Chandigarh University CMD said.
Sandhu said the latest edition of QS World University Rankings has yet again reaffirmed Chandigarh University global standing as a top educational institution. “Continuing its remarkable rise among the world’s leading higher education institutions, Chandigarh University (CU) has made impressive strides in the latest edition of prestigious QS World University Rankings 2027 by securing an overall world rank of 526, an increase of 49 ranks as compared to 575th rank in QS’ 2026 Rankings. This is for the fifth consecutive year that Chandigarh University’s global rankings have witnessed an impressive surge with CU’s world rank going up by an impressive 274 ranks — from the 800th rank in 2023 to 526th in 2027’s Rankings,”.
“As per the latest QS World University Rankings, with All India Rank of 13 among all universities in the country as compared to 16th rank in 2026’s rankings, Chandigarh University now ranks among the top 1% of universities in India and the top 2% of universities in the World, underscoring its growing reputation as a leading institution of higher learning, both in India and globally,” he added.
About Chandigarh University
Chandigarh University is a NAAC A+ Grade University and QS World Ranked University. This autonomous educational institution is approved by UGC and is located near Chandigarh in the state of Punjab. It is the youngest university in India and the only private university in Punjab to be honoured with A+ Grade by NAAC (National Assessment and Accreditation Council). CU offers more than 109 UG and PG programs in the field of engineering, management, pharmacy, law, architecture, journalism, animation, hotel management, commerce, and others. It has been awarded as The University with Best Placements by WCRC.
Website address: https://www.cuchd.in/
View original content to download multimedia:https://www.prnewswire.com/in/news-releases/samsung-selects-chandigarh-university-student-as-punjab-ai-state-topper-302828991.html
Technology
Black Lake Technologies Shortlisted as SAIL Award TOP30 Finalist and Selected as Global Industrial AI Flagship Case, Showcasing Latest Industrial Agent at WAIC 2026
Published
1 hour agoon
July 18, 2026By
SHANGHAI, July 18, 2026 /PRNewswire/ — The 2026 World Artificial Intelligence Conference (WAIC) opened in Shanghai on July 17. Shanghai Blacklake Technologies Co., Ltd. (“Black Lake”), an industrial AI company, is showcasing a portfolio of industrial AI agents at the conference. The company has also been named to the Top 30 shortlist for the 2026 WAIC Super AI Leader (SAIL) Award and selected as a Trusted Partner under the Global Call for Trusted Partners for Industrial AI in the Global South.
The accreditations highlight Black Lake’s latest progress in bringing AI into critical manufacturing decision-making workflows and deploying industrial AI capabilities on the shop floor around the world.
This year’s conference attracted over 1,100 exhibiting companies and showcased more than 3,000 exhibits, setting a new record for exhibition scale. The conference delivered a clear signal: as artificial intelligence becomes a common priority across global industries, attention is moving beyond model capabilities toward practical applications in real-world operating environments.
Manufacturing provides a particularly demanding test for this transition. Factory operations are governed by multiple constraints, including process specifications, equipment capabilities, material availability, production capacity, delivery schedules and quality requirements. Therefore, AI has to do so much more than simply comprehend information input. It must make reliable judgments within clearly defined business rules and operational constraints.
Black Lake has focused on industrial digitalization and industrial AI for years, developing and deploying AI applications in a range of factory environments.
At WAIC 2026, the company is presenting industrial AI agents covering order splitting and process planning, quotation and pricing, procurement, production scheduling, quality inspection, and order tracking. These applications are designed to move AI beyond an auxiliary role and into critical manufacturing decision-making workflows.
Traditional industrial software is primarily responsible for data recording, digital workflows, and worker coordination. However, critical decisions such as how to split an order, determine pricing, schedule production, and assess quality risks still depend heavily on the experience of engineers and frontline workers.
Industrial AI agents are intended to convert fragmented industrial knowledge and production experience into decision-making capabilities that can be invoked, reused and continuously refined by software systems.
Order decomposition and process planning are representative examples. After receiving an engineering drawing, a factory typically relies on experienced engineers to identify components, materials and dimensions, define the required manufacturing processes and technical specifications, and establish a basis for subsequent quotation and quality inspection.
The process is highly dependent on individual expertise and represents one of the first critical decision points after an order is received.
Black Lake Technologies’ CAD-to-Process Agent can understand product drawings and, taking into account the factory’s equipment capabilities, process requirements, and production practices, rapidly generate process steps along with the corresponding technical requirements. Drawing analysis that once took hours can now be completed in approximately one minute, achieving an accuracy rate of over 95% in real deployment and providing engineers with stable, efficient decision support. Currently, the industrial agents developed by the company cover core processes including design, scheduling, production, and quality inspection, and have entered the stage of large-scale deployment.
Founded in 2016, Black Lake serves nearly 40,000 factories worldwide. Its customers span more than 30 industries, including food and beverage, automotive components and equipment manufacturing.
By working across factory order management, production and fulfillment workflows, Black Lake has accumulated the technical capabilities and industry knowledge required to support decision-making in complex industrial environments.
In April 2026, Black Lake completed a Series D funding round of nearly RMB 1 billion. The company said the proceeds would primarily be used to accelerate the deployment of its industrial AI products and support its international expansion.
AI-related products are becoming a new source of growth for the company. In a recent interview, Black Lake founder and CEO Zhou Yuxiang said that the company had recorded significant growth in AI-related revenue since the beginning of 2026. He also said that manufacturing customers were taking less time to make purchasing decisions for industrial AI agents.
Zhou expects AI adoption among Chinese factories to increase substantially over the next three to four years.
Unlike consumer-facing AI, which is primarily associated with content generation and personal productivity, industrial AI agents can directly affect production costs, capacity utilization, delivery performance, and product quality. Their commercial value therefore depends largely on whether they can perform specific tasks reliably in complex production environments.
During WAIC 2026, Black Lake was named to the Top 30 shortlist for the 2026 Super AI Leader (SAIL) Award. The SAIL Award is one of WAIC’s major awards and recognizes achievements in technological breakthroughs, application innovation, and industrial value.
Black Lake was also selected as a Trusted Partner under UNIDO’s Global Call for Trusted Partners for Industrial AI in the Global South.
The Global Call was launched under the guidance of the United Nations Industrial Development Organization (UNIDO), in partnership with the Shanghai Artificial Intelligence Research Institute, and in connection with the work of UNIDO AIM Global and its Shanghai-based Centre of Excellence.
The initiative aims to build a curated pool of leading partners to co-develop scalable industrial AI solutions and public goods for the Global South.
For Black Lake, the two accreditations underscore the growing importance of reliability, explainability, and scalability in the evaluation of industrial AI, in addition to the capabilities of AI models.
Global expansion will be a major priority in the company’s next phase of development. Black Lake is currently focusing on Southeast Asia, Latin America and Eastern Europe, adapting its industrial AI agents to the industrial structures, production processes and management requirements of different markets.
Although manufacturing operations vary across countries and regions, manufacturers share similar concerns about efficiency, quality, delivery reliability and production flexibility.
Black Lake is transforming industrial AI capabilities that have been validated in complex factory environments into configurable and deployable products. Through these products, the company aims to work with manufacturers worldwide to explore more efficient, flexible and intelligent approaches to production.
SOURCE Black Lake


Samsung Selects Chandigarh University Student as ‘Punjab AI State Topper’

Samsung Selects Chandigarh University Student as ‘Punjab AI State Topper’
Black Lake Technologies Shortlisted as SAIL Award TOP30 Finalist and Selected as Global Industrial AI Flagship Case, Showcasing Latest Industrial Agent at WAIC 2026
Send Rakhi to UK swiftly with UK Gifts Portal

Whiteboard Series with NEAR | Ep: 45 Joel Thorstensson from ceramic.network

New Gooseneck Omni Antennas Offer Enhanced Signals in a Durable Package

Why You Should Build on #NEAR – Co-founder Illia Polosukhin at CV Labs
Whiteboard Series with NEAR | Ep: 45 Joel Thorstensson from ceramic.network

NEAR End of Year Town Hall 2021: The Open Web World, MetaBUILD 2 Hackathon and 2021 recap
Trending
-

 Technology5 days ago
China’s Hit Variety Show “Wonderland Season Ⅵ” Is Currently Airing – How Does This Long-Running Franchise Win the Battle for Critical Acclaim?
-

 Technology2 days ago
GPU.ai Named Official Title Sponsor of AGI Summit SF 2026
-

 Coin Market3 days ago
Revolut receives in-principle approval from UAE authorities for crypto services
-

 Near Videos4 days ago
Confidential Intents is now generally available
-

 Technology3 days ago
InventHelp Inventor Develops Improved Food Delivery Bag (LBT-9719)
-

 Coin Market3 days ago
Ostium pauses trading as security firms report multimillion-dollar oracle exploit
-

 Coin Market3 days ago
Crypto firms face AML risks during post-MiCA migration, says AMLA chair
-
 Technology3 days ago
JumpCloud Launches Workflows To Empower IT Teams With Secure And Simple Automation