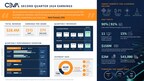
– Licensing and related revenues $17.3 million, up 28% year-over-year
– Royalty revenue $11.2 million, up 19% year-over-year, generated from 461 million shipped units, up 24% year-over-year
– Long-term roadmap deals signed with 2 infrastructure OEMs developing custom silicon driven by rise in AI-related traffic on wireless networks
– Strategic deal signed with leading U.S. analog semiconductor company for Ceva-Waves Bluetooth portfolio
ROCKVILLE, Md., Aug. 7, 2024 /PRNewswire/ — Ceva, Inc. (NASDAQ: CEVA), the leading licensor of silicon and software IP that enables Smart Edge devices to connect, sense and infer data more reliably and efficiently, today announced its financial results for the second quarter ended June 30, 2024. Financial results for the second quarter ended June 30, 2023, reflect Ceva’s continuing operations only, with the Intrinsix business reflected as a discontinued operation, unless otherwise noted.
We are pleased to report strong execution and results for the second quarter that exceeded our estimates.
Operational Highlights:
Launched Ceva-Waves-Links, a Multi-Protocol wireless platform IP family to accelerate enhanced connectivity in MCUs and SOCs for IoT and Smart Edge AI applicationsExtended its Smart Edge IP leadership with Ceva-NeuPro-Nano, a TinyML Optimized family of NPUs for AIoT devicesAchieved an important milestone of surpassing 18 billion Ceva-powered devices shipped
Total revenue for the second quarter of 2024 was $28.4 million, up 24%, compared to $22.9 million reported for the second quarter of 2023. Licensing and related revenue for the second quarter of 2024 was $17.3 million, up 28%, compared to $13.6 million reported for the same quarter a year ago. Royalty revenue for the second quarter of 2024 was $11.2 million, up 19%, compared to $9.4 million reported for the same quarter a year ago.
Amir Panush, Chief Executive Officer of Ceva, commented: “We are pleased to report strong execution and results for the second quarter that exceeded our estimates, with licensing revenue and royalty revenue growing 28% and 19%, respectively, year over-year. In licensing, customer demand for our IP portfolio is being driven by the growing adoption of AI across every industry and every device. We signed a number of strategic deals in the quarter, including one with a leading U.S. analog semiconductor company for our Bluetooth portfolio and two with our large OEM customers in wireless infrastructure for their development of next-generation ASICs to address the incredible growth in network traffic and performance improvements required to support Generative AI and Hybrid AI systems. Our royalty business grew on the back of broad market strength and market share gains in IoT, and strong growth in the smartphone market.”
During the quarter, eleven IP licensing agreements were concluded, targeting a wide range of end markets and applications, including AI solutions for industrial and consumer edge AI devices, next-generation wireless infrastructure to enable ubiquitous AI, 5G satellite, 5G RedCap and Bluetooth connectivity for wearables and hearables. Five of the deals signed in the quarter were with OEMs and one deal signed was with a first-time customer.
GAAP gross margin for the second quarter of 2024 was 90%, as compared to 85% in the second quarter of 2023. GAAP operating loss for the second quarter of 2024 was $0.04 million, as compared to a GAAP operating loss of $5.3 million for the same period in 2023. GAAP net loss for the second quarter of 2024 was $0.3 million, as compared to a GAAP net loss of $4.9 million reported for the same period in 2023. GAAP diluted loss per share for the second quarter of 2024 was $0.01, as compared to GAAP diluted loss per share of $0.21 for the same period in 2023.
GAAP net loss with the discontinued operation for the second quarter of 2023 was $5.8 million. GAAP diluted loss per share with the discontinued operation for the second quarter of 2023 was $0.25.
Non-GAAP gross margin for the second quarter of 2024 was 91%, as compared to 86% for the same period in 2023. Non-GAAP operating income for the second quarter of 2024 was $4.4 million, as compared to non-GAAP operating loss of $1.1 million reported for the second quarter of 2023. Non-GAAP net income and diluted income per share for the second quarter of 2024 were $4.2 million and $0.17, respectively, compared with non-GAAP net loss and diluted loss per share of $0.5 million and $0.02, respectively, reported for the second quarter of 2023.
Non-GAAP net loss including the discontinued operation for the second quarter of 2023 was $0.5 million. Non-GAAP diluted loss per share including the discontinued operation for the second quarter of 2023 was $0.02.
Yaniv Arieli, Chief Financial Officer of Ceva, stated: “Our excellent second quarter performance generated top line growth of 24% year-over-year and coupled with disciplined expense control, enabled us to expand our adjusted operating margin to 15%. We are encouraged by the strength of our licensing pipeline and royalty growth potential from our broad and diversified customer base and reflecting this, we continued to buy back the company’s stock during the quarter, repurchasing approximately 100,000 shares for approximately $2 million under our stock repurchase program. At the end of the quarter, our cash and cash equivalent balances, marketable securities and bank deposits were approximately $158 million, which we can leverage to grow our share in edge AI and other high-growth markets.”
Ceva Conference Call
On August 7, 2024, Ceva management will conduct a conference call at 8:30 a.m. Eastern Time to discuss the operating performance for the quarter.
The conference call will be available via the following dial in numbers:
U.S. Participants : Dial 1-844-435-0316 (Access Code : Ceva)International Participants: Dial +1-412-317-6365 (Access Code: Ceva)
The conference call will also be available live via webcast at the following link: https://app.webinar.net/8mGNyBxXMLR. Please go to the web site at least fifteen minutes prior to the call to register.
For those who cannot access the live broadcast, a replay will be available by dialing +1-877-344-7529 or +1-412-317-0088 (access code: 2162644) from one hour after the end of the call until 9:00 a.m. (Eastern Time) on Aug 14, 2024. The replay will also be available at Ceva’s web site www.ceva-ip.com.
Forward Looking Statements
This press release contains forward-looking statements that involve risks and uncertainties, as well as assumptions that if they materialize or prove incorrect, could cause the results of Ceva to differ materially from those expressed or implied by such forward-looking statements and assumptions. Forward-looking statements include statements regarding the customer demand for Ceva’s IP portfolio being driven by the growing adoption of AI across every industry and every device, the strength of Ceva’s licensing pipeline and royalty growth potential, and Ceva’s ability to leverage its capital resources to grow its share in edge AI and other high-growth markets. The risks, uncertainties and assumptions that could cause differing Ceva results include: the effect of intense industry competition; the ability of Ceva’s technologies and products incorporating Ceva’s technologies to achieve market acceptance; Ceva’s ability to meet changing needs of end-users and evolving market demands; the cyclical nature of and general economic conditions in the semiconductor industry; Ceva’s ability to diversify its royalty streams and license revenues; Ceva’s ability to continue to generate significant revenues from the handset baseband market and to penetrate new markets; instability and disruptions related to the ongoing Israel–Gaza conflict; and general market conditions and other risks relating to Ceva’s business, including, but not limited to, those that are described from time to time in our SEC filings. Ceva assumes no obligation to update any forward-looking statements or information, which speak as of their respective dates.
Non-GAAP Financial Measures
Non-GAAP gross margin for both the second quarters of 2024 and 2023 excluded: (a) equity-based compensation expenses of $0.2 million and (b) amortization of acquired intangibles of $0.1 million.
Non-GAAP operating income for the second quarter of 2024 excluded: (a) equity-based compensation expenses of $3.9 million, (b) the impact of the amortization of acquired intangibles of $0.3 million, and (c) $0.3 million of costs associated with business acquisitions. Non-GAAP operating loss for the second quarter of 2023 excluded: (a) equity-based compensation expenses of $3.9 million, (b) the impact of the amortization of acquired intangibles of $0.3 million, and (c) $0.1 million of costs associated with business acquisitions.
Non-GAAP net loss and diluted loss per share for the second quarter of 2024 excluded: (a) equity-based compensation expenses of $3.9 million, (b) the impact of the amortization of acquired intangibles of $0.3 million, (c) $0.3 million of costs associated with business acquisitions and (d) $0.1 million loss associated with the remeasurement of marketable equity securities. Non-GAAP net loss and diluted loss per share for the second quarter of 2023 excluded: (a) equity-based compensation expenses of $3.9 million, (b) the impact of the amortization of acquired intangibles of $0.3 million, (c) $0.1 million of costs associated with business acquisitions and (d) $0.1 million loss associated with the remeasurement of marketable equity securities.
Non-GAAP net loss including the discontinued operation and diluted loss per share including the discontinued operation for the second quarter of 2023 excluded: (a) equity-based compensation expenses of $3.9 million, (b) the impact of the amortization of acquired intangibles of $0.3 million, (c) $0.1 million of costs associated with business acquisitions, (d) $0.1 million loss associated with the remeasurement of marketable equity securities and (e) $1.0 million loss associated with discontinued operations.
About Ceva, Inc.
At Ceva, we are passionate about bringing new levels of innovation to the smart edge. Our wireless communications, sensing and Edge AI technologies are at the heart of some of today’s most advanced smart edge products. From Bluetooth connectivity, Wi-Fi, UWB and 5G platform IP for ubiquitous, robust communications, to scalable Edge AI NPU IPs, sensor fusion processors and embedded application software that make devices smarter, we have the broadest portfolio of IP to connect, sense and infer data more reliably and efficiently. We deliver differentiated solutions that combine outstanding performance at ultra-low power within a very small silicon footprint. Our goal is simple – to deliver the silicon and software IP to enable a smarter, safer, and more interconnected world. This philosophy is in practice today, with Ceva powering more than 18 billion of the world’s most innovative smart edge products from AI-infused smartwatches, IoT devices and wearables to autonomous vehicles and 5G mobile networks.
Our headquarters are in Rockville, Maryland with a global customer base supported by operations worldwide. Our employees are among the leading experts in their areas of specialty, consistently solving the most complex design challenges, enabling our customers to bring innovative smart edge products to market.
Ceva is a sustainability- and environmentally-conscious company, adhering to our Code of Business Conduct and Ethics. As such, we emphasize and focus on environmental preservation, recycling, the welfare of our employees and privacy – which we promote on a corporate level. At Ceva, we are committed to social responsibility, values of preservation and consciousness towards these purposes.
Ceva: Powering the Smart Edge™
Visit us at www.ceva-ip.com and follow us on LinkedIn, X, YouTube, Facebook, and Instagram.
Ceva, Inc. AND ITS SUBSIDIARIES
INTERIM CONDENSED CONSOLIDATED STATEMENTS OF LOSS – U.S. GAAP
U.S. dollars in thousands, except per share data
Three months ended
Six months ended
June 30,
June 30,
2024
2023
2024
2023
Unaudited
Unaudited
Unaudited
Unaudited
Revenues:
Licensing and related revenues
$ 17,278
$ 13,551
$ 28,692
$ 31,799
Royalties
11,159
9,371
21,817
17,385
Total revenues
28,437
22,922
50,509
49,184
Cost of revenues
2,933
3,524
5,436
7,032
Gross profit
25,504
19,398
45,073
42,152
Operating expenses:
Research and development, net
18,758
18,056
36,749
36,730
Sales and marketing
3,095
2,632
5,911
5,351
General and administrative
3,537
3,911
7,109
7,738
Amortization of intangible assets
149
142
299
296
Total operating expenses
25,539
24,741
50,068
50,115
Operating loss
(35)
(5,343)
(4,995)
(7,963)
Financial income, net
1,406
1,118
2,663
2,573
Reevaluation of marketable equity securities
(58)
(119)
(118)
(236)
Income (loss) before taxes on income
1,313
(4,344)
(2,450)
(5,626)
Income tax expense
1,604
546
3,289
1,963
Net loss from continuing operation
(291)
(4,890)
(5,739)
(7,589)
Discontinued operation
—
(928)
—
(3,101)
Net loss
$ (291)
$ (5,818)
$ (5,739)
$ (10,690)
Basic and diluted net loss per share:
Continuing operation
$ (0.01)
$ (0.21)
$ (0.24)
$ (0.32)
Discontinued operation
—
(0.04)
—
(0.13)
Basic and diluted net loss per share
$ (0.01)
$ (0.25)
$ (0.24)
$ (0.46)
Weighted-average shares used to compute net loss
per share (in thousands):
Basic and diluted
23,628
23,476
23,568
23,405
Unaudited Reconciliation of GAAP to Non-GAAP Financial Measures
U.S. Dollars in thousands, except per share amounts
Three months ended
Six months ended
June 30,
June 30,
2024
2023
2024
2023
Unaudited
Unaudited
Unaudited
Unaudited
GAAP net loss
$ (291)
$ (5,818)
$ (5,739)
$ (10,690)
Equity-based compensation expense included in cost of
revenues
191
214
394
420
Equity-based compensation expense included in research
and development expenses
2,438
2,344
4,445
4,446
Equity-based compensation expense included in sales
and marketing expenses
451
449
816
827
Equity-based compensation expense included in general
and administrative expenses
820
903
1,816
1,769
Amortization of intangible assets related to acquisition
of businesses
278
251
556
475
Costs associated with business and asset acquisitions
252
95
532
95
Loss associated with the remeasurement of marketable
equity securities
58
119
118
236
Non-GAAP from discontinued operations
0
963
0
2,049
Non-GAAP net income (loss)
$ 4,197
$ (480)
$ 2,938
$ (373)
GAAP weighted-average number of Common Stock
used in computation of diluted net loss and loss per share
(in thousands)
23,628
23,476
23,568
23,405
Weighted-average number of shares related to
outstanding stock-based awards (in thousands)
1,482
—
1,421
—
Weighted-average number of Common Stock used in
computation of diluted earnings per share, excluding the
above (in thousands)
25,110
23,476
24,989
23,405
GAAP diluted loss per share
$ (0.01)
$ (0.25)
$ (0.24)
$ (0.46)
Equity-based compensation expense
$ 0.16
$ 0.17
$ 0.32
$ 0.32
Amortization of intangible assets related to acquisition
of businesses
$ 0.01
$ 0.01
$ 0.02
$ 0.02
Costs associated with business and asset acquisitions
$ 0.01
$ 0.00
$ 0.02
$ 0.00
Loss associated with the remeasurement of marketable
equity securities
$ 0.00
$ 0.01
$ 0.00
$ 0.01
Non-GAAP from discontinued operation
—
$ 0.04
—
$ 0.09
Non-GAAP diluted earnings (loss) per share
$ 0.17
$ (0.02)
$ 0.12
$ (0.02)
Three months ended
Six months ended
June 30,
June 30,
2024
2023
2024
2023
Unaudited
Unaudited
Unaudited
Unaudited
GAAP Operating loss
$ (35)
$ (5,343)
$ (4,995)
$ (7,963)
Equity-based compensation expense included in cost of revenues
191
214
394
420
Equity-based compensation expense included in research and development expenses
2,438
2,344
4,445
4,446
Equity-based compensation expense included in sales and marketing expenses
451
449
816
827
Equity-based compensation expense included in general and administrative expenses
820
903
1,816
1,769
Amortization of intangible assets related to acquisition of businesses
278
251
556
475
Costs associated with business and asset acquisitions
252
95
532
95
Total non-GAAP Operating Income (Loss)
$ 4,395
$ (1,087)
$ 3,564
$ 69
Three months ended
Six months ended
June 30,
June 30,
2024
2023
2024
2023
Unaudited
Unaudited
Unaudited
Unaudited
GAAP Gross Profit
$ 25,504
$ 19,398
$ 45,073
$ 42,152
GAAP Gross Margin
90 %
85 %
89 %
86 %
Equity-based compensation expense included in cost of revenues
191
214
394
420
Amortization of intangible assets related to acquisition of businesses
129
109
257
179
Total Non-GAAP Gross profit
25,824
19,721
45,724
42,751
Non-GAAP Gross Margin
91 %
86 %
91 %
87 %
Ceva, Inc. AND ITS SUBSIDIARIES
INTERIM CONDENSED CONSOLIDATED BALANCE SHEETS
(U.S. Dollars in thousands)
June 30,
December 31,
2024
2023 (*)
Unaudited
Unaudited
ASSETS
Current assets:
Cash and cash equivalents
$ 24,702
$ 23,287
Marketable securities and short-term bank deposits
133,709
143,251
Trade receivables, net
18,298
8,433
Unbilled receivables
17,357
21,874
Prepaid expenses and other current assets
13,201
12,526
Total current assets
207,267
209,371
Long-term assets:
Severance pay fund
6,762
7,070
Deferred tax assets, net
1,317
1,609
Property and equipment, net
6,843
6,732
Operating lease right-of-use assets
6,137
6,978
Investment in marketable equity securities
288
406
Goodwill
58,308
58,308
Intangible assets, net
2,411
2,967
Other long-term assets
11,069
10,644
Total assets
$ 300,402
$ 304,085
LIABILITIES AND STOCKHOLDERS’ EQUITY
Current liabilities:
Trade payables
$ 1,092
$ 1,154
Deferred revenues
2,830
3,018
Accrued expenses and other payables
18,445
20,202
Operating lease liabilities
2,615
2,513
Total current liabilities
24,982
26,887
Long-term liabilities:
Accrued severance pay
7,210
7,524
Operating lease liabilities
2,964
3,943
Other accrued liabilities
1,460
1,390
Total liabilities
36,616
39,744
Stockholders’ equity:
Common stock
24
23
Additional paid in-capital
254,302
252,100
Treasury stock
(1,917)
(5,620)
Accumulated other comprehensive loss
(2,894)
(2,329)
Retained earnings
14,271
20,167
Total stockholders’ equity
263,786
264,341
Total liabilities and stockholders’ equity
$ 300,402
$ 304,085
(*) Derived from audited financial statements.
View original content to download multimedia:https://www.prnewswire.com/news-releases/ceva-inc-announces-second-quarter-2024-financial-results-302215835.html
SOURCE Ceva, Inc.


 Technology4 days ago
 Technology5 days ago
 Technology5 days ago
 Coin Market4 days ago
 Technology4 days ago
 Coin Market3 days ago
 Technology3 days ago