
Technology
US Interactive Residential Security Market to Grow by USD 2.97 Billion (2024-2028), Rising Crime Rates and AI Innovations Drive Market – Technavio Report

Published
2 years agoon
By
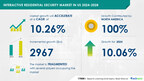
NEW YORK, Sept. 12, 2024 /PRNewswire/ — Report with market evolution powered by AI- The interactive residential security market size in US is estimated to grow by USD 2.96 billion from 2024-2028, according to Technavio. The market is estimated to grow at a CAGR of 10.26% during the forecast period. Rising crime rates across US is driving market growth, with a trend towards increasing focus of vendors on new product launches. However, high initial costs related to interactive residential security solutions poses a challenge. Key market players include ADT Inc., Alphabet Inc., AT and T, Comcast Corp., Cove Smart LLC, East West Manufacturing, Frontpoint Security Solutions LLC, Honeywell International Inc., Leviton Manufacturing Co. Inc., LG Electronics Inc., Link Interactive, Monitronics International Inc., NETGEAR Inc., Nice SpA, Nortek Security and Control LLC, Ring LLC, Samsung Electronics Co. Ltd., Scout Security Ltd., Simplisafe Inc., Somfy Group, Vivint Inc., and Wyze Labs Inc..
Key insights into market evolution with AI-powered analysis. Explore trends, segmentation, and growth drivers- View the snapshot of this report
Interactive Residential Security Market In US Scope
Report Coverage
Details
Base year
2023
Historic period
2018 – 2022
Forecast period
2024-2028
Growth momentum & CAGR
Accelerate at a CAGR of 10.26%
Market growth 2024-2028
USD 2967 million
Market structure
Fragmented
YoY growth 2022-2023 (%)
10.06
Regional analysis
US
Performing market contribution
North America at 100%
Key countries
US and North America
Key companies profiled
ADT Inc., Alphabet Inc., AT and T, Comcast Corp., Cove Smart LLC, East West Manufacturing, Frontpoint Security Solutions LLC, Honeywell International Inc., Leviton Manufacturing Co. Inc., LG Electronics Inc., Link Interactive, Monitronics International Inc., NETGEAR Inc., Nice SpA, Nortek Security and Control LLC, Ring LLC, Samsung Electronics Co. Ltd., Scout Security Ltd., Simplisafe Inc., Somfy Group, Vivint Inc., and Wyze Labs Inc.
Market Driver
The interactive residential security market in the US is witnessing significant growth due to vendors’ increasing focus on new product development. As competition intensifies and consumer expectations evolve, companies are investing heavily in creating innovative security solutions to differentiate themselves and capture market share. This new product development includes integrating advanced technologies such as AI and machine learning for enhanced threat detection and improving system compatibility with smart home ecosystems for greater convenience and control. For instance, Brinks Home, a leading home security and alarm monitoring company, introduced Vacation Watch and Package Detection features in August 2024. Vacation Watch allows users to create temporary rules for automatic recording during their absence, while Package Detection alerts homeowners upon package delivery and retrieval, providing video clips for identification. In May 2022, Vivint unveiled a suite of new products, including the Doorbell Camera Pro, Outdoor Camera Pro, Spotlight Pro, and Indoor Camera Pro, each integrating with Vivint’s AI platform and offering advanced functionalities. Such new innovations by vendors will continue to drive the growth of the interactive residential security market in the US during the forecast period.
The Interactive Residential Security market in the US is thriving, with a focus on advanced safety measures for homes. Security systems are becoming smarter, featuring energy-saving solutions and low consumption wireless technology. Miniaturized sensors and cameras enable DIY installation, while home automation integrates security with other smart devices. Video Surveillance Systems, Alarm Systems, Access Control Systems, and Fire Protection Services are in high demand. Internet usage and cloud services are essential for remote monitoring and cybersecurity. Security concerns include theft and robbery statistics, particularly for single-parent families. Smart City projects are exploring integrated security solutions. Installation costs and system complexities are key challenges, but AI, facial recognition, and cloud-based surveillance offer innovative solutions. Home Security Systems and Smart Home Security are merging, with sensors, cameras, and remote monitoring at their core. Personal security is also a growing concern, with hardware and software offerings addressing these needs.
Request Sample of our comprehensive report now to stay ahead in the AI-driven market evolution!
Market Challenges
The interactive residential security market in the US faces a significant challenge due to high upfront costs, which can deter potential customers. Installing comprehensive security solutions involves substantial expenses for hardware, such as cameras, sensors, smart locks, and control panels, as well as fees for professional installation services. For instance, leading providers like ADT and Vivint offer full-featured systems with several hundred to thousands of dollars in initial costs and monthly monitoring fees. These ongoing commitments can be prohibitive for budget-conscious consumers or those uncertain of the systems value. Furthermore, the need for regular maintenance and technology upgrades adds to the financial burden. To make these systems more accessible, companies must provide flexible financing options, such as installment plans or leasing agreements. Failure to address cost concerns may limit market growth potential in the US interactive residential security market during the forecast period.The Interactive Residential Security market in the US is experiencing significant growth due to increasing security concerns among homeowners. Key products include Access Control Systems, Intruder Alarm Systems, Remote Monitoring Services, and Cloud services. Challenges include the integration of Smart City ideas, cybersecurity, and system complexities. Home Security Systems and Smart Home Security are popular solutions, utilizing Sensors, Cameras, and Remote Monitoring. Theft and robbery statistics, especially for single-parent families, fuel demand. Smart Homes, with Fire Protection Services, Home Automation, Property Monitoring, Power Management, Visit Management, and more, offer enhanced security. Installation costs and DIY installation are concerns, but advancements in Artificial Intelligence, Facial Recognition, Cloud-Based Surveillance, and Personal Security are driving innovation. Hardware and Software solutions, including Alarm Systems, Access Control Systems, and Video Surveillance Systems, are essential components. Fire Protection Services ensure safety, while Apartment and Unit security is a growing niche. Overall, the market is dynamic, with ongoing advancements and evolving consumer needs.
Discover how AI is revolutionizing market trends- Get your access now!
Segment Overview
This interactive residential security market in US report extensively covers market segmentation by
Type 1.1 Property monitoring1.2 Visit management1.3 Phone and wireless security1.4 Power managementApplication 2.1 Apartment2.2 Standalone unitService 3.1 Intrusion protection3.2 Remote monitoring3.3 Security system integration service3.4 OthersGeography 4.1 North America
1.1 Property monitoring- The Interactive Residential Security Market in the US is experiencing significant growth. Homeowners are increasingly investing in advanced security systems that offer remote monitoring and control. These systems include features like motion sensors, door and window sensors, and smartphone app integration. Major players in the market include ADT, Simplisafe, and Vivint. These companies provide customizable plans to meet various home security needs. The market is expected to continue expanding due to the rising demand for enhanced home security solutions.
Download a Sample of our comprehensive report today to discover how AI-driven innovations are reshaping competitive dynamics
Research Analysis
The Interactive Residential Security market in the US is experiencing significant growth due to the increasing demand for advanced safety measures in homes. Residential Security systems are no longer just about deterrence against burglary and theft, but also include energy-saving solutions, remote monitoring, and smart features. These systems use wireless technology, miniaturized sensors, and cameras to provide comprehensive security. Smart Home Security systems are becoming increasingly popular, integrating with other smart devices and the internet for convenient and efficient control. However, technical flaws and cybersecurity concerns are areas of improvement. The market caters to various demographics, including single-parent families, apartments, and units, as well as larger properties and smart city projects. Property Monitoring, Power Management, Visit Management, and Burglary Statistics are key considerations for potential buyers. The market is expected to continue growing due to increasing crime rates and the desire for peace of mind and convenience.
Market Research Overview
The Interactive Residential Security market in the US is a growing industry focused on providing advanced security solutions for homes. Residential Security systems encompass various safety measures such as Alarm Systems, Access Control Systems, Fire Protection Services, and Video Surveillance Systems. These systems leverage Smart Features like wireless technology, miniaturized sensors, and Internet usage to enhance security and offer energy-saving solutions with low energy consumption. Smart Home Security is a popular trend, integrating Home Automation, remote monitoring, and cloud services. DIY solutions are also gaining traction, allowing homeowners to install their systems without professional help. Security concerns include technical flaws, cybersecurity threats, and theft and robbery statistics. Single-parent families, apartments, and units also benefit from these systems. Home Security Systems can include hardware like sensors, cameras, and software for remote monitoring and artificial intelligence capabilities like facial recognition. Smart City projects are exploring the integration of these systems into larger community security networks. Installation costs and system complexities are ongoing considerations, with the potential for significant savings through DIY installation and power management. Property Security is a top priority for homeowners, with solutions addressing both personal and property monitoring needs.
Table of Contents:
1 Executive Summary
2 Market Landscape
3 Market Sizing
4 Historic Market Size
5 Five Forces Analysis
6 Market Segmentation
TypeProperty MonitoringVisit ManagementPhone And Wireless SecurityPower ManagementApplicationApartmentStandalone UnitServiceIntrusion ProtectionRemote MonitoringSecurity System Integration ServiceOthersGeographyNorth America
7 Customer Landscape
8 Geographic Landscape
9 Drivers, Challenges, and Trends
10 Company Landscape
11 Company Analysis
12 Appendix
About Technavio
Technavio is a leading global technology research and advisory company. Their research and analysis focuses on emerging market trends and provides actionable insights to help businesses identify market opportunities and develop effective strategies to optimize their market positions.
With over 500 specialized analysts, Technavio’s report library consists of more than 17,000 reports and counting, covering 800 technologies, spanning across 50 countries. Their client base consists of enterprises of all sizes, including more than 100 Fortune 500 companies. This growing client base relies on Technavio’s comprehensive coverage, extensive research, and actionable market insights to identify opportunities in existing and potential markets and assess their competitive positions within changing market scenarios.
Contacts
Technavio Research
Jesse Maida
Media & Marketing Executive
US: +1 844 364 1100
UK: +44 203 893 3200
Email: media@technavio.com
Website: www.technavio.com/
View original content to download multimedia:https://www.prnewswire.com/news-releases/us-interactive-residential-security-market-to-grow-by-usd-2-97-billion-2024-2028-rising-crime-rates-and-ai-innovations-drive-market–technavio-report-302245109.html
SOURCE Technavio

You may like
Technology
Scott Zack’s Creek Equity Details Healthcare Services Portfolio Spanning Supply Chain, Pharmacy Benefits, and Medical Courier Logistics
Published
12 minutes agoon
October 28, 2026By

Bloomfield Hills investment company’s operating businesses serve hospitals, health systems, laboratories, employers, and benefit funds across Michigan and beyond.
BLOOMFIELD HILLS, Mich., Oct. 28, 2026 /PRNewswire/ — Creek Equity, the private investment company founded and owned by investor and entrepreneur Scott Zack, today detailed the portfolio of healthcare services companies it has built and backed, which now spans healthcare supply chain, pharmacy benefit management, and medical courier logistics.
Creek Equity founds companies, backs founders with early capital, and acquires established businesses, investing its own capital and holding for the long term.
“Healthcare wastes enormous money between the people who pay and the people who deliver care,” said Zack, Founder and Owner of Creek Equity. “Each of our companies fixes one piece: what hospitals buy, what plans pay for drugs, and how specimens get from clinic to lab.”
The portfolio includes Avenix Medical Group, a healthcare supply chain partner providing strategic sourcing, supplier visibility, risk monitoring, and continuity planning for hospitals, health systems, physician groups, and post-acute care; Movanti Group, a transparent, 100 percent pass-through pharmacy benefit manager for employers, unions, and benefit funds; Total Routing Solutions, a medical courier providing specimen pickup and delivery for clinical laboratories and other healthcare companies; and Avenix Solutions Group, a procurement-optimization partner for automotive, healthcare, and hospitality. Creek Equity also owns Blue Cypress, its real estate arm, and Creek Equity Advisors, its advisory affiliate
Creek Equity typically holds majority or founding positions and works directly with management on operations, procurement, and growth. Its full portfolio and Investment Principles are published at https://www.creekequity.com.
About Creek Equity
Creek Equity is a private investment company in Bloomfield Hills, Michigan, owned by Scott Zack, that founds, funds, and acquires businesses across healthcare services, supply chain, logistics, and real estate. The firm invests its own capital and holds for the long term. Creek Equity is a BBB Accredited Business with an A+ rating.
About Scott Zack
Scott Zack is an investor and entrepreneur based in Bloomfield Hills, Michigan, and the Founder and Owner of Creek Equity. A former basketball player at The Ohio State University, he has founded, acquired, operated, and sold businesses in healthcare, supply chain, construction, and real estate.
Media Contact: Scott Zack, scott@creekequity.com
“Press Release Service” should be linked to https://www.24-7pressrelease.com/.
View original content to download multimedia:https://www.prnewswire.com/news-releases/scott-zacks-creek-equity-details-healthcare-services-portfolio-spanning-supply-chain-pharmacy-benefits-and-medical-courier-logistics-302921708.html
SOURCE Creek Equity
Technology
Ceva Unveils Next-Generation NeuPro NPU Portfolio and Announces Expansion into AI Infrastructure
Published
12 minutes agoon
October 28, 2026By

A common architecture and unified software stack span Physical AI applications from always-on sensors to AI infrastructure, delivering up to 2X higher AI throughput per mm² and 50% better energy efficiency for the latest multimodal, generative and agentic AI workloads
ROCKVILLE, Md., Oct. 28, 2026 /PRNewswire/ — Ceva, Inc. (NASDAQ: CEVA), the leading licensor of silicon and software IP that powers the Smart Edge, today unveiled its next-generation NeuPro™ NPU portfolio, featuring expanded capabilities and delivering up to 2X higher AI throughput per mm² and a 50% improvement in energy efficiency versus the first generation.
Built on a common architecture and unified software stack, the new portfolio is designed to support increasingly demanding multimodal, generative and agentic AI workloads across Physical AI applications, from always-on sensing to advanced edge systems. The new architecture also marks Ceva’s expansion into AI infrastructure, enabling intelligent memory, connectivity and data-processing silicon, as well as custom AI inference processors for cloud and data centers.
Physical AI systems increasingly rely on multiple AI models and intelligent agents working together, with perception and real-time responses close to the sensor and more complex reasoning and orchestration distributed across devices, edge systems and the cloud. This shift toward hybrid AI is accelerating. Yet wherever inference takes place, a common challenge remains: the power and performance cost of the compute itself and of moving data to and from it. At the sensor, that cost is measured in microwatts and square millimeters; in the data center, in megawatts and memory bandwidth. The same constraint appears in different forms, which calls for neural processing optimized for each workload, supported by a common architecture and software environment.
The next-generation NeuPro portfolio addresses both: a range of engines sized for different points in the system, and one way to develop for all of them. A unified software development kit spans the portfolio so semiconductor designers can match an engine to each part of their system or combine several within one SoC while preserving their software investment.
“Working closely with the more than 15 customers who have licensed the first generation of NeuPro has shown us that successful AI products depend on the right balance of compute, memory, bandwidth, power and cost for each use case,” said Yaron Galitzky, Executive Vice President, AI Division at Ceva. “Our team designed this next generation around those lessons, giving customers more room to deploy demanding models today and prepare for the workloads ahead.”
Built for the Next Generation of Inference
Peak compute alone no longer defines AI system performance. Semiconductor developers must deliver optimal inference throughput within demanding power, area and memory constraints, while ensuring their architectures can support new models throughout the product lifecycle. The next-generation NeuPro architecture is designed to address both challenges.
The architecture introduces capabilities for workloads ranging from perception and classification to transformer-based, multimodal, generative and agentic workloads, including Physical AI applications:
Up to 2X higher AI throughput per mm² and a 50% improvement in energy efficiency versus the first generation.Advanced AI numerics and mixed precision, including FP4 and FP8, improving inference efficiency while reducing memory and data-movement requirements.Higher memory bandwidth and advanced memory management, including dynamic shapes and paged KV cache, addressing longer contexts and memory-intensive transformer workloads.Higher multiply-accumulate (MAC) utilization through optimized tensor reshaping, maximizing the effective use of compute resources to improve inference performance.Support for the latest network architectures, including Mixture-of-Experts and linear attention, with the architectural flexibility to accommodate model types that have not yet emerged.Support for pre-quantized models, allowing customers to deploy published checkpoints without a separate quantization and calibration step.Advanced compression, quantization and pruning, reducing computation and data movement to improve effective performance per watt and per unit area.
A Portfolio for Different Inference Workloads
The next-generation NeuPro portfolio comprises four NPUs:
NeuPro Nano targets always-on sensing and entry-level perception in highly constrained devices.NeuPro Prime addresses mainstream CNN and transformer workloads.NeuPro Max scales to advanced edge AI, including high-resolution perception, multimodal models, on-device assistants, robotics, Physical AI and agentic AI.NeuPro Ultra targets AI infrastructure applications, supporting both complex large language model inference in cloud and data centers and intelligent memory, connectivity and data-processing silicon that improves overall AI system efficiency.
All four are built on a common core architecture and supported by a single unified SDK, so tools, development flow and software investment carry across the portfolio. Designers can move between cores as requirements change, or combine several within one SoC and assign each workload to the engine best suited to it. For semiconductor companies, that means addressing multiple AI markets and performance points from one development foundation, reducing integration complexity and shortening development across successive product generations.
Extending Neural Processing into AI Infrastructure
As large language model inference runs into memory constraints, customers are redesigning data center systems, distributing compute differently across them and integrating it in places it has not previously been, including within memory and networking subsystems. Inference at scale serves many models and many users at once, and memory bandwidth and data movement between memory, compute and networks have become central to system performance and power efficiency. ABI Research forecasts cloud AI inference capacity to grow at a 42% CAGR through 2035(i).
NeuPro Ultra is built for that redesign. It supports complex large language models in cloud and data center inference, with multi-core processing, multi-user operation, high memory bandwidth and advanced memory management, together with support for the software frameworks used in those deployments. It can equally be integrated into memory and connectivity subsystems of the same system, applying neural processing to the movement of data rather than to the model itself, reducing unnecessary transfers and relieving bottlenecks closer to where data is stored. Silicon developers can add these capabilities using Ceva’s licensable NPU foundation and the same software stack used across the portfolio.
“A common NPU architecture and software stack across every class of AI workload lets our customers build once and deploy across their roadmap,” said Amir Panush, Chief Executive Officer of Ceva. “NeuPro Ultra brings that platform into AI infrastructure, an important step in Ceva’s strategy to put neural processing into a broader range of semiconductor products. Customers building silicon for these markets can draw on Ceva’s architecture, software and experience rather than developing an NPU platform from scratch.”
Ceva will discuss the next-generation NeuPro portfolio and its Physical AI strategy in more detail at its technology symposium events in Hsinchu, Taiwan, on November 2 and in Shanghai, China, on November 5. To learn more about these events and to register to attend, visit https://www.ceva-ip.com/symposium-2026/.
Availability
Leading semiconductor and system companies are already evaluating and integrating next-generation NeuPro technology for future AI products. These early engagements span multiple market segments and help shape deployments targeting advanced edge, Physical AI and AI infrastructure applications. The next-generation NeuPro architecture is available now to select early-access customers, with general availability planned for the second quarter of 2027.
About Ceva, Inc.
Ceva powers the Smart Edge, bridging the digital and physical worlds to bring AI-driven products to life. Our Ceva AI fabric portfolio of silicon and software IP enables devices to Connect, Sense, and Infer – the essential capabilities for the intelligent edge. From 5G, cellular IoT, Bluetooth, Wi-Fi, and UWB connectivity to scalable Edge AI NPUs, AI DSPs, sensor fusion processors and embedded software, Ceva provides the foundational IP for devices that connect, understand their environment, and act in real time.
With more than 22 billion devices shipped and trusted by 400+ customers worldwide, Ceva is the backbone of today’s most advanced smart edge products – from AI-infused wearables and IoT devices to autonomous vehicles and 5G infrastructure. Our differentiated solutions deliver seamless integration into existing design flows, total flexibility to combine solutions based on design needs and ultra‑low‑power performance in minimal silicon footprint, helping customers accelerate development, reduce risk, and bring innovative products to market faster. As technology evolves toward Physical AI, Ceva’s IP portfolio lays the foundation for systems that are always connected, contextually aware, and capable of intelligent, real-time decision-making.
Visit us at www.ceva-ip.com and follow us on LinkedIn, X, YouTube, Facebook, and Instagram.
View original content to download multimedia:https://www.prnewswire.com/news-releases/ceva-unveils-next-generation-neupro-npu-portfolio-and-announces-expansion-into-ai-infrastructure-302921417.html
SOURCE Ceva, Inc.
Technology
Blackbaud Announces 2026 Third Quarter Financial Results
Published
12 minutes agoon
October 28, 2026By

Blackbaud Expands AI Leadership Through Numerous Innovation Announcements at bbcon User Conference
CHARLESTON, S.C., Oct. 28, 2026 /PRNewswire/ — Blackbaud (NASDAQ: BLKB), the world’s leading provider of AI-powered solutions for social impact, today announced financial results for its third quarter ended September 30, 2026.
“Innovation continues to drive our clear market leadership and a widening competitive moat,” said Mike Gianoni, president, CEO and vice chairman of the board of directors, Blackbaud. “As demonstrated at our recent bbcon conference in September, we continue to make significant investments in AI, empowering our customers to deepen constituent relationships, raise more money and operate more efficiently. For investors, we believe Blackbaud is a sound investment choice that has the potential to create shareholder value—a belief that is supported by our strong 2026 year-to-date financial results and accelerating pace of innovation. I continue to be excited about the company’s momentum in the near, mid and long term.”
Third Quarter 2026 Results Compared to Third Quarter 2025 Results:
GAAP total revenue was $292.6 million, up 4.1% and non-GAAP organic revenue increased 4.1%.GAAP recurring revenue was $287.0 million, up 4.1% and represented 98.1% of total revenue. Non-GAAP organic recurring revenue increased 4.1%.GAAP income from operations was $60.0 million, with GAAP operating margin of 20.5%, an increase of 110 basis points.Non-GAAP income from operations was $94.6 million, with non-GAAP operating margin of 32.3%, an increase of 240 basis points.GAAP net income was $46.1 million, with GAAP diluted earnings per share of $1.02, up $0.04 per share.Non-GAAP net income was $61.2 million, with non-GAAP diluted earnings per share of $1.36, up $0.26 per share.Non-GAAP adjusted EBITDA was $111.1 million, up $11.4 million, with non-GAAP adjusted EBITDA margin of 38.0%, an increase of 260 basis points.Rule of 40 score was 42.1%.GAAP net cash provided by operating activities was $141.7 million, an increase of $2.5 million, with GAAP operating cash flow margin of 48.4%, a decrease of 110 basis points.Non-GAAP free cash flow was $126.0 million, an increase of $2.8 million, with non-GAAP free cash flow margin of 43.1%, a decrease of 70 basis points.
“Blackbaud continues to be well-positioned for long-term success,” said Chad Anderson, executive vice president and CFO, Blackbaud. “Our strong results reflect our execution discipline, ongoing productivity improvements, and balance sheet optimization. We remain committed to providing investors an attractive financial model balanced across growth in revenues, earnings, and cash flows, along with a prudent and purposeful capital allocation strategy. Year-to-date we have repurchased more than 7% of our common stock outstanding since the end of 2025 while also reducing our leverage ratio from 2.7x in Q1 to 2.3x in Q3. We have a lot to be proud of and a lot more to look forward to in Q4 2026 and beyond.”
An explanation of all non-GAAP financial measures referenced in this press release, including the Rule of 40, is included below under the heading “Non-GAAP Financial Measures.” A reconciliation of the company’s non-GAAP financial measures to their most directly comparable GAAP measures has been provided in the financial statement tables included below in this press release.
Recent Company Highlights
At bbcon 2026:Blackbaud introduced Platform for Good™, its unified operating system for social impact, bringing the company’s products, data, AI, workflows and ecosystem together on a shared architecture to help organizations identify opportunities, expand capacity and move from information to action with greater confidence. Blackbaud also announced a broad portfolio of innovations across fundraising, marketing, financial management and education designed to strengthen the connected value of the platform.Blackbaud also unveiled Lantern™, the first domain-specific language model purpose-built to optimize fundraising intelligence. Developed through a strategic collaboration with Databricks, Lantern is built on Blackbaud’s four decades of experience in fundraising workflows, decisions, and results, so it understands the rhythms of fundraising and can illuminate opportunities that might otherwise go unseen. Starting in 2027, Lantern will be embedded within the Platform for Good and will begin powering select Blackbaud Raiser’s Edge NXT® and Agents for Good™ capabilities.In addition, Blackbaud shared updates on its expanding family of Agents for Good, including advancements to the Development Agent and the introduction of the Data Health Agent, a continuous data steward designed to detect and address data issues through review-and-approve workflows. Blackbaud also previewed agentic experiences for finance and education.BILL and Blackbaud announced a strategic partnership to simplify the accounts payable process for nonprofit and education finance teams, embedding BILL’s business payments network and payment-processing capabilities into Blackbaud Financial Edge NXT® Payment Assistant™. The connected experience is designed to support finance teams from invoice and approval through payment and reconciliation, reducing manual work within the financial management workflow.Blackbaud expanded the availability of Expedited Giving and Expedited Giving+ within its YourCause® from Blackbaud® solutions, accelerating how corporate and employee donations reach nonprofits. Expedited Giving delivers donations 90% faster than the industry average, while Expedited Giving+ is the industry’s fastest option, enabling direct-to-nonprofit donations in near real time leveraging Blackbaud Integrated Payments.Blackbaud announced new integrations with Microsoft 365 Copilot and Intuit Mailchimp, connecting Raiser’s Edge NXT to preferred technologies and giving users more ways to work, with best-in-class experiences.
Visit www.blackbaud.com/newsroom for more information about Blackbaud’s recent highlights.
Financial Outlook
Blackbaud today reaffirmed its 2026 full year financial guidance and expects to finish in the upper half of the range across all four key metrics:
GAAP revenue of $1.173 billion to $1.179 billionNon-GAAP adjusted EBITDA of $430 million to $438 millionNon-GAAP diluted earnings per share of $5.15 to $5.25Non-GAAP free cash flow of $280 million to $290 million
Included in its 2026 full year financial guidance are the following updated assumptions:
Non-GAAP annualized effective tax rate is expected to be approximately 24.5%Interest expense for the year is expected to be approximately $62 million to $66 millionDiluted weighted average shares outstanding for the year are expected to be approximately 45.0 million to 46.0 millionCapital expenditures for the year are expected to be approximately $60 million to $70 million, including approximately $52 million to $62 million of capitalized software development costs
Blackbaud has not reconciled forward-looking full-year non-GAAP financial measures contained in this news release to their most directly comparable GAAP measures, as permitted by Item 10(e)(1)(i)(B) of Regulation S-K. Such reconciliations would require unreasonable efforts at this time to estimate and quantify with a reasonable degree of certainty various necessary GAAP components, including for example those related to compensation, acquisition transactions and integration, tax items or others that may arise during the year. These components and other factors could materially impact the amount of the future directly comparable GAAP measures, which may differ significantly from their non-GAAP counterparts.
Stock Repurchase Program
As of September 30, 2026, Blackbaud had approximately $832 million remaining under its common stock repurchase program that was expanded, replenished and reauthorized in December 2025. Based on our current plans, and stock repurchases to date, we expect total repurchases during 2026 to represent between 7% and 10% of our outstanding common stock as of December 31, 2025.
Conference Call Details
What:
Blackbaud’s 2026 Third Quarter Conference Call
When:
October 28, 2026
Time:
8:00 a.m. (Eastern Time)
Live Call:
1-877-407-3088 (US/Canada)
Webcast:
About Blackbaud
Blackbaud (NASDAQ: BLKB) is the world’s leading provider of AI-powered solutions for social impact. Serving nonprofits, educational institutions, companies committed to corporate social responsibility and individual change makers, Blackbaud propels impact at scale with the sector’s most intelligent solutions for fundraising and engagement, education solutions, financial management and CSR and grantmaking. With the deepest expertise powered by the world’s largest philanthropic data set, the most connected workflows, and the most powerful impact network, Blackbaud’s solutions are building a future where resources are unleashed at the speed of need. Blackbaud has been recognized by Fast Company, Newsweek, Quartz, Forbes and more for AI innovation, responsible leadership and workplace excellence. Blackbaud has operations in the United States, Australia, Canada, Costa Rica, India and the United Kingdom, supporting users in 100+ countries. Learn more at www.blackbaud.com, or follow us on X/Twitter, LinkedIn, Instagram, and Facebook.
Investor Contact
IR@blackbaud.com
Media Contact
media@blackbaud.com
Forward-Looking Statements
Except for historical information, all of the statements, expectations, and assumptions contained in this news release are forward-looking statements which are subject to the safe harbor provisions of the Private Securities Litigation Reform Act of 1995, including, but not limited to, statements regarding the predictability of our financial condition and results of operations. These statements involve a number of risks and uncertainties. Although Blackbaud attempts to be accurate in making these forward-looking statements, it is possible that future circumstances might differ from the assumptions on which such statements are based. In addition, other important factors that could cause results to differ materially include the following: management of integration of acquired companies; uncertainty regarding increased business and renewals from existing customers; a shifting revenue mix that may impact gross margin; continued success in sales growth; risks related to the development, deployment, regulation, security, market adoption and perception of artificial intelligence technologies; cybersecurity and data protection risks and related liabilities; potential litigation involving us; and the other risk factors set forth from time to time in the SEC filings for Blackbaud, copies of which are available free of charge at the SEC’s website at www.sec.gov or upon request from Blackbaud’s investor relations department. Blackbaud assumes no obligation and does not intend to update these forward-looking statements, except as required by law.
Trademarks
All Blackbaud product names appearing herein are trademarks or registered trademarks of Blackbaud, Inc.
Non-GAAP Financial Measures
Blackbaud has provided in this release financial information that has not been prepared in accordance with GAAP. Blackbaud uses non-GAAP financial measures internally in analyzing its operational performance. Accordingly, Blackbaud believes these non-GAAP measures are useful to investors, as a supplement to GAAP measures, in evaluating its ongoing operational performance and trends and in comparing its financial results from period-to-period with other companies in Blackbaud’s industry, many of which present similar non-GAAP financial measures to investors. However, these non-GAAP financial measures may not be completely comparable to similarly titled measures of other companies due to potential differences in the exact method of calculation between companies.
The non-GAAP financial measures discussed above exclude the impact of certain transactions that Blackbaud believes are not directly related to its operating performance in any particular period, but are for its long-term benefit over multiple periods. Blackbaud believes these non-GAAP financial measures reflect its ongoing business in a manner that allows for meaningful period-to-period comparisons and analysis of trends in its business.
While Blackbaud believes these non-GAAP measures provide useful supplemental information, non-GAAP financial measures should not be considered in isolation from, or as a substitute for, financial information prepared in accordance with GAAP. Investors are encouraged to review the reconciliations of these non-GAAP measures to their most directly comparable GAAP financial measures.
Non-GAAP free cash flow is defined as operating cash flow less capital expenditures, including costs required to be capitalized for software development, and capital expenditures for property and equipment. Blackbaud believes non-GAAP free cash flow provides a useful measure of the company’s operating performance. Non-GAAP free cash flow is not intended to represent and should not be viewed as the amount of residual cash flow available for discretionary expenditures.
In addition, Blackbaud uses non-GAAP organic revenue growth, non-GAAP organic revenue growth on a constant currency basis, non-GAAP organic recurring revenue growth and non-GAAP organic recurring revenue growth on a constant currency basis, in analyzing its operating performance. Blackbaud believes that these non-GAAP measures are useful to investors, as a supplement to GAAP measures, for evaluating the periodic growth of its business on a consistent basis. Each of these measures excludes incremental acquisition-related revenue attributable to companies, if any, acquired in the current fiscal year. For companies acquired in the immediately preceding fiscal year, each of these measures reflects presentation of full-year incremental non-GAAP revenue derived from such companies as if they were combined throughout the prior period. In addition, each of these measures excludes prior period revenue associated with divested businesses, if any. The exclusion of the prior period revenue is to present the results of the divested businesses within the results of the combined company for the same period of time in both the prior and current periods. Blackbaud believes this presentation provides a more comparable representation of its current business’ organic revenue growth and revenue run-rate.
Rule of 40 is defined as non-GAAP organic revenue growth plus non-GAAP adjusted EBITDA margin. Non-GAAP adjusted EBITDA is defined as GAAP net income plus interest, net; income tax provision (benefit); depreciation; amortization of intangible assets from business combinations; amortization of software development costs; stock-based compensation expense; global workforce transition costs; acquisition and disposition-related costs; and Security Incident-related costs.
Blackbaud, Inc.
Consolidated Balance Sheets
(Unaudited)
(dollars in thousands, except per share amounts)
September 30,
2026
December 31,
2025
Assets
Current assets:
Cash and cash equivalents
$ 35,734
$ 38,914
Restricted cash
428,166
720,061
Accounts receivable, net of allowance of $6,529 and $5,876 at September 30, 2026 and
December 31, 2025, respectively
76,214
80,517
Customer funds receivable
3,918
1,308
Prepaid expenses and other current assets
86,064
89,290
Total current assets
630,096
930,090
Property and equipment, net
83,827
85,076
Software development costs, net
159,048
155,842
Goodwill
1,055,937
1,056,815
Intangible assets, net
87,413
106,654
Other assets
90,516
56,205
Total assets
$ 2,106,837
$ 2,390,682
Liabilities and stockholders’ equity
Current liabilities:
Trade accounts payable
$ 38,404
$ 27,344
Accrued expenses and other current liabilities
51,047
43,272
Due to customers
430,703
719,833
Debt, current portion
22,654
22,660
Deferred revenue, current portion
380,989
368,986
Total current liabilities
923,797
1,182,095
Debt, net of current portion
1,022,143
1,087,037
Deferred tax liability
25,100
21,981
Deferred revenue, net of current portion
3,674
2,778
Other liabilities
12,638
11,737
Total liabilities
1,987,352
2,305,628
Commitments and contingencies
Stockholders’ equity:
Preferred stock; 20,000,000 shares authorized, none outstanding
—
—
Common stock, $0.001 par value; 180,000,000 shares authorized, 74,080,118 and
72,312,354 shares issued at September 30, 2026 and December 31, 2025, respectively;
45,102,406 and 46,705,325 shares outstanding at September 30, 2026 and December 31,
2025, respectively
74
72
Additional paid-in capital
1,459,322
1,391,641
Treasury stock, at cost; 28,977,712 and 25,607,029 shares at September 30, 2026 and
December 31, 2025, respectively
(1,471,199)
(1,316,224)
Accumulated other comprehensive income (loss)
3,210
(5,948)
Retained earnings
128,078
15,513
Total stockholders’ equity
119,485
85,054
Total liabilities and stockholders’ equity
$ 2,106,837
$ 2,390,682
Blackbaud, Inc.
Consolidated Statements of Comprehensive Income
(Unaudited)
(dollars in thousands, except per share amounts)
Three months ended
September 30,
Nine months ended
September 30,
2026
2025
2026
2025
Revenue
$ 292,641
$ 281,143
$ 864,378
$ 833,109
Cost of revenue
114,850
113,653
341,865
342,101
Gross profit
177,791
167,490
522,513
491,008
Operating expenses
Sales, marketing and customer success
46,218
44,105
139,823
132,795
Research and development
36,206
37,198
107,978
104,352
General and administrative
34,828
31,044
99,538
120,579
Amortization of intangible assets
588
570
1,762
1,670
Total operating expenses
117,840
112,917
349,101
359,396
Income from operations
59,951
54,573
173,412
131,612
Interest expense
(16,109)
(16,774)
(49,724)
(52,130)
Other income, net
2,597
3,245
6,977
6,468
Income before provision (benefit) for income taxes
46,439
41,044
130,665
85,950
Income tax provision (benefit)
371
(6,448)
18,100
7,669
Net income
$ 46,068
$ 47,492
$ 112,565
$ 78,281
Earnings per share
Basic
$ 1.04
$ 1.00
$ 2.51
$ 1.63
Diluted
$ 1.02
$ 0.98
$ 2.49
$ 1.61
Common shares and equivalents outstanding
Basic weighted average shares
44,267,816
47,680,002
44,858,491
47,961,631
Diluted weighted average shares
44,961,588
48,498,285
45,245,216
48,634,027
Other comprehensive income (loss)
Foreign currency translation adjustment
$ (106)
$ (2,284)
$ (1,703)
$ 8,299
Unrealized gain (loss) on derivative instruments, net of tax
4,241
(622)
10,861
(12,628)
Total other comprehensive income (loss)
4,135
(2,906)
9,158
(4,329)
Comprehensive income
$ 50,203
$ 44,586
$ 121,723
$ 73,952
Blackbaud, Inc.
Consolidated Statements of Cash Flows
(Unaudited)
Nine months ended
September 30,
(dollars in thousands)
2026
2025
Cash flows from operating activities
Net income
$ 112,565
$ 78,281
Adjustments to reconcile net income to net cash provided by operating activities:
Depreciation and amortization
62,595
64,652
Net provision for credit losses and sales returns
5,064
3,788
Stock-based compensation expense
67,682
71,079
Deferred taxes
4,892
(16,682)
Amortization of deferred financing costs and discount
1,861
1,940
Other non-cash adjustments
1,313
(5,180)
Changes in operating assets and liabilities, net of acquisition and disposal of businesses:
Accounts receivable
(817)
(2,422)
Prepaid expenses and other assets
(8,832)
(9,707)
Trade accounts payable
11,750
(3,233)
Accrued expenses and other liabilities
13,242
2,033
Deferred revenue
12,929
22,991
Net cash provided by operating activities
284,244
207,540
Cash flows from investing activities
Purchase of property and equipment
(7,320)
(4,805)
Capitalized software development costs
(38,635)
(40,268)
Cash used in disposition of business
—
(12,235)
Other investing activities
(8,675)
—
Net cash used in investing activities
(54,630)
(57,308)
Cash flows from financing activities
Proceeds from issuance of debt
230,700
307,000
Payments on debt
(307,760)
(316,922)
Employee taxes paid for withheld shares upon equity award settlement
(25,696)
(39,669)
Change in due to customers
(288,369)
(323,467)
Change in customer funds receivable
(2,692)
(1,676)
Purchase of treasury stock, including excise tax payments
(129,933)
(133,338)
Net cash used in financing activities
(523,750)
(508,072)
Effect of exchange rate on cash, cash equivalents and restricted cash
(939)
5,768
Net decrease in cash, cash equivalents and restricted cash
(295,075)
(352,072)
Cash, cash equivalents and restricted cash, beginning of period
758,975
809,512
Cash, cash equivalents and restricted cash, end of period
$ 463,900
$ 457,440
The following table provides a reconciliation of cash and cash equivalents and restricted cash reported within the consolidated
balance sheets that sum to the total of the same such amounts shown above in the consolidated statements of cash flows:
(dollars in thousands)
September 30,
2026
December 31,
2025
Cash and cash equivalents
$ 35,734
$ 38,914
Restricted cash
428,166
720,061
Total cash, cash equivalents and restricted cash in the statement of cash flows
$ 463,900
$ 758,975
Blackbaud, Inc.
Reconciliation of GAAP to Non-GAAP Financial Measures
(Unaudited)
(dollars in thousands, except per share amounts)
Three months ended
September 30,
Nine months ended
September 30,
2026
2025
2026
2025
GAAP Revenue
$ 292,641
$ 281,143
$ 864,378
$ 833,109
GAAP gross profit
$ 177,791
$ 167,490
$ 522,513
$ 491,008
GAAP gross margin
60.8 %
59.6 %
60.4 %
58.9 %
Non-GAAP adjustments:
Add: Stock-based compensation expense
2,693
2,850
8,494
8,798
Add: Amortization of intangibles from business combinations
5,405
6,811
17,076
20,883
Add: Employee severance
—
(18)
—
284
Add: Global workforce transition costs(1)
1,014
—
1,556
—
Subtotal
9,112
9,643
27,126
29,965
Non-GAAP gross profit
$ 186,903
$ 177,133
$ 549,639
$ 520,973
Non-GAAP gross margin
63.9 %
63.0 %
63.6 %
62.5 %
GAAP income from operations
$ 59,951
$ 54,573
$ 173,412
$ 131,612
GAAP operating margin
20.5 %
19.4 %
20.1 %
15.8 %
Non-GAAP adjustments:
Add: Stock-based compensation expense
22,100
21,657
68,686
71,079
Add: Amortization of intangibles from business combinations
5,993
7,381
18,838
22,553
Add: Employee severance
—
(242)
—
1,905
Add: Global workforce transition costs(1)
5,439
—
8,439
—
Add: Acquisition and disposition-related costs(2)
237
383
1,250
25,779
Add: Security Incident-related costs
853
247
853
2,822
Add: Impairment of capitalized software development costs
—
—
1,056
—
Subtotal
34,622
29,426
99,122
124,138
Non-GAAP income from operations
$ 94,573
$ 83,999
$ 272,534
$ 255,750
Non-GAAP operating margin
32.3 %
29.9 %
31.5 %
30.7 %
GAAP income before provision (benefit) for income taxes
$ 46,439
$ 41,044
$ 130,665
$ 85,950
GAAP net income
$ 46,068
$ 47,492
$ 112,565
$ 78,281
Shares used in computing GAAP diluted earnings per share
44,961,588
48,498,285
45,245,216
48,634,027
GAAP diluted earnings per share
$ 1.02
$ 0.98
$ 2.49
$ 1.61
Non-GAAP adjustments:
Add: GAAP income tax provision (benefit)
371
(6,448)
18,100
7,669
Add: Total non-GAAP adjustments affecting income from operations
34,622
29,426
99,122
124,138
Non-GAAP income before provision for income taxes
81,061
70,470
229,787
210,088
Assumed non-GAAP income tax provision(3)
19,860
17,265
56,298
51,472
Non-GAAP net income
$ 61,201
$ 53,205
$ 173,489
$ 158,616
Shares used in computing non-GAAP diluted earnings per share
44,961,588
48,498,285
45,245,216
48,634,027
Non-GAAP diluted earnings per share
$ 1.36
$ 1.10
$ 3.83
$ 3.26
(1)
Global workforce transition costs represent severance and other costs incurred in connection with actions under our global workforce
strategy.
(2)
Includes charges of $24.3 million incurred during the nine months ended September 30, 2025 related to the release from our lease for office
space in Washington, DC.
(3)
We use a non-GAAP effective tax rate of 24.5% when calculating non-GAAP net income and non-GAAP diluted earnings per share. We
base this rate on our estimated annual GAAP income tax rate, adjusted for items excluded from GAAP income when calculating non-GAAP
income and for significant nonrecurring tax adjustments. We review this non-GAAP tax rate annually to determine whether it remains
appropriate for evaluating our financial performance. In conducting this review, we consider our GAAP annual effective tax rate, changes in
tax legislation, non-GAAP adjustments, and shifts in the geographic mix of revenues and expenses. We also evaluate other factors that we
deem significant. Because the tax treatment of non-GAAP adjustments differs from GAAP and because of our methodology for estimating
the annual tax rate, the non-GAAP tax rate may differ from the GAAP tax rate and from our actual tax liabilities.
Blackbaud, Inc.
Reconciliation of GAAP to Non-GAAP Financial Measures
(Unaudited)
(dollars in thousands)
Three months ended
September 30,
Nine months ended
September 30,
2026
2025
2026
2025
GAAP revenue
$ 292,641
$ 281,143
$ 864,378
$ 833,109
GAAP revenue growth
4.1 %
3.8 %
Less: Non-GAAP revenue from divested businesses(1)
—
—
—
—
Non-GAAP organic revenue(2)
$ 292,641
$ 281,143
$ 864,378
$ 833,109
Non-GAAP organic revenue growth
4.1 %
3.8 %
Non-GAAP organic revenue(2)
$ 292,641
$ 281,143
$ 864,378
$ 833,109
Foreign currency impact on non-GAAP organic revenue(3)
(237)
—
(3,167)
—
Non-GAAP organic revenue on constant currency basis(3)
$ 292,404
$ 281,143
$ 861,211
$ 833,109
Non-GAAP organic revenue growth on constant currency basis
4.0 %
3.4 %
GAAP recurring revenue
$ 287,030
$ 275,802
$ 848,806
$ 815,406
GAAP recurring revenue growth
4.1 %
4.1 %
Less: Non-GAAP recurring revenue from divested businesses(1)
—
—
—
—
Non-GAAP organic recurring revenue(2)
$ 287,030
$ 275,802
$ 848,806
$ 815,406
Non-GAAP organic recurring revenue growth
4.1 %
4.1 %
Non-GAAP organic recurring revenue(2)
$ 287,030
$ 275,802
$ 848,806
$ 815,406
Foreign currency impact on non-GAAP organic recurring revenue(3)
(227)
—
(3,095)
—
Non-GAAP organic recurring revenue on constant currency basis(3)
$ 286,803
$ 275,802
$ 845,711
$ 815,406
Non-GAAP organic recurring revenue growth on constant
currency basis
4.0 %
3.7 %
(1)
Non-GAAP revenue from divested businesses excludes revenue associated with divested businesses in the prior period. The exclusion of
the prior period revenue is to present the results of the divested business with the results of the combined company for the same period of
time in both the prior and current periods.
(2)
Non-GAAP organic revenue and non-GAAP organic recurring revenue for the prior year periods presented herein may not agree to non-
GAAP organic revenue and non-GAAP organic recurring revenue presented in the respective prior period quarterly financial information
solely due to the manner in which non-GAAP organic revenue growth and non-GAAP organic recurring revenue growth are calculated.
(3)
To determine non-GAAP organic revenue growth and non-GAAP organic recurring revenue growth on a constant currency basis, revenues
from entities reporting in foreign currencies were translated to U.S. Dollars using the comparable prior period’s quarterly weighted average
foreign currency exchange rates. The primary foreign currencies creating the impact are the Australian Dollar, British Pound, Canadian
Dollar and Euro.
Blackbaud, Inc.
Reconciliation of GAAP to Non-GAAP Financial Measures
(Unaudited)
(dollars in thousands)
Three months ended
September 30,
Nine months ended
September 30,
2026
2025
2026
2025
GAAP net income
$ 46,068
$ 47,492
$ 112,565
$ 78,281
Non-GAAP adjustments:
Add: Interest, net
13,865
14,403
43,874
46,136
Add: GAAP income tax provision (benefit)
371
(6,448)
18,100
7,669
Add: Depreciation
3,177
2,181
8,228
7,823
Add: Amortization of intangibles from business combinations
5,993
7,381
18,838
22,553
Add: Amortization of software development costs(1)
12,978
12,605
38,203
36,781
Subtotal
36,384
30,122
127,243
120,962
Non-GAAP EBITDA
$ 82,452
$ 77,614
$ 239,808
$ 199,243
Non-GAAP EBITDA margin(2)
28.2 %
27.7 %
Non-GAAP adjustments:
Add: Stock-based compensation expense
$ 22,100
$ 21,657
$ 68,686
$ 71,079
Add: Employee severance
—
(242)
—
1,905
Add: Global workforce transition costs(3)
5,439
—
8,439
—
Add: Acquisition and disposition-related costs(3)
237
383
1,250
25,779
Add: Security Incident-related costs
853
247
853
2,822
Add: Impairment of capitalized software development costs
—
—
1,056
—
Subtotal
28,629
22,045
80,284
101,585
Non-GAAP adjusted EBITDA
$ 111,081
$ 99,659
$ 320,092
$ 300,828
Non-GAAP adjusted EBITDA margin(4)
38.0 %
37.0 %
Rule of 40(5)
42.1 %
40.8 %
Non-GAAP adjusted EBITDA
$ 111,081
$ 99,659
$ 320,092
$ 300,828
Foreign currency impact on Non-GAAP adjusted EBITDA(6)
(76)
(512)
(1,267)
(1,403)
Non-GAAP adjusted EBITDA on constant currency basis(6)
$ 111,005
$ 99,147
$ 318,825
$ 299,425
Non-GAAP adjusted EBITDA margin on constant currency basis
38.0 %
37.0 %
Rule of 40 on constant currency basis(7)
42.0 %
40.4 %
(1)
Includes amortization expense related to software development costs, and amortization expense from capitalized cloud computing
implementation costs.
(2)
Measured by non-GAAP EBITDA divided by non-GAAP organic revenue.
(3)
See additional details in the reconciliation of GAAP to non-GAAP operating income above.
(4)
Measured by non-GAAP adjusted EBITDA divided by non-GAAP organic revenue.
(5)
Measured by non-GAAP organic revenue growth plus non-GAAP adjusted EBITDA margin. See Non-GAAP organic revenue growth table
above.
(6)
To determine non-GAAP adjusted EBITDA on a constant currency basis, non-GAAP adjusted EBITDA from entities reporting in foreign
currencies were translated to U.S. Dollars using the comparable prior period’s quarterly weighted average foreign currency exchange rates.
The primary foreign currencies creating the impact are the Australian Dollar, British Pound, Canadian Dollar and Euro.
(7)
Measured by non-GAAP organic revenue growth on constant currency basis plus non-GAAP adjusted EBITDA margin on constant currency
basis.
(dollars in thousands)
Nine months ended
September 30,
2026
2025
GAAP net cash provided by operating activities
$ 284,244
$ 207,540
GAAP operating cash flow margin
32.9 %
24.9 %
Non-GAAP adjustments:
Less: purchase of property and equipment
(7,320)
(4,805)
Less: capitalized software development costs
(38,635)
(40,268)
Non-GAAP free cash flow
$ 238,289
$ 162,467
Non-GAAP free cash flow margin
27.6 %
19.5 %
View original content to download multimedia:https://www.prnewswire.com/news-releases/blackbaud-announces-2026-third-quarter-financial-results-302921392.html
SOURCE Blackbaud


Scott Zack’s Creek Equity Details Healthcare Services Portfolio Spanning Supply Chain, Pharmacy Benefits, and Medical Courier Logistics

Ceva Unveils Next-Generation NeuPro NPU Portfolio and Announces Expansion into AI Infrastructure

Blackbaud Announces 2026 Third Quarter Financial Results

Send Rakhi to UK swiftly with UK Gifts Portal

Whiteboard Series with NEAR | Ep: 45 Joel Thorstensson from ceramic.network

Nullmax and Renesas Forge Strategic Partnership to Deliver Competitive ADAS Solutions for the Global Market

Why You Should Build on #NEAR – Co-founder Illia Polosukhin at CV Labs
Whiteboard Series with NEAR | Ep: 45 Joel Thorstensson from ceramic.network

NEAR End of Year Town Hall 2021: The Open Web World, MetaBUILD 2 Hackathon and 2021 recap
Trending
-

 Technology5 days ago
Miami Startup BOB Raises $5.5M To Build An AI-Powered Banking Platform
-

 Technology5 days ago
Kin Becomes First U.S. Home Insurer to Enable WebMCP for AI Shopping
-

 Coin Market5 days ago
Wells Fargo and five others object to OKX-ICE tokenized stock listings: Report
-

 Coin Market5 days ago
IRS plans lower tax disclosure penalties, including for crypto: Forbes
-

 Technology5 days ago
Enigmata Joins Finovifi Marketplace to Support AI Data Protection and Privacy-Preserving Analytics
-
 Technology5 days ago
Modern Wealth Law Founder John Wong Recognized for Over 10 Years as a State Bar of California Certified Specialist
-

 Technology5 days ago
City of Hope Cancer Center Chicago Unites Industry Leaders for Health Technology Innovation Roundtable
-

 Technology5 days ago
Meridian Credit Union Named Winner of Best Digital Transformation Program – Canada in 2026