
Technology
Quad Reports Third Quarter and Year-to-Date 2024 Results
Published
2 years agoon
By
Updates full-year 2024 financial guidance, including reducing anticipated year-end Net Debt Leverage from approximately 1.8x to 1.5x due to strong cash generation
Company to share strategy and growth opportunities at its upcoming Investor Day on November 20, 2024
SUSSEX, Wis., Oct. 28, 2024 /PRNewswire/ — Quad/Graphics, Inc. (NYSE: QUAD) (“Quad” or the “Company”), a global marketing experience company, today reported results for the third quarter ended September 30, 2024.
Recent Highlights
Recognized Net Sales of $675 million in the third quarter of 2024 compared to $700 million in 2023, and realized Net Loss of $25 million or $0.52 Diluted Loss Per Share for the third quarter of 2024.Achieved Non-GAAP Adjusted EBITDA of $59 million in the third quarter of 2024, increased from $57 million in the third quarter of 2023, and delivered $0.26 Adjusted Diluted Earnings Per Share for the third quarter of 2024.Increased Adjusted EBITDA Margin by 54 basis points to 8.7% in the third quarter of 2024 compared to the same period in 2023.Amended and extended $690 million bank debt agreement to October 2029.Built sales momentum for its in-store retail media network, In-Store Connect by Quad.Announced collaboration with Google Cloud to power next-generation, AI-driven marketing solutions.Received $41 million of net cash proceeds from the sale of its former Saratoga Springs, New York, manufacturing facility.Entered into a definitive agreement to sell the majority of its European operations for an enterprise value of €41 million (approximately $45 million) to Capmont; expects to close the transaction by year end.Declared quarterly dividend of $0.05 per share.Updates full-year 2024 financial guidance, including Net Sales trending to the higher end of decline in its original guidance range, while maintaining guidance midpoints for Adjusted EBITDA and Free Cash Flow and improving anticipated year-end 2024 Net Debt Leverage from approximately 1.8x to 1.5x.
Joel Quadracci, Chairman, President and CEO of Quad, said: “During the third quarter, we continued our focus on differentiating ourselves as a marketing experience, or MX, company, including investments in innovative solutions that align with our growth priorities. I am pleased to report that our in-store retail media network is expanding and producing measurable results for both retailers and consumer brands. Already, we have launched a test phase of In-Store Connect by Quad in 15 stores with The Save Mart Companies and are rolling out testing phases with two additional grocery chains by year end.
“In the third quarter, we also announced an exciting collaboration with Google Cloud to launch AI-powered solutions that will enable brands to create highly personalized content at scale across multiple marketing channels. By combining our data expertise with Google Cloud’s advanced AI capabilities, we not only will improve audience targeting, but will also reimagine how brands connect with consumers through streamlined, automated solutions that drive impactful results without compromising their unique brand voice.
“As always, we remain focused on delivering superior service to our clients while driving profitability, further enhancing Quad’s financial strength and creating shareholder value. Last week, we announced our agreement to sell the majority of our European operations, which represents just 5% of our total Net Sales, to Capmont for an enterprise value of €41 million or approximately $45 million. This proposed sale aligns with Quad’s ongoing strategic focus to optimize our business portfolio for growth as an MX company. We expect to use proceeds from the sale to reduce debt and make further investments in our solutions suite. We will continue to maintain state-of-the-art print operations in locations that support our MX offering, including The Americas, with North America comprising our largest base of operations.
“We look forward to sharing a more comprehensive update on our strategy and growth opportunities at our upcoming Investor Day on November 20, 2024, in New York City.”
Added Tony Staniak, Chief Financial Officer of Quad: “Our flexible operating model, higher labor productivity and disciplined approach to managing all aspects of our business enabled us to deliver higher Adjusted EBITDA Margin in the third quarter and on a year-to-date basis compared to the prior year, despite Net Sales pressure. We also continued to be a strong cash generator, including realizing $41 million of net proceeds from the sale of our former Saratoga Springs, New York, manufacturing facility, and we expect to receive approximately $32 million in cash and $13 million in debt reduction for a total enterprise value of approximately $45 million by year end from the sale of the majority of our European operations. Our full-year Net Sales is trending toward the higher end of decline in our original guidance range; however, we are maintaining the midpoints of our guidance ranges for Adjusted EBITDA and Free Cash Flow due to increased manufacturing productivity and cost reductions. With our strong cash generation, we expect to reduce Net Debt by over $700 million, or 68%, compared to January 1, 2020, to reach Net Debt Leverage of approximately 1.5x. Additionally, we are pleased to have recently extended our $690 million bank debt agreement to October 2029 due to the continued long-term partnership and support of our premier bank group. Given the strength of our balance sheet, we will continue to make strategic investments in our business, accelerate our offerings as a marketing experience company, and return capital to shareholders through our quarterly dividend. We also expect to be opportunistic in terms of our future share repurchases.”
Third Quarter 2024 Financial Results
Net Sales were $675 million in the third quarter of 2024, a decrease of 4% compared to the same period in 2023 primarily due to lower paper and agency solutions sales, including the loss of a large grocery client.Net Loss was $25 million in the third quarter of 2024 compared to a Net Loss of $3 million in the same period in 2023. The increase was primarily due to a $28 million increase in restructuring, impairment and transaction-related charges, net (including a $47 million increase in non-cash impairment charges primarily related to the European divestiture partially offset by a $21 million gain on the sale of the former Saratoga Springs, New York, facility) and the impact from lower Net Sales, partially offset by benefits from increased manufacturing productivity, savings from cost reduction initiatives, and lower depreciation and amortization.Adjusted EBITDA was $59 million in the third quarter of 2024 compared to $57 million in the same period in 2023, primarily due to increased manufacturing productivity and savings from cost reduction initiatives, partially offset by the impact from lower Net Sales.Adjusted Diluted Earnings Per Share was $0.26 in the third quarter of 2024 compared to $0.11 in the same period in 2023.
Year-to-Date 2024 Financial Results
Net Sales were $2 billion in the nine months ended September 30, 2024, a decrease of 9% compared to the same period in 2023 primarily due to lower paper sales and lower print volumes, including the impact from client mix and increased gravure volume that has a lower unit price with a higher profit margin, as well as lower agency solutions sales, including the loss of a large grocery client.Net Loss was $56 million in the nine months ended September 30, 2024, compared to Net Loss of $33 million in the same period in 2023. The increase was primarily due to a $35 million increase in restructuring, impairment and transactions-related charges, net (including a $50 million increase in non-cash impairment charges primarily related to the European divestiture partially offset by a $21 million gain on the sale of the former Saratoga Springs, New York, facility) and the impact from lower Net Sales, partially offset by benefits from increased manufacturing productivity, savings from cost reduction initiatives, and lower depreciation and amortization.Adjusted EBITDA was $161 million in the nine months ended September 30, 2024, a decrease of $7 million compared to the same period in 2023. The decrease was due to lower Net Sales, partially offset by benefits from increased manufacturing productivity and savings from cost reduction initiatives.Adjusted Diluted Earnings Per Share was $0.49 in the nine months ended September 30, 2024, compared to $0.28 in the same period in 2023, primarily due to higher Adjusted Net Earnings and the beneficial impact from the Company repurchasing Class A shares totaling approximately 11% of its outstanding shares since the second quarter of 2022.Net Cash Used in Operating Activities was $46 million in the nine months ended September 30, 2024, compared to Net Cash Provided by Operating Activities of $41 million in the nine months ended September 30, 2023. Free Cash Flow was negative $92 million in the nine months ended September 30, 2024, compared to negative $18 million in the same period in 2023, as the Company realized working capital benefits in 2023 from decreasing inventory due to an improved supply chain environment compared to 2022. As a reminder, the Company historically generates most of its Free Cash Flow in the fourth quarter of the year, and we expect fourth quarter 2024 Free Cash Flow to be $142 million to $162 million.Net Debt was $490 million at September 30, 2024, compared to $470 million at December 31, 2023 and $584 million at September 30, 2023. Compared to December 31, 2023, Net Debt increased primarily due to the negative $92 million of Free Cash Flow in the nine months ended September 30, 2024, less $69 million of proceeds from asset sales. Quad now expects to reduce Net Debt to approximately $330 million, or 1.5x Net Debt Leverage, at the end of this year pending the sale of the majority of its European operations. With the amended and extended bank debt agreement, the Company will make regular quarterly amortization payments, a $9 million payment in November 2026 and a $193 million payment at maturity in October 2029.
Dividend
Quad’s next quarterly dividend of $0.05 per share will be payable on December 6, 2024, to shareholders of record as of November 18, 2024.
2024 Guidance
The Company updates its full-year 2024 financial guidance as follows:
Financial Metric
Original 2024 Guidance Range
Updated 2024 Guidance Range
Annual Net Sales Change
5% to 9% decline
Approximately 9% decline
Full-Year Adjusted EBITDA
$205 million to $245 million
$215 million to $235 million
Free Cash Flow
$50 million to $70 million
$50 million to $70 million
Capital Expenditures
$60 million to $70 million
Approximately $65 million
Year-End Debt Leverage Ratio (1)
Approximately 1.8x
Approximately 1.5x
(1) Debt Leverage Ratio is calculated at the midpoint of the Adjusted EBITDA guidance.
Conference Call and Webcast Information
Quad will hold a conference call at 8:30 a.m. ET on Tuesday, October 29, 2024, hosted by Joel Quadracci, Quad Chairman, President and CEO, and Tony Staniak, Quad CFO. The full earnings release and slide presentation will be concurrently available on the Investors section of Quad’s website at http://www.quad.com/investor-relations. As part of the conference call, Quad will conduct a question and answer session.
Participants can pre-register for the webcast by navigating to https://dpregister.com/sreg/10193063/fd9659683c. Participants will be given a unique PIN to access the call on October 29. Participants may pre-register at any time, including up to and after the call start time.
Alternatively, participants may dial in on the day of the call as follows:
U.S. Toll-Free: 1-877-328-5508International Toll: 1-412-317-5424
An audio replay of the call will be posted on the Investors section of Quad’s website shortly after the conference call ends. In addition, telephone playback will also be available until November 29, 2024, accessible as follows:
U.S. Toll-Free: 1-877-344-7529International Toll: 1-412-317-0088Replay Access Code: 9141656
About Quad
Quad (NYSE: QUAD) is a global marketing experience company that helps brands make direct consumer connections, from household to in-store to online. Supported by state-of-the-art technology and data-driven intelligence, Quad uses its suite of media, creative and production solutions to streamline the complexities of marketing and remove friction from wherever it occurs in the marketing journey. Quad tailors its uniquely flexible, scalable and connected solutions to clients’ objectives, driving cost efficiencies, improving speed to market, strengthening marketing effectiveness, and delivering value on client investments.
Quad employs approximately 13,000 people in 14 countries and serves approximately 2,700 clients including industry leading blue-chip companies that serve both businesses and consumers in multiple industry verticals, with a particular focus on commerce, including retail, consumer packaged goods, and direct-to-consumer; financial services; and health. Quad is ranked among the largest agency companies in the U.S. by Ad Age, buoyed by its full-service Rise media agency and Betty creative agency. Quad is also one the largest commercial printers in North America, according to Printing Impressions.
For more information about Quad, including its commitment to ongoing innovation, culture and sustainable impact, visit quad.com.
Forward-Looking Statements
This press release contains certain “forward-looking statements” within the meaning of the Private Securities Litigation Reform Act of 1995. Forward-looking statements include statements regarding, among other things, our current expectations about the Company’s future results, financial condition, sales, earnings, free cash flow, margins, objectives, goals, strategies, beliefs, intentions, plans, estimates, prospects, projections and outlook of the Company and can generally be identified by the use of words or phrases such as “may,” “will,” “expect,” “intend,” “estimate,” “anticipate,” “plan,” “foresee,” “project,” “believe,” “continue” or the negatives of these terms, variations on them and other similar expressions. These forward-looking statements involve known and unknown risks, uncertainties and other factors which may cause actual results to be materially different from those expressed in or implied by such forward-looking statements. Forward-looking statements are based largely on the Company’s expectations and judgments and are subject to a number of risks and uncertainties, many of which are unforeseeable and beyond our control.
The factors that could cause actual results to materially differ include, among others: the impact of decreasing demand for printing services and significant overcapacity in a highly competitive environment creates downward pricing pressures and potential under-utilization of assets; the impact of increased business complexity as a result of the Company’s transformation to a marketing experience company, including adapting marketing offerings and business processes as required by new markets and technologies, such as artificial intelligence; the impact of changes in postal rates, service levels or regulations, including delivery delays; the impact of fluctuations in costs (including labor and labor-related costs, energy costs, freight rates and raw materials, including paper and the materials to manufacture ink) and the impact of fluctuations in the availability of raw materials, including paper, parts for equipment and the materials to manufacture ink; the impact macroeconomic conditions, including inflation, high interest rates and recessionary concerns, as well as cost and labor pressures, distribution challenges and the price and availability of paper, have had, and may continue to have, on the Company’s business, financial condition, cash flows and results of operations (including future uncertain impacts); the inability of the Company to reduce costs and improve operating efficiency rapidly enough to meet market conditions; the impact of a data-breach of sensitive information, ransomware attack or other cyber incident on the Company; the fragility and decline in overall distribution channels; the failure to attract and retain qualified talent across the enterprise; the impact of digital media and similar technological changes, including digital substitution by consumers; the failure of clients to perform under contracts or to renew contracts with clients on favorable terms or at all; the impact of risks associated with the operations outside of the United States (“U.S.”), including trade restrictions, currency fluctuations, the global economy, costs incurred or reputational damage suffered due to improper conduct of its employees, contractors or agents, and geopolitical events like war and terrorism; the failure to successfully identify, manage, complete and integrate acquisitions, investment opportunities or other significant transactions, as well as the successful identification and execution of strategic divestitures; the impact negative publicity could have on our business and brand reputation; significant capital expenditures and investments may be needed to sustain and grow the Company’s platforms, processes, systems, client and product technology, marketing and talent, and to remain technologically and economically competitive; the impact of the various restrictive covenants in the Company’s debt facilities on the Company’s ability to operate its business, as well as the uncertain negative impacts macroeconomic conditions may have on the Company’s ability to continue to be in compliance with these restrictive covenants; the impact of an other than temporary decline in operating results and enterprise value that could lead to non-cash impairment charges due to the impairment of property, plant and equipment and other intangible assets; the impact of regulatory matters and legislative developments or changes in laws, including changes in cybersecurity, privacy and environmental laws; the impact on the holders of Quad’s class A common stock of a limited active market for such shares and the inability to independently elect directors or control decisions due to the voting power of the class B common stock; and the other risk factors identified in the Company’s most recent Annual Report on Form 10-K, which may be amended or supplemented by subsequent Quarterly Reports on Form 10-Q or other reports filed with the Securities and Exchange Commission.
Except to the extent required by the federal securities laws, the Company undertakes no obligation to publicly update or revise any forward-looking statements, whether as a result of new information, future events or otherwise.
Non-GAAP Financial Measures
This press release contains financial measures not prepared in accordance with generally accepted accounting principles (referred to as non-GAAP), specifically Adjusted EBITDA, Adjusted EBITDA Margin, Free Cash Flow, Net Debt, Debt Leverage Ratio and Adjusted Diluted Earnings Per Share. Adjusted EBITDA is defined as net earnings (loss) excluding interest expense, income tax expense (benefit), depreciation and amortization and restructuring, impairment and transaction-related charges, net. Adjusted EBITDA Margin is defined as Adjusted EBITDA divided by net sales. Free Cash Flow is defined as net cash provided by (used in) operating activities less purchases of property, plant and equipment. Debt Leverage Ratio is defined as total debt and finance lease obligations less cash and cash equivalents (Net Debt) divided by the last twelve months of Adjusted EBITDA. Adjusted Diluted Earnings Per Share is defined as earnings (loss) before income taxes excluding restructuring, impairment and transaction-related charges, net, and adjusted for income tax expense at a normalized tax rate, divided by diluted weighted average number of common shares outstanding.
The Company believes that these non-GAAP measures, when presented in conjunction with comparable GAAP measures, provide additional information for evaluating Quad’s performance and are important measures by which Quad’s management assesses the profitability and liquidity of its business. These non-GAAP measures should be considered in addition to, not as a substitute for or superior to, net earnings (loss) as a measure of operating performance or to cash flows provided by (used in) operating activities as a measure of liquidity. These non-GAAP measures may be different than non-GAAP financial measures used by other companies. Reconciliation to the GAAP equivalent of these non-GAAP measures are contained in tabular form on the attached unaudited financial statements.
Investor Relations Contact
Don Pontes
Executive Director of Investor Relations
916-532-7074
dwpontes@quad.com
Media Contact
Claire Ho
Director of Marketing Communications
414-566-2955
cho@quad.com
QUAD/GRAPHICS, INC.
CONDENSED CONSOLIDATED STATEMENTS OF OPERATIONS
For the Three Months Ended September 30, 2024 and 2023
(in millions, except per share data)
(UNAUDITED)
Three Months Ended September 30,
2024
2023
Net sales
$ 674.8
$ 700.2
Cost of sales
527.6
560.8
Selling, general and administrative expenses
88.4
82.5
Depreciation and amortization
24.4
32.0
Restructuring, impairment and transaction-related charges, net
39.3
11.2
Total operating expenses
679.7
686.5
Operating income (loss)
(4.9)
13.7
Interest expense
17.0
17.7
Net pension income
(0.2)
(0.5)
Loss before income taxes
(21.7)
(3.5)
Income tax expense (benefit)
3.0
(0.8)
Net loss
$ (24.7)
$ (2.7)
Loss per share
Basic and diluted
$ (0.52)
$ (0.06)
Weighted average number of common shares outstanding
Basic and diluted
47.8
48.0
QUAD/GRAPHICS, INC.
CONDENSED CONSOLIDATED STATEMENTS OF OPERATIONS
For the Nine Months Ended September 30, 2024 and 2023
(in millions, except per share data)
(UNAUDITED)
Nine Months Ended September 30,
2024
2023
Net sales
$ 1,963.8
$ 2,169.8
Cost of sales
1,542.8
1,748.1
Selling, general and administrative expenses
260.2
255.0
Depreciation and amortization
79.4
97.7
Restructuring, impairment and transaction-related charges, net
81.9
46.8
Total operating expenses
1,964.3
2,147.6
Operating income (loss)
(0.5)
22.2
Interest expense
49.4
51.0
Net pension income
(0.6)
(1.3)
Loss before income taxes
(49.3)
(27.5)
Income tax expense
6.3
5.9
Net loss
$ (55.6)
$ (33.4)
Loss per share
Basic and diluted
$ (1.17)
$ (0.68)
Weighted average number of common shares outstanding
Basic and diluted
47.6
48.8
QUAD/GRAPHICS, INC.
CONDENSED CONSOLIDATED BALANCE SHEETS
As of September 30, 2024 and December 31, 2023
(in millions)
(UNAUDITED)
September 30,
2024
December 31,
2023
ASSETS
Cash and cash equivalents
$ 12.5
$ 52.9
Receivables, less allowances for credit losses
305.6
316.2
Inventories
201.7
178.8
Prepaid expenses and other current assets
72.1
39.8
Total current assets
591.9
587.7
Property, plant and equipment—net
512.7
620.6
Operating lease right-of-use assets—net
82.7
96.6
Goodwill
100.3
103.0
Other intangible assets—net
10.6
21.8
Other long-term assets
90.6
80.0
Total assets
$ 1,388.8
$ 1,509.7
LIABILITIES AND SHAREHOLDERS’ EQUITY
Accounts payable
$ 336.6
$ 373.6
Other current liabilities
259.9
237.6
Short-term debt and current portion of long-term debt
77.2
151.7
Current portion of finance lease obligations
0.8
2.5
Current portion of operating lease obligations
23.6
25.4
Total current liabilities
698.1
790.8
Long-term debt
423.4
362.5
Finance lease obligations
1.4
6.0
Operating lease obligations
66.1
77.2
Deferred income taxes
4.0
5.1
Other long-term liabilities
144.9
148.6
Total liabilities
1,337.9
1,390.2
Shareholders’ equity
Preferred stock
—
—
Common stock
1.4
1.4
Additional paid-in capital
841.3
842.7
Treasury stock, at cost
(27.9)
(33.1)
Accumulated deficit
(637.2)
(573.9)
Accumulated other comprehensive loss
(126.7)
(117.6)
Total shareholders’ equity
50.9
119.5
Total liabilities and shareholders’ equity
$ 1,388.8
$ 1,509.7
QUAD/GRAPHICS, INC.
CONDENSED CONSOLIDATED STATEMENTS OF CASH FLOWS
For the Nine Months Ended September 30, 2024 and 2023
(in millions)
(UNAUDITED)
Nine Months Ended September 30,
2024
2023
OPERATING ACTIVITIES
Net loss
$ (55.6)
$ (33.4)
Adjustments to reconcile net loss to net cash provided by (used in) operating activities:
Depreciation and amortization
79.4
97.7
Impairment charges
65.9
15.8
Amortization of debt issuance costs and original issue discount
1.2
1.5
Stock-based compensation
5.9
4.6
Gain on the sale of an investment
(4.1)
—
Gains on the sale or disposal of property, plant and equipment, net
(22.2)
(0.5)
Deferred income taxes
0.1
—
Changes in operating assets and liabilities
(116.5)
(44.6)
Net cash provided by (used in) operating activities
(45.9)
41.1
INVESTING ACTIVITIES
Purchases of property, plant and equipment
(45.7)
(59.5)
Cost investment in unconsolidated entities
(0.2)
(0.7)
Proceeds from the sale of property, plant and equipment
46.5
7.9
Proceeds from the sale of an investment
22.2
—
Loan to an unconsolidated entity
—
(0.6)
Other investing activities
(0.9)
(4.5)
Net cash provided by (used in) investing activities
21.9
(57.4)
FINANCING ACTIVITIES
Proceeds from issuance of long-term debt
52.8
0.6
Payments of current and long-term debt
(137.0)
(37.5)
Payments of finance lease obligations
(2.1)
(1.8)
Borrowings on revolving credit facilities
1,113.3
1,136.1
Payments on revolving credit facilities
(1,034.0)
(1,082.8)
Purchases of treasury stock
—
(10.2)
Equity awards redeemed to pay employees’ tax obligations
(2.1)
(1.7)
Payment of cash dividends
(7.0)
(0.1)
Other financing activities
(0.2)
(0.5)
Net cash provided by (used in) financing activities
(16.3)
2.1
Effect of exchange rates on cash and cash equivalents
(0.1)
—
Net decrease in cash and cash equivalents
(40.4)
(14.2)
Cash and cash equivalents at beginning of period
52.9
25.2
Cash and cash equivalents at end of period
$ 12.5
$ 11.0
QUAD/GRAPHICS, INC.
SEGMENT FINANCIAL INFORMATION
For the Three and Nine Months Ended September 30, 2024 and 2023
(in millions)
(UNAUDITED)
Net Sales
Operating
Income (Loss)
Restructuring,
Impairment and
Transaction-Related
Charges, Net (1)
Three months ended September 30, 2024
United States Print and Related Services
$ 579.1
$ 51.2
$ (12.7)
International
95.7
(46.5)
51.9
Total operating segments
674.8
4.7
39.2
Corporate
—
(9.6)
0.1
Total
$ 674.8
$ (4.9)
$ 39.3
Three months ended September 30, 2023
United States Print and Related Services
$ 608.0
$ 18.9
$ 10.7
International
92.2
4.2
0.6
Total operating segments
700.2
23.1
11.3
Corporate
—
(9.4)
(0.1)
Total
$ 700.2
$ 13.7
$ 11.2
Nine months ended September 30, 2024
United States Print and Related Services
$ 1,702.3
$ 75.3
$ 28.2
International
261.5
(40.8)
53.5
Total operating segments
1,963.8
34.5
81.7
Corporate
—
(35.0)
0.2
Total
$ 1,963.8
$ (0.5)
$ 81.9
Nine months ended September 30, 2023
United States Print and Related Services
$ 1,854.1
$ 38.0
$ 41.8
International
315.7
20.2
4.2
Total operating segments
2,169.8
58.2
46.0
Corporate
—
(36.0)
0.8
Total
$ 2,169.8
$ 22.2
$ 46.8
______________________________
(1)
Restructuring, impairment and transaction-related charges, net are included within operating income (loss).
QUAD/GRAPHICS, INC.
RECONCILIATION OF GAAP TO NON-GAAP MEASURES
EBITDA, EBITDA MARGIN, ADJUSTED EBITDA AND ADJUSTED EBITDA MARGIN
For the Three Months Ended September 30, 2024 and 2023
(in millions, except margin data)
(UNAUDITED)
Three Months Ended September 30,
2024
2023
Net loss
$ (24.7)
$ (2.7)
Interest expense
17.0
17.7
Income tax expense (benefit)
3.0
(0.8)
Depreciation and amortization
24.4
32.0
EBITDA (non-GAAP)
$ 19.7
$ 46.2
EBITDA Margin (non-GAAP)
2.9 %
6.6 %
Restructuring, impairment and transaction-related charges, net (1)
39.3
11.2
Adjusted EBITDA (non-GAAP)
$ 59.0
$ 57.4
Adjusted EBITDA Margin (non-GAAP)
8.7 %
8.2 %
______________________________
(1)
Operating results for the three months ended September 30, 2024 and 2023, were affected by the following restructuring, impairment and transaction-related charges, net:
Three Months Ended September 30,
2024
2023
Employee termination charges (a)
$ 2.2
$ 1.6
Impairment charges (b)
52.2
5.2
Transaction-related charges (c)
0.9
0.5
Integration costs (d)
0.1
—
Other restructuring charges (income) (e)
(16.1)
3.9
Restructuring, impairment and transaction-related charges, net
$ 39.3
$ 11.2
______________________________
(a)
Employee termination charges were related to workforce reductions through facility consolidations and separation programs.
(b)
Impairment charges were for certain property, plant and equipment no longer being utilized in production as a result of facility consolidations and other capacity reduction and strategic divestiture activities, including $50.9 million related to the sale of the majority of the European operations to reduce the carrying value to fair value during the three months ended September 30, 2024, as well as charges for operating lease right-of-use assets.
(c)
Transaction-related charges consisted of professional service fees related to business acquisition and divestiture activities.
(d)
Integration costs were primarily costs related to the integration of acquired companies.
(e)
Other restructuring charges (income) primarily include costs to maintain and exit closed facilities, as well as lease exit charges, and are presented net of a $20.5 million gain on the sale of the Saratoga Springs, New York facility during the three months ended September 30, 2024.
In addition to financial measures prepared in accordance with accounting principles generally accepted in the United States of America (GAAP), this earnings announcement also contains non-GAAP financial measures, specifically EBITDA, EBITDA Margin, Adjusted EBITDA, Adjusted EBITDA Margin, Free Cash Flow, Net Debt, Debt Leverage Ratio and Adjusted Diluted Earnings Per Share. The Company believes that these non-GAAP measures, when presented in conjunction with comparable GAAP measures, provide additional information for evaluating Quad’s performance and are important measures by which Quad’s management assesses the profitability and liquidity of its business. These non-GAAP measures should be considered in addition to, not as a substitute for or superior to, net earnings (loss) as a measure of operating performance or to cash flows provided by (used in) operating activities as a measure of liquidity. These non-GAAP measures may be different than non-GAAP financial measures used by other companies.
QUAD/GRAPHICS, INC.
RECONCILIATION OF GAAP TO NON-GAAP MEASURES
EBITDA, EBITDA MARGIN, ADJUSTED EBITDA AND ADJUSTED EBITDA MARGIN
For the Nine Months Ended September 30, 2024 and 2023
(in millions, except margin data)
(UNAUDITED)
Nine Months Ended September 30,
2024
2023
Net loss
$ (55.6)
$ (33.4)
Interest expense
49.4
51.0
Income tax expense
6.3
5.9
Depreciation and amortization
79.4
97.7
EBITDA (non-GAAP)
$ 79.5
$ 121.2
EBITDA Margin (non-GAAP)
4.0 %
5.6 %
Restructuring, impairment and transaction-related charges, net (1)
81.9
46.8
Adjusted EBITDA (non-GAAP)
$ 161.4
$ 168.0
Adjusted EBITDA Margin (non-GAAP)
8.2 %
7.7 %
______________________________
(1)
Operating results for the nine months ended September 30, 2024 and 2023, were affected by the following restructuring, impairment and transaction-related charges, net:
Nine Months Ended September 30,
2024
2023
Employee termination charges (a)
$ 19.1
$ 16.6
Impairment charges (b)
65.9
15.8
Transaction-related charges (c)
1.8
1.1
Integration costs (d)
0.3
1.0
Other restructuring charges (income) (e)
(5.2)
12.3
Restructuring, impairment and transaction-related charges, net
$ 81.9
$ 46.8
______________________________
(a)
Employee termination charges were related to workforce reductions through facility consolidations and separation programs.
(b)
Impairment charges were for certain property, plant and equipment no longer being utilized in production as a result of facility consolidations and other capacity reduction and strategic divestiture activities, including $50.9 million related to the sale of the majority of the European operations to reduce the carrying value to fair value during the nine months ended September 30, 2024, as well as charges for operating lease right-of-use assets.
(c)
Transaction-related charges consisted of professional service fees related to business acquisition and divestiture activities.
(d)
Integration costs were primarily costs related to the integration of acquired companies.
(e)
Other restructuring charges (income) primarily include costs to maintain and exit closed facilities, as well as lease exit charges, and are presented net of a $20.5 million gain on the sale of the Saratoga Springs, New York facility during the nine months ended September 30, 2024.
In addition to financial measures prepared in accordance with accounting principles generally accepted in the United States of America (GAAP), this earnings announcement also contains non-GAAP financial measures, specifically EBITDA, EBITDA Margin, Adjusted EBITDA, Adjusted EBITDA Margin, Free Cash Flow, Net Debt, Debt Leverage Ratio and Adjusted Diluted Earnings Per Share. The Company believes that these non-GAAP measures, when presented in conjunction with comparable GAAP measures, provide additional information for evaluating Quad’s performance and are important measures by which Quad’s management assesses the profitability and liquidity of its business. These non-GAAP measures should be considered in addition to, not as a substitute for or superior to, net earnings (loss) as a measure of operating performance or to cash flows provided by (used in) operating activities as a measure of liquidity. These non-GAAP measures may be different than non-GAAP financial measures used by other companies.
QUAD/GRAPHICS, INC.
RECONCILIATION OF GAAP TO NON-GAAP MEASURES
FREE CASH FLOW
For the Nine Months Ended September 30, 2024 and 2023
(in millions)
(UNAUDITED)
Nine Months Ended September 30,
2024
2023
Net cash provided by (used in) operating activities
$ (45.9)
$ 41.1
Less: purchases of property, plant and equipment
45.7
59.5
Free Cash Flow (non-GAAP)
$ (91.6)
$ (18.4)
In addition to financial measures prepared in accordance with accounting principles generally accepted in the United States of America (GAAP), this earnings announcement also contains non-GAAP financial measures, specifically EBITDA, EBITDA Margin, Adjusted EBITDA, Adjusted EBITDA Margin, Free Cash Flow, Net Debt, Debt Leverage Ratio and Adjusted Diluted Earnings Per Share. The Company believes that these non-GAAP measures, when presented in conjunction with comparable GAAP measures, provide additional information for evaluating Quad’s performance and are important measures by which Quad’s management assesses the profitability and liquidity of its business. These non-GAAP measures should be considered in addition to, not as a substitute for or superior to, net earnings (loss) as a measure of operating performance or to cash flows provided by (used in) operating activities as a measure of liquidity. These non-GAAP measures may be different than non-GAAP financial measures used by other companies.
QUAD/GRAPHICS, INC.
RECONCILIATION OF GAAP TO NON-GAAP MEASURES
NET DEBT AND DEBT LEVERAGE RATIO
As of September 30, 2024 and December 31, 2023
(in millions, except ratio)
(UNAUDITED)
September 30,
2024
December 31,
2023
Total debt and finance lease obligations on the condensed consolidated balance sheets
$ 502.8
$ 522.7
Less: Cash and cash equivalents
12.5
52.9
Net Debt (non-GAAP)
$ 490.3
$ 469.8
Divided by: trailing twelve months Adjusted EBITDA (non-GAAP) (1)
$ 227.1
$ 233.7
Debt Leverage Ratio (non-GAAP)
2.16 x
2.01 x
______________________________
(1)
The calculation of Adjusted EBITDA for the trailing twelve months ended September 30, 2024, and December 31, 2023, was as follows:
Add
Subtract
Trailing Twelve
Months Ended
Year Ended
Nine Months Ended
December 31,
2023(a)
(UNAUDITED)
September 30,
2024
(UNAUDITED)
September 30,
2023
(UNAUDITED)
September 30,
2024
Net loss
$ (55.4)
$ (55.6)
$ (33.4)
$ (77.6)
Interest expense
70.0
49.4
51.0
68.4
Income tax expense
12.8
6.3
5.9
13.2
Depreciation and amortization
128.8
79.4
97.7
110.5
EBITDA (non-GAAP)
$ 156.2
$ 79.5
$ 121.2
$ 114.5
Restructuring, impairment and transaction-related
charges, net
77.5
81.9
46.8
112.6
Adjusted EBITDA (non-GAAP)
$ 233.7
$ 161.4
$ 168.0
$ 227.1
______________________________
(a)
Financial information for the year ended December 31, 2023, is included as reported in the Company’s 2023 Annual Report on Form 10-K filed with the SEC on February 22, 2024.
In addition to financial measures prepared in accordance with accounting principles generally accepted in the United States of America (GAAP), this earnings announcement also contains non-GAAP financial measures, specifically EBITDA, EBITDA Margin, Adjusted EBITDA, Adjusted EBITDA Margin, Free Cash Flow, Net Debt, Debt Leverage Ratio and Adjusted Diluted Earnings Per Share. The Company believes that these non-GAAP measures, when presented in conjunction with comparable GAAP measures, provide additional information for evaluating Quad’s performance and are important measures by which Quad’s management assesses the profitability and liquidity of its business. These non-GAAP measures should be considered in addition to, not as a substitute for or superior to, net earnings (loss) as a measure of operating performance or to cash flows provided by (used in) operating activities as a measure of liquidity. These non-GAAP measures may be different than non-GAAP financial measures used by other companies.
QUAD/GRAPHICS, INC.
RECONCILIATION OF GAAP TO NON-GAAP MEASURES
ADJUSTED DILUTED EARNINGS PER SHARE
For the Three Months Ended September 30, 2024 and 2023
(in millions, except per share data)
(UNAUDITED)
Three Months Ended September 30,
2024
2023
Loss before income taxes
$ (21.7)
$ (3.5)
Restructuring, impairment and transaction-related charges, net
39.3
11.2
Adjusted net earnings, before income taxes (non-GAAP)
17.6
7.7
Income tax expense at 25% normalized tax rate
4.4
1.9
Adjusted net earnings (non-GAAP)
$ 13.2
$ 5.8
Basic weighted average number of common shares outstanding
47.8
48.0
Plus: effect of dilutive equity incentive instruments (non-GAAP)
2.7
2.7
Diluted weighted average number of common shares outstanding (non-GAAP)
50.5
50.7
Adjusted diluted earnings per share (non-GAAP) (1)
$ 0.26
$ 0.11
Diluted loss per share (GAAP)
$ (0.52)
$ (0.06)
Restructuring, impairment and transaction-related charges, net per share
0.78
0.22
Income tax expense (benefit) from condensed consolidated statement of operations per share
0.06
(0.02)
Income tax expense at 25% normalized tax rate per share
(0.09)
(0.04)
Effect of dilutive equity incentive instruments
0.03
0.01
Adjusted diluted earnings per share (non-GAAP) (1)
$ 0.26
$ 0.11
______________________________
(1)
Adjusted diluted earnings per share excludes the following: (i) restructuring, impairment and transaction-related charges, net and (ii) discrete income tax items.
In addition to financial measures prepared in accordance with accounting principles generally accepted in the United States of America (GAAP), this earnings announcement also contains non-GAAP financial measures, specifically EBITDA, EBITDA Margin, Adjusted EBITDA, Adjusted EBITDA Margin, Free Cash Flow, Net Debt, Debt Leverage Ratio and Adjusted Diluted Earnings Per Share. The Company believes that these non-GAAP measures, when presented in conjunction with comparable GAAP measures, provide additional information for evaluating Quad’s performance and are important measures by which Quad’s management assesses the profitability and liquidity of its business. These non-GAAP measures should be considered in addition to, not as a substitute for or superior to, net earnings (loss) as a measure of operating performance or to cash flows provided by (used in) operating activities as a measure of liquidity. These non-GAAP measures may be different than non-GAAP financial measures used by other companies.
QUAD/GRAPHICS, INC.
RECONCILIATION OF GAAP TO NON-GAAP MEASURES
ADJUSTED DILUTED EARNINGS PER SHARE
For the Nine Months Ended September 30, 2024 and 2023
(in millions, except per share data)
(UNAUDITED)
Nine Months Ended September 30,
2024
2023
Loss before income taxes
$ (49.3)
$ (27.5)
Restructuring, impairment and transaction-related charges, net
81.9
46.8
Adjusted net earnings, before income taxes (non-GAAP)
32.6
19.3
Income tax expense at 25% normalized tax rate
8.2
4.8
Adjusted net earnings (non-GAAP)
$ 24.4
$ 14.5
Basic weighted average number of common shares outstanding
47.6
48.8
Plus: effect of dilutive equity incentive instruments (non-GAAP)
2.5
2.1
Diluted weighted average number of common shares outstanding (non-GAAP)
50.1
50.9
Adjusted diluted earnings per share (non-GAAP) (1)
$ 0.49
$ 0.28
Diluted loss per share (GAAP)
$ (1.17)
$ (0.68)
Restructuring, impairment and transaction-related charges, net per share
1.63
0.92
Income tax expense from condensed consolidated statement of operations per share
0.13
0.12
Income tax expense at 25% normalized tax rate per share
(0.16)
(0.09)
Effect of dilutive equity incentive instruments
0.06
0.01
Adjusted diluted earnings per share (non-GAAP) (1)
$ 0.49
$ 0.28
______________________________
(1)
Adjusted diluted earnings per share excludes the following: (i) restructuring, impairment and transaction-related charges, net and (ii) discrete income tax items.
In addition to financial measures prepared in accordance with accounting principles generally accepted in the United States of America (GAAP), this earnings announcement also contains non-GAAP financial measures, specifically EBITDA, EBITDA Margin, Adjusted EBITDA, Adjusted EBITDA Margin, Free Cash Flow, Net Debt, Debt Leverage Ratio and Adjusted Diluted Earnings Per Share. The Company believes that these non-GAAP measures, when presented in conjunction with comparable GAAP measures, provide additional information for evaluating Quad’s performance and are important measures by which Quad’s management assesses the profitability and liquidity of its business. These non-GAAP measures should be considered in addition to, not as a substitute for or superior to, net earnings (loss) as a measure of operating performance or to cash flows provided by (used in) operating activities as a measure of liquidity. These non-GAAP measures may be different than non-GAAP financial measures used by other companies.
View original content to download multimedia:https://www.prnewswire.com/news-releases/quad-reports-third-quarter-and-year-to-date-2024-results-302289205.html
SOURCE Quad

You may like
Technology
HelloNation Article Highlights Sterile Compounding and Medication Safety With Insights From Compounding Pharmacist Expert Laura Temple
Published
56 minutes agoon
July 21, 2026By
The article explains how sterile compounded medications are prepared to reduce the risk of contamination and support safe, customized treatments.
AZLE, Texas, July 21, 2026 /PRNewswire/ — What does sterile compounding mean for medication safety? HelloNation has published an article explaining how sterile compounding helps pharmacies prepare highly specialized medications while adhering to strict contamination-prevention procedures.
The article features insights from Laura Temple, Compounding Pharmacist Expert and Owner of Laura’s Pharmacy in Azle, Texas. It explains that sterile compounding is a specialized process for preparing medications in carefully controlled environments designed to reduce the risk of contamination. Sterile compounded medications are often used for injections, eye drops, IV medications, and other therapies that require the highest levels of cleanliness and precision.
The HelloNation article explains that sterile compounded medications differ from commercially manufactured drugs because they are prepared individually for a patient’s unique medical needs. Physicians may prescribe compounded prescriptions when a patient requires a customized dosage, a combination medication, or a treatment not commercially available. Because these medications often bypass the body’s natural defenses, medication safety depends on strict preparation standards throughout the compounding process.
The article describes how pharmacies that provide sterile compounding rely on cleanroom environments equipped with filtered-air systems, specialized equipment, and contamination-prevention protocols. Pharmacists and technicians follow detailed gowning, sterilization, and handwashing procedures before handling medication ingredients. These measures are designed to support medication safety by limiting exposure to bacteria, particles, and other contaminants.
According to the article, environmental monitoring also plays a critical role in sterile compounding. Temperature control, air quality testing, and routine equipment inspections help maintain consistent preparation standards. The article notes that sterile compounded medications may undergo additional quality assurance checks before being dispensed to patients. These procedures help support both treatment effectiveness and patient safety.
The HelloNation article also explains that pharmacies performing sterile compounding are expected to follow USP guidelines established for sterile preparation. These USP guidelines outline requirements for cleanroom pharmacy operations, environmental testing, employee training, and quality assurance practices. The article emphasizes that maintaining compliance with USP guidelines helps reinforce contamination prevention and consistent preparation standards for compounded prescriptions.
Patients seeking sterile compounded medications may also look for pharmacies that participate in accreditation programs or are overseen by state boards. The article explains that these programs review safety procedures, documentation practices, and facility standards to help maintain medication safety. Regular environmental monitoring and staff competency evaluations are also identified as important safeguards in sterile compounding operations.
The article further explains that communication between pharmacists, healthcare providers, and patients remains an important part of safe compounded prescriptions. Compounding pharmacists review prescriptions carefully, confirm dosing instructions, and evaluate ingredient compatibility before preparation begins. This collaborative approach supports medication safety by reducing the risk of errors and ensuring treatments meet individual patient needs.
The article concludes that sterile compounding continues to play an important role in healthcare, particularly for patients requiring customized therapies that are unavailable through traditional manufacturing channels. Whether preparing IV medications, injectable therapies, or other sterile compounded medications, pharmacies rely on contamination prevention procedures and strict preparation standards to support patient care. The article notes that understanding how sterile compounding works can help patients feel more informed about the safety measures involved in preparing specialized medications.
What Sterile Compounding Means for Medication Safety features insights from Laura Temple, a compounding pharmacist expert at Laura’s Pharmacy in Azle, Texas, on HelloNation.
About HelloNation
HelloNation is America’s Good News Network, a premier media platform built on the idea that good news travels faster when real people tell real stories. Through its community-focused publications and innovative “edvertising” approach, HelloNation delivers content that informs, inspires, and spotlights the leaders making a meaningful impact in their communities.
View original content to download multimedia:https://www.prnewswire.com/news-releases/hellonation-article-highlights-sterile-compounding-and-medication-safety-with-insights-from-compounding-pharmacist-expert-laura-temple-302831275.html
SOURCE HelloNation
Technology
CIOs Forced to Rethink Manual Compliance Processes as Regulatory Complexity Rises, Says Info-Tech Research Group
Published
56 minutes agoon
July 21, 2026By
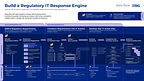
Regulatory demands are increasing in volume, complexity, and speed, leaving many organizations reliant on fragmented, manual approaches that slow response times and increase risk. New insights from Info-Tech Research Group show that organizations need to adopt more structured and scalable approaches to keep pace with regulatory change. The firm’s recently published blueprint, Build a Regulatory IT Response Engine, provides frameworks, tools, and step-by-step guidance to help organizations translate regulatory requirements into actionable IT controls and prioritized initiatives.
ARLINGTON, Va., July 21, 2026 /PRNewswire/ — Growing regulatory pressure across jurisdictions is forcing organizations to rethink how they interpret, prioritize, and execute compliance requirements. Many IT teams continue to operate with inconsistent processes and limited coordination, resulting in delayed initiatives and increased exposure to financial and reputational risk. Info-Tech’s blueprint, Build a Regulatory IT Response Engine, introduces a coordinated and repeatable approach to help IT leaders operationalize compliance and improve execution outcomes.
Info-Tech’s findings indicate that while organizations recognize the need for faster and more consistent regulatory response, they continue to face barriers such as fragmented interpretation of requirements, weak prioritization, and limited scalability. AI-enabled tools can help streamline analysis and accelerate response planning, but without a coordinated approach grounded in governance and human oversight, those benefits are difficult to realize.
“Regulatory response is becoming too complex to manage through disconnected, manual processes,” says Ahmad Jowhar, senior research analyst at Info-Tech Research Group. “IT leaders need a repeatable way to interpret requirements, prioritize action, and use AI to accelerate planning without losing the governance and oversight needed to execute effectively.”
Key Challenges IT Leaders Face in Regulatory Response
Despite ongoing investments in compliance, organizations continue to face systemic challenges that hinder effective execution. Info-Tech’s blueprint highlights several areas where IT and compliance leaders struggle most:
Fragmented and manual processes that slow regulatory interpretation and response.Inconsistent application of regulatory requirements across teams and jurisdictions.Poor prioritization of IT initiatives, leading to missed deadlines and duplicated effort.Limited scalability to manage increasing regulatory volume and complexity.Misalignment between compliance activities and broader business priorities.
Info-Tech’s Framework for Building a Regulatory IT Response Engine
To address these challenges, Info-Tech recommends a structured, AI-enabled approach that improves consistency, speed, and scalability. The firm’s Build a Regulatory IT Response Engine blueprint outlines the following key priorities for IT leaders:
Define the regulatory landscape: Establish organizational context, governance structures, and a centralized inventory of applicable regulations.Translate requirements into IT controls: Use AI-enabled analysis and structured assessments to convert regulatory obligations into actionable controls.Prioritize IT initiatives: Align initiatives based on cost, effort, impact, and regulatory timelines to reduce execution risk.Build and communicate a roadmap: Develop a clear, resource-aligned roadmap to guide execution and stakeholder alignment.Establish a repeatable process: Continuously monitor, adapt, and refine regulatory response capabilities to maintain compliance over time.
Organizations that adopt this structured approach can move from reactive compliance efforts to a more proactive and scalable model that shortens response timelines, reduces manual effort, and strengthens execution.
The firm’s Build a Regulatory IT Response Engine blueprint includes practical tools such as a Regulation Inventory Tool, a Regulatory Response IT Action Plan Tool, a Communication Deck Template, and a Compliance Program Framework. By applying these resources, IT leaders can standardize regulatory responses, improve prioritization, and help ensure compliance initiatives are executed on time and in alignment with business priorities.
For exclusive and timely commentary from Info-Tech’s experts, including Ahmad Jowhar, and access to the complete Build a Regulatory IT Response Engine blueprint, please contact pr@infotech.com.
About Info-Tech Research Group
Info-Tech Research Group is the “get things done” partner for over 30,000 IT, HR, and marketing leaders worldwide. The fastest growing research and advisory firm, Info-Tech enables leaders to make well-informed decisions and transform their organizations through AI, strategic foresight, step-by-step methodologies, practical tools, industry-leading advisory, and training programs. For nearly 30 years, tens of thousands of private and public organizations have trusted Info-Tech to lead their most important initiatives through periods of change and deliver outcomes that truly matter.
To learn more about Info-Tech’s HR research and advisory services, visit McLean & Company, and for data-driven software buying insights and vendor evaluations, visit the firm’s SoftwareReviews platform.
Media professionals can register for unrestricted access to research across IT, HR, and software and hundreds of industry analysts through the firm’s Media Insiders program. To gain access, contact pr@infotech.com.
For information about Info-Tech Research Group or to access the latest research, visit infotech.com and connect via LinkedIn and X.
View original content to download multimedia:https://www.prnewswire.com/news-releases/cios-forced-to-rethink-manual-compliance-processes-as-regulatory-complexity-rises-says-info-tech-research-group-302831286.html
SOURCE Info-Tech Research Group
Technology
Atomera to Announce Second Quarter 2026 Financial Results and Host Webinar on Tuesday, August 4, 2026
Published
56 minutes agoon
July 21, 2026By
LOS GATOS, Calif., July 21, 2026 /PRNewswire/ — Atomera Incorporated (NASDAQ: ATOM), a semiconductor materials and technology licensing company, announced today that it plans to release its second quarter 2026 financial results after the market closes on Tuesday, Aug. 4, 2026.
The company will host a live video Zoom webinar at 2:00 p.m. Pacific Time (5:00 p.m. Eastern Time) on Tuesday, Aug. 4, 2026, to discuss the results. The live webinar can be accessed through Atomera’s investor relations website at https://ir.atomera.com. A replay of the webcast will be available for 12 months. To pre-register for the webinar, use the following link.
https://atomera.zoom.us/webinar/register/WN_OJFbTWe1SIyV69LLdDadCw
About Atomera
Atomera Incorporated is a semiconductor materials and technology licensing company focused on deploying its proprietary, silicon-proven technology into the semiconductor industry. Atomera has developed Mears Silicon Technology™ (MST®), which increases performance and power efficiency in semiconductor transistors. MST can be implemented using equipment already deployed in semiconductor manufacturing facilities and is complementary to other nano-scaling technologies already in the semiconductor industry roadmap. More information can be found at www.atomera.com
View original content to download multimedia:https://www.prnewswire.com/news-releases/atomera-to-announce-second-quarter-2026-financial-results-and-host-webinar-on-tuesday-august-4-2026-302830602.html
SOURCE Atomera Incorporated

HelloNation Article Highlights Sterile Compounding and Medication Safety With Insights From Compounding Pharmacist Expert Laura Temple

CIOs Forced to Rethink Manual Compliance Processes as Regulatory Complexity Rises, Says Info-Tech Research Group
Atomera to Announce Second Quarter 2026 Financial Results and Host Webinar on Tuesday, August 4, 2026
Send Rakhi to UK swiftly with UK Gifts Portal

Whiteboard Series with NEAR | Ep: 45 Joel Thorstensson from ceramic.network

New Gooseneck Omni Antennas Offer Enhanced Signals in a Durable Package

Why You Should Build on #NEAR – Co-founder Illia Polosukhin at CV Labs
Whiteboard Series with NEAR | Ep: 45 Joel Thorstensson from ceramic.network

NEAR End of Year Town Hall 2021: The Open Web World, MetaBUILD 2 Hackathon and 2021 recap
Trending
-

 Coin Market5 days ago
Bitcoin outlook improves amid 6% weekly gain: Can BTC bulls push higher?
-
 Technology5 days ago
Timed with the Canton Fair, Connexion ShenZhen 2026 Unveils Major Fourth-Edition Upgrades as a Greater Bay Area Mega Sourcing Event
-

 Coin Market4 days ago
The British Virgin Islands are a top crypto hub no one ever talks about: Here’s why
-
 Technology4 days ago
Global Times: China sends fresh signal on global AI cooperation at WAIC
-

 Coin Market5 days ago
Trump teleprompter operator made $100K betting on Kalshi markets tied to speeches: ABC
-
 Technology5 days ago
Grand Bargain Project Announces Procedural Change that Will Turn Congress into a Problem-Solving Institution Within Days
-

 Technology5 days ago
Drake Expands End-to-End Professional Services with Launch of Drake Audit Defense™
-

 Technology5 days ago
Texas Instruments board declares third quarter 2026 quarterly dividend