
Technology
Galaxy Announces Third Quarter 2024 Financial Results

Published
2 years agoon
By
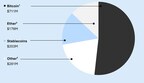
Subsequent to quarter-end, Galaxy executed a non-binding term sheet with a U.S.-based hyperscaler to host high-performance computing at its Helios campus in West Texas.
NEW YORK, Nov. 7, 2024 /CNW/ – Galaxy Digital Holdings Ltd. (TSX: GLXY) (the “Company” or “GDH Ltd.”) today released financial results for the three months and nine months ended September 30, 2024, for both itself and Galaxy Digital Holdings LP (the “Partnership” or “GDH LP”). In this press release, a reference to “Galaxy”, “we”, “our” and similar words refer to GDH Ltd., its subsidiaries and affiliates including GDH LP, or any one of them, as the context requires.
Corporate and Business Updates
Financial Highlights: In the third quarter, Galaxy reported a net loss of $54 million, representing a significant narrowing of our net loss from the second quarter. We generated operating revenue growth of over 30% quarter-over-quarter (“QoQ”), despite industry spot trading volumes declining 15% and ether declining 24% in the quarter. For the nine months ended September 30, 2024, Galaxy reported net income of $191 million, driven by strong operating performance and positive digital asset markets. Galaxy’s equity capital was $2.1 billion as of September 30, 2024.
Helios: Subsequent to quarter-end, Galaxy executed a non-binding term sheet with a U.S.-based hyperscaler to host high-performance computing at its Helios campus in West Texas. The term sheet includes options to allocate all of Helios’ 800 megawatts of currently approved power capacity to HPC hosting and support. The consummation of the transaction is subject to execution of definitive documents, customary due diligence and approvals of the parties.
US Listing and Reorganization: Galaxy continues to work on completing its proposed reorganization and domestication to become a Delaware-incorporated company and subsequently list on the Nasdaq, upon completion of ongoing SEC review and subject to stock exchange, shareholder and applicable regulatory approvals of such transactions. On July 26, 2024, Galaxy filed an amendment to its registration statement responding to SEC comments, which is under review.
Select GDH LP Financial Metrics
Q3 2024
Q2 2024
Q/Q % Change
Q3 YTD
Equity Capital
$2,081M
$2,129M
(2) %
—
Liquidity
$1,506M
$1,312M
15 %
—
Cash & Net Stablecoins1
$475M
$409M
16 %
—
Net Digital Assets Excluding Stablecoins2
$562M
$485M
16 %
—
Spot Bitcoin and Ethereum ETFs
$469M
$418M
12 %
—
Net Income (loss)
($54M)
($177M)
N.M.3
$191M
Book Value Per Share in CAD4
$8.24 CAD
$8.45 CAD
(2) %
—
Note: Throughout this document, totals may not sum due to rounding. Quarter-over-quarter and year-over-year percentage change calculations are based on unrounded results.
(1)
Includes Cash Equivalents.
(2)
Refer to page 16 of this release for a breakout of our net digital assets position; Excludes non-current net digital assets.
(3)
Abbreviation for “Not Meaningful”.
(4)
Calculated as equity capital divided by outstanding Class A and Class B Units multiplied by the end of period foreign exchange rate.
Galaxy Global Markets
Galaxy Global Markets (“GGM”) offers institutional-grade expertise and access to a broad range of digital asset products, including digital asset spot and derivatives trading, financing, M&A advisory, and equity and debt capital markets services. GGM operates in two discrete business units – Trading and Investment Banking.
Trading reported counterparty trading revenue of $54 million in the third quarter, a 117% increase quarter-over-quarter (“QoQ”), despite a 20% decrease in trading volumes, primarily driven by increased revenue from derivatives and lending activity. Galaxy’s average loan book size expanded to $863 million, a 23% increase QoQ driven by increased demand from both new and existing counterparties, who relied on our lending desk to provide them with margin-based financing. Galaxy continues to onboard new counterparties, including large traditional asset managers and hedge funds, and ended the third quarter with 1,280 total trading counterparties.
Investment Banking successfully closed one deal subsequent to quarter-end, serving as the exclusive financial advisor to an existing client on a small buyside acquisition. Galaxy is executing against a pipeline of mandates representing $2.4 billion in potential deal value.
Key Performance Indicators
Q3 2024
Q2 2024
Q/Q % Change
Q3 YTD
Counterparty Trading Revenue
$54M
$25M
117 %
$146M
Loan Book Size (Average)
$863M
$699M
23 %
$742M
Total Trading Counterparties
1,280
1,212
6 %
—
Active Trading Counterparties
296
294
1 %
—
Investment Banking Deals Closed
0
2
(100) %
3
Pipeline
21
19
11 %
—
Deal Value of Pipeline
$2.4B
$2.1B
14 %
—
____
KEY TERMS
Counterparty Trading Revenue: revenue from counterparty-facing activities from our Derivatives, Credit, Over-the-Counter Trading, and Quantitative Trading businesses, net of associated funding charges.
Loan Book Size (Average): average market value of all open loans, unfunded arrangements to finance delayed trading/settlement (for example over weekends), and uncommitted credit facilities in the period. As of September 30, 2024, unfunded, uncommitted facilities accounted for approximately $156M of total Loan Book Size (Average).
Active Trading Counterparties: counterparties with whom we have traded within the past 12 months and who are still onboarded with Galaxy’s trading business.
Pipeline: the number of open engagements and transactions the Investment Banking team has in market.
Deal Value of Pipeline: the theoretical aggregate deal value associated with the Investment Banking pipeline.
Galaxy Asset Management
Galaxy Asset Management (“GAM”) provides investors access to the digital asset ecosystem via a diverse suite of institutional-grade investment vehicles that span passive, active, and venture strategies.
GAM management and performance fees were $8.1 million in the third quarter, representing a 44% decrease QoQ, primarily driven by the nearing completion of an opportunistic mandate to unwind portfolios on behalf of the FTX estate. GAM reported assets under management (“AUM”) of approximately $4.6 billion, a 2% increase QoQ, driven primarily by net inflows into GAM’s passive and active ETF strategies, which were offset by net market depreciation. In the quarter, GAM, in partnership with State Street Global Advisors, announced the launch of three actively managed digital asset and disruptive technology focused ETFs that offer investors exposure to digital asset and disruptive technology equities, spot cryptocurrencies, derivatives, cash, and cash-like instruments (tickers: DECO, HECO, TEKX).
Key Performance Indicators
Q3 2024
Q2 2024
Q/Q % Change
Q3 YTD
Management and Performance Fees
$8.1M
$14.5M
(44) %
$40.5M
Total AUM1
$4,608M
$4,503M
2 %
—
Passive AUM
$2,466M
$2,392M
3 %
—
Active AUM2
$647M
$629M
3 %
—
Venture AUM
$1,495M
$1,482M
1 %
—
(1) In Galaxy’s monthly AUM disclosures, the “funds” line item consists of AUM held in GAM’s Passive, Active, and Venture funds, excluding opportunistic assets. Total AUM for Q2 2024 was updated from what was previously reported as AUM for quarterly close vehicles are reported as of the most recent information available for the applicable period.
(2) Includes opportunistic AUM. “Opportunistic” AUM are near-term or mid-term engagements to unwind portfolios managed by GAM. Opportunistic AUM was $429M as of September 30, 2024 and $520M as of June 30, 2024.
____
KEY TERMS
Assets Under Management: all figures are unaudited. AUM is inclusive of sub-advised funds, committed capital closed-end vehicles, seed investments by affiliates, affiliated and unaffiliated separately managed accounts, engagements to unwind portfolios, and fund of fund products. Changes in AUM are generally the result of performance, contributions, withdrawals, liquidations and opportunistic mandate wins.
AUM for committed capital closed-end vehicles that have completed their investment period is reported as NAV (Net Asset Value) plus unfunded commitment.AUM for quarterly close vehicles is reported as of the most recent quarter available for the applicable period.AUM for affiliated separately managed accounts is reported as NAV as of the most recently available estimate for the applicable period.
Passive Strategies: single- and multi-asset private funds, as well as a suite of regulated spot digital asset exchange-traded funds offered through partnerships with asset managers globally.
Active Strategies: Galaxy’s Liquid Crypto Fund, the management of certain opportunistic mandates, and a suite of actively managed and regulated digital asset and disruptive technology exchange-traded funds offered through a partnership with State Street Global Advisors.
Venture Strategies: organized around two investment themes: Interactive Ventures and Crypto Ventures. Galaxy Interactive invests at the intersection of content, technology, and social commerce, managing client capital across three funds. GAM’s Crypto Ventures sleeve includes Galaxy’s inaugural crypto venture fund, which is focused on investing in early-stage companies across crypto protocols, software infrastructure, and financialized applications, as well as two global, multi-manager venture funds and a subset of Galaxy’s balance sheet venture investments.
Galaxy Digital Infrastructure Solutions
Galaxy Digital Infrastructure Solutions (“GDIS”) consists of proprietary and hosted bitcoin mining services, GK8 self-custody technology solutions, and blockchain infrastructure.
Subsequent to quarter-end, Galaxy executed a non-binding term sheet with a U.S.-based hyperscaler to host high-performance computing at its Helios campus in West Texas. The term sheet includes options to allocate all of Helios’ 800 megawatts of currently approved power capacity to HPC hosting and support. The consummation of the transaction is subject to execution of definitive documents, customary due diligence and approvals of the parties.
Mining
Mining revenue was $18.5 million for the third quarter, relative to expenses, net of curtailment credits, of $10.0 million, resulting in a 46% direct mining profit margin. Mining revenue and cost to mine were impacted by the Bitcoin halving, elevated mining difficulty and seasonal curtailment. Galaxy initiated fiber construction at Helios and, beyond the current approved capacity of 800MW, expects approval on a portion of the 1.7 gigawatts currently under study in the first half of 2025.
Key Performance Indicators
Q3 2024
Q2 2024
Q/Q % Change
Q3 YTD
Mining Revenue
$18.5M
$24.1M
(23) %
$72.8M
Proprietary Mining Revenue
$11.4M
$16.3M
(30) %
$47.9M
Hosted Revenue
$7.0M
$7.8M
(10) %
$24.9M
Total Hashrate Under Management
6.2 EH/s
5.6 EH/s
11 %
—
Proprietary Mining Hashrate
3.5 EH/s
2.9 EH/s
21 %
—
Hosted Mining Hashrate
2.7 EH/s
2.6 EH/s
4 %
—
Number of Proprietary BTC Mined
176
242
(27) %
790
Average Marginal Cost to Mine
<$38.0K
<$22.5K
N.M.
<$23.0K
Blockchain Infrastructure and GK8
Blockchain Infrastructure and GK8 continue to build and invest in the technology that powers the digital assets ecosystem. Blockchain Infrastructure expanded its Assets Under Stake by 58% QoQ to $3.4 billion as of September 30th, with Galaxy maintaining its position as one of the largest validators globally on the Solana network. Blockchain rewards, net of staking costs, were $10.7 million in the third quarter, up 26% QoQ. GK8 added one new client in the quarter.
Key Performance Indicators
Q3 2024
Q2 2024
Q/Q % Change
Q3 YTD
Assets Under Stake
$3,394M
$2,144M
58 %
$3,394M
GK8 Total Client Count
23
22
5 %
—
____
KEY TERMS
Hashrate Under Management: the total combined hashrate of active proprietary and hosted mining capacity managed by Galaxy.
Proprietary Mining Hashrate: the hashrate attributed to Galaxy owned and operated mining machines.
Hosted Mining Hashrate: the hashrate attributed to third-party machines operated by Galaxy for a client.
Number of Proprietary BTC Mined: the total amount of bitcoin mined from proprietary mining operations.
Average Marginal Cost to Mine: the average marginal cost of production for each bitcoin generated during the period. The calculation excludes depreciation, mark-to-market on power contracts, and corporate overhead.
Assets Under Stake: all figures are unaudited. AUS reflects the total notional value of assets bonded to Galaxy validators, based on prices as of the end of the specified period. This includes certain Galaxy balance sheet assets, Galaxy affiliate assets, and third-party assets.
GK8 Total Client Count: the total number of clients contracted to use GK8’s technology solutions.
Summary of Operating Expenses
Operating expenses
Q3 2024
Q2 2024
Q/Q % Change
Q3 YTD
Compensation and compensation related
$40M
$43M
(7) %
$125M
Equity based compensation
$13M
$12M
8 %
$42M
General and administrative
$48M
$45M
7 %
$143M
Mining costs
$10M
$10M
— %
$36M
Trading, commission and custody expenses
$6M
$6M
— %
$19M
Technology
$8M
$7M
14 %
$21M
Depreciation and amortization
$16M
$14M
14 %
$40M
Other
$8M
$9M
(11) %
$27M
Professional fees
$11M
$14M
(21) %
$38M
Staking costs
$39M
$30M
30 %
$70M
Interest
$29M
$21M
38 %
$70M
Notes interest expense
$7M
$7M
— %
$21M
Note: Quarter-over-quarter percentage change calculations are based on unrounded results.
Overview of Third Quarter Operating Expenses:
Compensation and compensation related expenses of $40 million decreased by approximately $3 million QoQ, primarily driven by adjustments to cash bonus accrual.Equity based compensation of $13 million was roughly flat QoQ.General and administrative expenses increased by approximately $3 million from the second quarter of 2024, driven primarily by $2 million of higher depreciation and amortization costs, reflecting the additional depreciation from new mining machines and electrical infrastructure that were energized during the prior quarter.Professional fees of $11 million decreased by approximately $3 million QoQ, primarily driven by $2 million of lower legal expense.Staking costs increased by approximately $9 million QoQ, reflecting the continued expansion of Galaxy’s validation services including the acquisition of the assets of CryptoManufaktur in July 2024. Despite the increase in staking costs, Galaxy’s blockchain rewards, net of staking costs, increased by 26% QoQ.Interest expense increased approximately $8 million QoQ, reflecting our ability to source non-dilutive wholesale financing to help fund our counterparty trading business, where our revenue increased by approximately $29 million QoQ.
Net Digital Assets Position Summary
Net digital assets includes all digital assets categorized as assets, less all digital assets categorized as liabilities on the statement of financial position and is included in the Company’s liquidity measure. Net digital assets as of September 30, 2024 is as follows:
(1) Includes associated tokens such as wBTC. In addition to digital assets, net, the Partnership also held interests in investment vehicles designed to hold BTC, including bitcoin futures ETFs, Galaxy sponsored BTC funds, Mt. Gox Investment Fund LP, and Xapo Holdings Limited, net of associated investment liabilities.
(2) Includes associated tokens such as wETH and stETH. In addition to digital assets, net, the Partnership also held interests in investment vehicles designed to hold ETH, including spot ETFs and Galaxy sponsored ETH funds.
(3) Includes $8.2 million net SOL and $45.9 million net TIA digital assets, net. In addition to digital assets, net, the Partnership also held interests in investment vehicles designed to hold digital assets, including the Galaxy sponsored Galaxy Digital Crypto Vol Fund LLC (includes $93.0 million SOL and $23.1 million of AVAX) and Ripple Lab Inc.
GDH Ltd.’s Financial Highlights
As the only significant asset of GDH Ltd. is its minority interest in GDH LP, its results are driven by the results of GDH LP. GDH Ltd. accounts for its investment in this associate (GDH LP) using the equity method. The investment, initially recorded at cost, is increased or decreased to recognize GDH Ltd.’s share of the earnings and losses of GDH LP. The net comprehensive income (loss) of GDH Ltd. was $(16.4) million for the three months ended September 30, 2024 and $44.1 million for the nine months ended September 30, 2024.
Earnings Conference Call
An investor conference call will be held today, November 7, 2024, at 8:30 AM Eastern Time. A live webcast with the ability to ask questions will be available at: https://investor.galaxy.com/. The conference call can also be accessed by investors in the United States or Canada by dialing 1-800-715-9871, or 1-646-307-1963 (outside the U.S. and Canada) using the Conference ID: 9649375. A replay of the webcast will be available and can be accessed in the same manner as the live webcast on the Company’s Investor Relations website.
About Galaxy Digital Holdings Ltd. (TSX: GLXY) (“GDH Ltd.”) and Galaxy Digital Holdings LP (“GDH LP”)
Galaxy (TSX: GLXY) is a digital asset and blockchain leader providing access to the growing digital economy. We serve a diversified client base, including institutions, startups, and qualified individuals. Since 2018, Galaxy has been building a holistic financial platform spanning three complementary operating businesses: Global Markets, Asset Management, and Digital Infrastructure Solutions. Our offerings include, amongst others, trading, lending, strategic advisory services, institutional-grade investment solutions, proprietary bitcoin mining and hosting services, network validator services, and the development of enterprise self-custodial technology. The company is headquartered in New York City, with global offices across North America, Europe, and Asia. Additional information about Galaxy’s businesses and products is available on www.galaxy.com.
This press release should be read in conjunction with (i) GDH LP’s Management Discussion and Analysis and Consolidated Financial Statements for the three and nine months ended September 30, 2024 and (ii) GDH Ltd.’s Management Discussion and Analysis and Consolidated Financial Statements for the three and nine months ended September 30, 2024 (together, the “Consolidated Financial Statements” and “MD&As”), which have been filed on SEDAR at www.sedarplus.ca.
Disclaimers and Additional Information
The TSX has not approved or disapproved of the information contained herein. The Ontario Securities Commission has not passed upon the merits of the disclosure record of Galaxy.
This press release is not an offer to buy or sell, nor is it a solicitation of an offer to buy or sell, interests in any Galaxy sponsored fund or any advisory services or any other security or to participate in any advisory services or trading strategy. If any offer and sale of securities in a Galaxy sponsored fund is made, it will be pursuant to the confidential offering memorandum of the fund (the Offering Memorandum or fund prospectus (“Prospectus”)). Any decision to make an investment in any Galaxy sponsored fund should be made after reviewing such Offering Memorandum or Prospectus, conducting such investigations as the investor deems necessary and consulting the investor’s own investment, legal, accounting and tax advisors in order to make an independent determination of the suitability and consequences of an investment.
The finalization of the transactions contemplated by the non-binding term sheet with Helios are contingent upon the successful negotiation and execution of definitive agreements, satisfactory completion of due diligence, and receipt of all necessary consents and approvals. There can be no assurance that a definitive agreement will be entered into or that the proposed transaction will be consummated.
No Offer or Solicitation
As previously announced, the Company intends to complete its proposed reorganization and domestication to become a Delaware-based company, and subsequently list on the Nasdaq, upon completion of the SEC’s ongoing review and subject to stock exchange approval of such listing. The proposed reorganization and domestication is subject to approval by shareholders the Company and applicable regulatory authorities, including the Toronto Stock Exchange. In connection with the proposed reorganization and domestication, the Company has filed a registration statement, including a management information circular/prospectus, with the SEC, which has not yet become effective. SHAREHOLDERS ARE ADVISED TO READ THE FINAL VERSIONS OF SUCH DOCUMENTS, WHEN AVAILABLE, BECAUSE THEY WILL CONTAIN IMPORTANT INFORMATION. Shareholders may obtain a free copy of the registration statement (including the management information circular/prospectus) and any other relevant documents from the SEC’s website at http://www.sec.gov. Copies of the final versions of such documents can also be obtained, when available, without charge, via Galaxy’s investor relations website: https://investor.galaxy.com/ The Company anticipates holding a shareholder meeting to seek approval following the effectiveness of the registration statement, and further details will be included in the management information circular to be mailed to shareholders and posted on the Company’s SEDAR profile at www.sedarplus.ca.
This document shall not constitute a solicitation of a proxy, consent or authorization with respect to any securities or in respect of the domestication or any of the other proposed reorganization transactions. This document does not constitute an offer to sell or the solicitation of an offer to buy any securities or a solicitation of any vote of approval, nor shall there be any sale of securities in any jurisdiction in which such offer, solicitation or sale would be unlawful prior to the registration or qualification under the securities laws of any such jurisdiction.
CAUTION ABOUT FORWARD-LOOKING STATEMENTS
The information in this document may contain “forward-looking statements” within the meaning of Section 27A of the Securities Act of 1933, as amended (the “Securities Act”), Section 21E of the Securities Exchange Act of 1934, as amended and “forward-looking information” under Canadian securities laws (collectively, “forward-looking statements”). Our forward-looking statements include, but are not limited to, statements regarding our or our management team’s expectations, hopes, beliefs, intentions or strategies regarding the future. Statements that are not historical facts, including statements about Galaxy’s business pipelines for banking, expectations for increased load capacity at the Helios site, mining goals and our ability to capture adjacent opportunities, including in high-performance computing and the Helios transaction, focus on self-custody and validator solutions and our commitment to the future of decentralized networks and the pending domestication and the related transactions (the “transactions”), and the parties, perspectives and expectations, are forward-looking statements. In addition, any statements that refer to estimates, projections, forecasts or other characterizations of future events or circumstances, including any underlying assumptions, are forward-looking statements. The words “anticipate,” “believe,” “continue,” “could,” “estimate,” “expect,” “forecast,” “intend,” “may,” “might,” “plan,” “possible,” “potential,” “predict,” “project,” “should,” “would” and similar expressions may identify forward-looking statements, but the absence of these words does not mean that a statement is not forward-looking. The forward-looking statements contained in this document are based on our current expectations and beliefs concerning future developments and their potential effects on us taking into account information currently available to us. There can be no assurance that future developments affecting us will be those that we have anticipated. These forward-looking statements involve a number of risks, uncertainties (some of which are beyond our control) or other assumptions that may cause actual results or performance to be materially different from those expressed or implied by these forward-looking statements. These risks include, but are not limited to: (1) the inability to complete the proposed domestication and reorganization transactions, due to the failure to obtain shareholder and stock exchange approvals, or otherwise; (2) changes to the proposed structure of the transactions that may be required or appropriate as a result of applicable laws or regulations or as a condition to obtaining shareholder or stock exchange approval of the transactions; (3) the ability to meet and maintain listing standards following the consummation of the transactions; (4) the risk that the transactions disrupt current plans and operations; (5) costs related to the transactions, operations and strategy; (6) changes in applicable laws or regulations; (7) the possibility that the Company may be adversely affected by other economic, business, and/or competitive factors; (8) changes or events that impact the cryptocurrency industry, including potential regulation, that are out of our control; (9) the risk that our business will not grow in line with our expectations or continue on its current trajectory; (10) the possibility that our addressable market is smaller than we have anticipated and/or that we may not gain share of it; and (11) the possibility that there is a disruption in mining impacting our ability to achieve expected results or change in power dynamics impacting our results or our ability to increase load capacity, (12) any delay or failure to consummate the business mandates or achieve its pipeline goals in banking and Gk8, (13) liquidity or economic conditions impacting our business, (14) regulatory concerns, technological challenges, cyber incidents or exploits on decentralized networks (15) the failure to enter into definitive agreements or otherwise complete the anticipated transactions with respect to the non-binding term sheet for Helios, (16) those other risks contained in the Annual Information Form for the year ended December 31, 2023 available on the Company’s profile at www.sedarplus.ca and its Management’s Discussion and Analysis, filed on November 7, 2024. Factors that could cause actual results to differ materially from those described in such forward-looking statements include, but are not limited to, a decline in the digital asset market or general economic conditions; the possibility that our addressable market is smaller than we have anticipated and/or that we may not gain share of the stated addressable market; the failure or delay in the adoption of digital assets and the blockchain ecosystem; a delay or failure in developing infrastructure for our business or our businesses achieving our banking and Gk8 mandates; delays or other challenges in the mining business related to hosting, power or our mining infrastructure, or our ability to capture adjacent opportunities; any challenges faced with respect to decentralized networks, considerations with respect to liquidity and capital planning and changes in applicable law or regulation and adverse regulatory developments. Should one or more of these risks or uncertainties materialize, they could cause our actual results to differ materially from the forward-looking statements. We are not undertaking any obligation to update or revise any forward looking statements whether as a result of new information, future events or otherwise. You should not take any statement regarding past trends or activities as a representation that the trends or activities will continue in the future. Accordingly, you should not put undue reliance on these statements.
©Copyright Galaxy Digital 2024. All rights reserved.
Galaxy Digital Holdings LP’s Consolidated Statements of Financial Position (unaudited)
(in thousands)
September 30, 2024
December 31, 2023
Assets
Current assets
Cash and cash equivalent
$ 271,977
$ 316,610
Digital assets
2,490,335
1,078,587
Receivable for digital asset trades
986
41,339
Digital assets loans receivable, net of allowance
305,276
104,504
Digital assets receivables
43,118
14,686
Investments (includes $57.0 million and $0 of equity method
investments, respectively)
594,564
—
Assets posted as collateral
227,050
318,195
Receivables
23,629
15,983
Derivative assets
141,961
173,209
Prepaid expenses and other assets
31,078
37,910
Loans receivable, net of allowance
398,510
377,105
Due from related party
7,420
5,007
Total current assets
4,535,904
2,483,135
Digital assets receivables
7,015
6,174
Investments (includes $393.7 million and $290.4 million of equity method
investments, respectively)
704,542
735,103
Restricted digital assets
26,989
41,356
Digital asset loans receivable, non-current
18,376
—
Loans receivable, non-current
—
10,259
Property and equipment
259,899
259,965
Other non-current assets
115,279
95,000
Goodwill
49,450
44,257
Total non-current assets
1,181,550
1,192,114
Total assets
$ 5,717,454
$ 3,675,249
Liabilities and equity
Current liabilities
Investments sold short
160,146
25,295
Derivative liabilities
112,136
160,642
Accounts payable and accrued liabilities
81,884
69,212
Payable to customers
96,864
3,503
Taxes payable
5,176
25,936
Payable for digital asset trades
23,269
4,176
Digital assets loans payable
1,163,768
398,277
Loans payable
248,818
93,069
Collateral payable
1,154,471
581,362
Due to related party
92,722
67,953
Lease liability
3,772
3,860
Total current liabilities
3,143,026
1,433,285
Notes payable
434,306
408,053
Deferred tax liability
51,841
33,894
Lease liability
7,524
10,236
Total non-current liabilities
493,671
452,183
Total liabilities
3,636,697
1,885,468
Equity
Partners’ capital
2,080,757
1,789,781
Total equity
2,080,757
1,789,781
Total liabilities and equity
$ 5,717,454
$ 3,675,249
Galaxy Digital Holdings LP’s Consolidated Statements of Income (Loss) and Comprehensive Income (Loss) (unaudited)
(in thousands)
Three months ended
Nine months ended
September 30,
2024
September 30,
2023
September 30,
2024
September 30,
2023
Income
Fee revenue
$ 20,693
$ 9,525
$ 75,303
$ 34,207
Net realized gain (loss) on digital assets
(53,623)
(67,617)
55,038
18,681
Net realized gain (loss) on investments
73,819
22,355
(86,189)
68,711
Lending and staking revenue
73,673
14,005
157,984
35,323
Net derivative gain
16,340
15,737
205,302
80,462
Revenue from proprietary mining
11,435
8,848
47,875
20,672
Other income
686
127
1,159
333
143,023
2,980
456,472
258,389
Operating expenses
Compensation and compensation related
39,673
30,995
125,037
96,247
Equity based compensation
12,517
18,769
42,107
57,694
General and administrative
47,678
30,461
142,732
60,108
Mining costs
10,013
3,886
35,734
9,840
Trading and commission expense
5,990
2,811
18,912
6,097
Technology
7,576
4,948
21,424
13,942
Depreciation and amortization
15,552
8,130
40,484
19,895
Impairment reversal
—
—
—
(12,489)
Other
8,547
10,686
26,178
22,823
Professional fees
10,927
7,911
38,247
26,514
Staking costs
39,330
287
69,538
826
Interest
28,935
5,797
69,710
15,670
Notes interest expense
7,105
6,851
21,121
20,372
(186,165)
(101,071)
(508,492)
(277,431)
Other
Net unrealized gain (loss) on digital assets
44,334
26,196
184,047
24,451
Net unrealized gain (loss) on investments
(60,515)
(25,380)
61,023
(8,517)
Net loss on notes payable – derivative
(2,858)
1,082
(15,144)
(1,022)
Foreign currency gain (loss)
95
(768)
1,448
(843)
(18,944)
1,130
231,374
14,069
Income before income taxes
(62,086)
(96,961)
179,354
(4,973)
Income taxes expense (benefit)
(8,446)
(3,240)
(11,661)
586
Net income for the period
$ (53,640)
$ (93,721)
$ 191,015
$ (5,559)
Other comprehensive income
Foreign currency translation adjustment
(118)
$ 419
972
3
Comprehensive income for the period
$ (53,758)
$ (93,302)
$ 191,987
$ (5,556)
Three months ended
Nine months ended
September 30,
2024
September 30,
2023
September 30,
2024
September 30,
2023
GDH LP Net income (loss) per unit:
Basic
$ (0.16)
$ (0.29)
$ 0.57
$ (0.02)
Diluted
(0.16)
(0.29)
0.54
(0.02)
Weighted average units:
Basic
341,208,229
322,656,584
334,883,094
321,154,802
Diluted
341,208,229
322,656,584
352,126,364
323,154,802
Reportable segments (unaudited)
Income and expenses by each reportable segment of GDH LP for the three months ended September 30, 2024 are as follows:
(in thousands)
Global
Markets
Asset
Management
Digital
Infrastructure
Solutions
Corporate
and Other
Totals
Income (loss)
Fee revenue(1)
Mining hosting fees
$ —
$ —
$ 7,024
$ —
$ 7,024
Licensing fees
—
1
801
(121)
681
Management and performance fees
5,526
8,094
—
(708)
12,912
Advisory fees
76
—
—
—
76
Total fee revenue
5,602
8,095
7,825
(829)
20,693
Lending and staking revenue
Lending income
22,429
95
1,111
7
23,642
Blockchain rewards
4,001
1,859
49,432
(5,261)
50,031
Total lending and staking revenue
26,430
1,954
50,543
(5,254)
73,673
Net realized gain on digital assets
(55,660)
2,037
—
—
(53,623)
Net realized gain (loss) on investments
72,503
(1,107)
2,423
—
73,819
Net derivative gain
16,414
—
(74)
—
16,340
Revenue from proprietary mining
—
—
11,435
—
11,435
Other income
654
27
5
—
686
Total revenues and gain (loss) from operations
65,943
11,006
72,157
(6,083)
143,023
Operating expenses
81,269
11,025
82,189
11,682
186,165
Net unrealized gain on digital assets
18,257
25,916
161
—
44,334
Net unrealized gain (loss) on investments
(35,029)
(24,701)
(785)
—
(60,515)
Net loss on notes payable – derivative
—
—
—
(2,858)
(2,858)
Foreign currency loss
95
—
—
—
95
(16,677)
1,215
(624)
(2,858)
(18,944)
Income (loss) before income taxes
$ (32,003)
$ 1,196
$ (10,656)
$ (20,623)
$ (62,086)
Income tax expense
—
—
—
(8,446)
(8,446)
Net income (loss)
$ (32,003)
$ 1,196
$ (10,656)
$ (12,177)
$ (53,640)
Foreign currency translation adjustment
—
—
—
(118)
(118)
Comprehensive income (loss)
$ (32,003)
$ 1,196
$ (10,656)
$ (12,295)
$ (53,758)
(1)Asset Management fee revenue includes management fees generated off the Partnership’s balance sheet venture investments. Licensing fees are attributable to GK8, and include license fees paid by the Partnership for the use of GK8’s technology. All intercompany transactions are eliminated in the Corporate & Other segment.
Income and expenses by each reportable segment of GDH LP for the nine months ended September 30, 2024 are as follows:
(in thousands)
Global
Markets
Asset
Management
Digital
Infrastructure
Solutions
Corporate
and Other(1)
Totals
Income (loss)
Fee revenue (1)
Mining hosting fees
$ —
$ —
$ 24,940
$ —
24,940
Licensing fees
1
1
2,219
(360)
1,861
Management and performance fees
9,220
40,466
—
(2,190)
47,496
Advisory fees
1,006
—
—
—
1,006
Total fee revenue
10,227
40,467
27,159
(2,550)
75,303
Lending and staking revenue
Lending income
55,185
101
1,112
19
56,417
Blockchain rewards
9,663
12,904
93,008
(14,008)
101,567
Total lending and staking revenue
64,848
13,005
94,120
(13,989)
157,984
Net realized gain on digital assets
35,838
18,404
796
—
55,038
Net realized gain (loss) on investments
(100,820)
12,208
2,423
—
(86,189)
Net derivative gain
204,509
—
793
—
205,302
Revenue from proprietary mining
—
—
47,875
—
47,875
Other income
805
60
294
—
1,159
215,407
84,144
173,460
(16,539)
456,472
Operating expenses
214,302
40,610
192,299
61,281
508,492
Net unrealized gain on digital assets
202,839
(15,442)
(3,350)
—
184,047
Net unrealized gain (loss) on investments
63,451
(1,593)
(835)
—
61,023
Net loss on notes payable – derivative
—
—
—
(15,144)
(15,144)
Foreign currency loss
1,448
—
—
—
1,448
267,738
(17,035)
(4,185)
(15,144)
231,374
Income (loss) before income taxes
$ 268,843
$ 26,499
$ (23,024)
$ (92,964)
$ 179,354
Income tax expense
—
—
—
(11,661)
(11,661)
Net income (loss)
$ 268,843
$ 26,499
$ (23,024)
$ (81,303)
$ 191,015
Foreign currency translation adjustment
—
—
—
972
972
Comprehensive income (loss)
$ 268,843
$ 26,499
$ (23,024)
$ (80,331)
$ 191,987
(1)Asset Management fee revenue includes management fees generated off the Partnership’s balance sheet venture investments. Licensing fees are attributable to GK8, and include license fees paid by the Partnership for the use of GK8’s technology. All intercompany transactions are eliminated in the Corporate & Other segment.
Income and expenses by each reportable segment of GDH LP for the three months ended September 30, 2023 are as follows:
(in thousands)
Global
Markets
Asset
Management
Digital
Infrastructure
Solutions
Corporate
and Other
Totals
Income (loss)
Fee revenue (1)
Mining hosting fees
—
—
5,173
—
$ 5,173
Licensing fees
—
—
416
(90)
326
Management and performance fees
—
4,686
—
(711)
3,975
Advisory fees
51
—
—
—
51
Other fee revenues
—
—
—
—
—
Total fee revenue
51
4,686
5,589
(801)
9,525
Lending and staking revenue
Lending income
13,431
7
—
—
13,438
Blockchain rewards
390
177
—
—
567
Total lending and staking revenue
13,821
184
—
—
14,005
Net realized gain on digital assets
(67,232)
(385)
—
—
(67,617)
Net realized gain (loss) on investments
22,001
354
—
—
22,355
Net derivative gain
15,667
—
70
—
15,737
Revenue from proprietary mining
—
—
8,848
—
8,848
Other income (expense)
75
32
199
(179)
127
Total revenues and gain (loss) from operations
(15,617)
4,871
14,706
(980)
2,980
Operating expenses
43,510
12,131
21,933
23,497
101,071
Net unrealized gain (loss) on digital assets
26,919
(723)
—
—
26,196
Net unrealized gain on investments
(4,052)
(20,949)
(379)
—
(25,380)
Net loss on notes payable – derivative
—
—
—
1,082
1,082
Foreign currency loss
(768)
—
—
—
(768)
22,099
(21,672)
(379)
1,082
1,130
Income (loss) before income taxes
$ (37,028)
$ (28,932)
$ (7,606)
$ (23,395)
$ (96,961)
Income tax expense
—
—
—
(3,240)
(3,240)
Net income (loss)
$ (37,028)
$ (28,932)
$ (7,606)
$ (20,155)
$ (93,721)
Foreign currency translation adjustment
—
—
—
419
419
Comprehensive income (loss)
$ (37,028)
$ (28,932)
$ (7,606)
$ (19,736)
$ (93,302)
(1)Asset Management fee revenue includes management fees generated off the Partnership’s balance sheet venture investments, which are eliminated in the Corporate & Other segment.
Income and expenses by each reportable segment of GDH LP for the nine months ended September 30, 2023 are as follows:
(in thousands)
Global
Markets
Asset
Management
Digital
Infrastructure
Solutions
Corporate
and Other
Totals
Income (loss)
Fee revenue (1)
Mining hosting fees
$ —
$ —
$ 17,990
$ —
$ 17,990
Licensing fees
—
—
1,234
(118)
1,116
Management and performance fees
—
13,833
—
(2,093)
11,740
Advisory fees
2,316
—
—
—
2,316
Other fee revenues
(54)
—
1,099
—
1,045
Total fee revenue
2,262
13,833
20,323
(2,211)
34,207
Lending and staking revenue
Lending income
32,509
24
—
—
32,533
Blockchain rewards
1,344
1,446
—
—
2,790
Total lending and staking revenue
33,853
1,470
—
—
35,323
Net realized gain on digital assets
14,261
4,420
—
—
18,681
Net realized gain (loss) on investments
46,100
22,611
—
—
68,711
Net derivative gain
78,985
1,542
(65)
—
80,462
Revenue from proprietary mining
—
—
20,672
—
20,672
Other income (expense)
210
(131)
254
—
333
Total revenues and gain (loss) from operations
175,671
43,745
41,184
(2,211)
258,389
Operating expenses
126,613
42,109
38,995
69,714
277,431
Net unrealized gain (loss) on digital assets
25,476
(1,025)
—
—
24,451
Net unrealized gain on investments
13,079
(27,868)
6,272
—
(8,517)
Net loss on notes payable – derivative
—
—
—
(1,022)
(1,022)
Foreign currency loss
(843)
—
—
—
(843)
37,712
(28,893)
6,272
(1,022)
14,069
Income (loss) before income taxes
$ 86,770
$ (27,257)
$ 8,461
$ (72,947)
$ (4,973)
Income tax expense
—
—
—
586
586
Net income (loss)
$ 86,770
$ (27,257)
$ 8,461
$ (73,533)
$ (5,559)
Foreign currency translation adjustment
—
—
—
3
3
Comprehensive income (loss)
$ 86,770
$ (27,257)
$ 8,461
$ (73,530)
$ (5,556)
(1)Asset Management fee revenue includes management fees generated off the Partnership’s balance sheet venture investments, which are eliminated in the Corporate & Other segment.
Assets and liabilities by reportable segment of GDH LP as of September 30, 2024 are as follows:
(in thousands)
Global
Markets
Asset
Management
Digital
Infrastructure
Solutions
Corporate and
Other
Totals
Total assets
$ 4,610,799
$ 619,779
$ 348,283
$ 138,593
$ 5,717,454
Total liabilities
$ 2,975,526
$ 389
$ 14,577
$ 646,205
$ 3,636,697
Assets and liabilities by reportable segment of GDH LP as of December 31, 2023 are as follows:
(in thousands)
Global
Markets
Asset
Management
Digital
Infrastructure
Solutions
Corporate and
Other
Totals
Total assets
$ 2,726,950
$ 575,056
$ 321,322
$ 51,921
$ 3,675,249
Total liabilities
$ 1,289,792
$ 10,968
$ 9,817
$ 574,891
$ 1,885,468
Select statement of financial position information
Select assets by reporting segment of GDH LP as of September 30, 2024 is as follows:
(in thousands)
Global
Markets
Asset
Management
Digital
Infrastructure
Solutions
Corporate and
Other
Totals
Digital assets
$ 2,454,030
$ 63,294
$ —
$ —
$ 2,517,324
Digital assets receivables
8,240
40,798
1,095
—
50,133
Assets posted as collateral
227,050
—
—
—
227,050
Loans receivable
722,162
—
—
—
722,162
Investments
790,695
497,458
10,953
—
1,299,106
Property and equipment
—
—
254,445
5,454
259,899
$ 4,202,177
$ 601,550
$ 266,493
$ 5,454
$ 5,075,674
Select assets by reporting segment of GDH LP as of December 31, 2023 is as follows:
(in thousands)
Global
Markets
Asset
Management
Digital
Infrastructure
Solutions
Corporate
and Other
Totals
Digital assets
$ 1,052,013
$ 67,930
$ —
$ —
$ 1,119,943
Digital assets receivables
6,506
13,135
1,219
—
20,860
Assets posted as collateral
318,195
—
—
—
318,195
Loans receivable
491,868
—
—
—
491,868
Investments
244,807
476,262
14,034
—
735,103
Property and equipment
109
—
252,552
7,304
259,965
$ 2,113,498
$ 557,327
$ 267,805
$ 7,304
$ 2,945,934
Net Digital Assets Position
Net digital assets includes all digital assets categorized as assets, less all digital assets categorized as liabilities on the statement of financial position and is included in the Company’s liquidity measure. Net digital assets as of September 30, 2024 and December 31, 2023 is as follows:
(in thousands)
BTC (3)
ETH (4)
Stablecoin
Other (5)
As of
September 30,
2024(6)
Assets
Digital assets
$ 1,656,466
$ 369,032
$ 210,864
$ 253,973
$ 2,490,335
Digital asset loans receivable, net of
allowance
634
18,684
280,258
24,076
323,652
Digital assets receivable, current
—
—
—
43,118
43,118
Digital assets receivable, non-current
—
—
—
7,015
7,015
Assets posted as collateral – Digital
assets(1)
189,353
26,814
452
216,619
Restricted digital assets, non-current(2)
—
—
—
26,989
26,989
1,846,453
414,530
491,122
355,623
3,107,728
Liabilities
Digital asset loans payable
657,964
97,039
270,577
138,188
1,163,768
Collateral payable(1)
798,452
164,418
17,967
83,653
1,064,490
Payables to customers
61,785
—
—
—
61,785
1,518,201
261,457
288,544
221,841
2,290,043
Digital assets, net
$ 328,252
$ 153,073
$ 202,578
$ 133,782
817,685
Stablecoins, net
$ —
$ —
$ 202,578
$ —
202,578
Digital assets, net excl. stablecoins
$ 328,252
$ 153,073
$ —
$ 133,782
$ 615,107
Digital asset investment vehicles
included in investments
$ 382,861
$ 24,893
$ —
$ 147,287
555,041
(1) Excludes cash portion of balance on the Partnership’s statement of financial position.
(2) Represents TIA and SOL tokens that are subject to a sale restriction of greater than one year.
(3) Includes associated tokens such as wBTC. In addition to digital assets, net, the Partnership also held interests in investment vehicles designed to hold BTC, including spot ETFs, Galaxy sponsored BTC funds, Mt. Gox Investment Fund LP, and Xapo Holdings Limited, net against associated investment liabilities, reflected in the last row of this table.
(4) Includes associated tokens such as wETH and stETH. In addition to digital assets, net, the Partnership also held interests in investment vehicles designed to hold ETH, including spot ETFs and Galaxy sponsored ETH funds, reflected in the last row of this table.
(5) Includes $8.2 million net SOL and $45.9 million net TIA digital assets, net. In addition to digital assets, net, the Partnership also held interests in investment vehicles designed to hold digital assets, including the Galaxy sponsored Galaxy Digital Crypto Vol Fund LLC (includes $93.0 million SOL and $23.1 million of AVAX) and Ripple Lab Inc., reflected in the last row of this table.
(6) The Partnership also held digital asset derivative positions not reflected in this table.
(in thousands)
BTC (4)
ETH (5)
Stablecoin
Other (5)
As of
December 31,
2023(6)
Assets
Digital assets
$ 589,011
$ 174,978
$ 179,222
$ 135,376
$ 1,078,587
Digital asset loans receivable, net of allowance
3,044
87,252
12,000
2,208
104,504
Digital assets receivable, current
—
—
—
14,686
14,686
Digital assets receivable, non-current
—
—
—
6,174
6,174
Assets posted as collateral – Digital assets(1)
197,092
119,012
—
—
316,104
Restricted digital assets, non-current(2)
—
—
—
41,356
41,356
789,147
381,242
191,222
199,800
1,561,411
Liabilities
Digital asset loans payable
48,202
14,603
297,762
37,710
398,277
Collateral payable(1)
437,889
116,723
9,457
5,926
569,995
486,091
131,326
307,219
43,636
968,272
Digital assets, net
$ 303,056
$ 249,916
$ (115,997)
$ 156,164
593,139
Stablecoins, net(3)
$ —
$ —
$ (115,997)
$ —
(115,997)
Digital assets, net excl. stablecoins
$ 303,056
$ 249,916
$ —
$ 156,164
$ 709,136
Bitcoin spot ETFs included in Investments
$ —
$ —
$ —
$ —
$ —
(1) Excludes cash portion of balance on the Partnership’s statement of financial position.
(2) Represents TIA tokens that are subject to a sale restriction of greater than one year.
(3) As of December 31, 2023, stablecoin liabilities were greater than stablecoin assets.
(4) Includes associated tokens such as wBTC. In addition to digital assets, net, the Partnership also held interests in investment vehicles designed to hold BTC, including bitcoin futures ETFs, Galaxy sponsored BTC funds, Mt. Gox Investment Fund LP, and Xapo Holdings Limited, net of associated investment liabilities, reflected in the last row of this table.
(5) Includes associated tokens such as wETH and stETH. In addition to Digital assets, net, the Partnership also held interests in investment vehicles designed to hold ETH, including Galaxy sponsored ETH funds, reflected in the last row of this table.
(6) Includes $12.0 million net SOL and $68.5 million net TIA. In addition to digital assets, net, the Partnership also held interests in investment vehicles designed to hold digital assets, including Ripple Lab Inc., reflected in the last row of this table.
(7) The Partnership also held digital asset derivative positions not reflected in this table.
All figures are in U.S. Dollars unless otherwise noted.
SOURCE Galaxy Digital Holdings Ltd.

You may like
Technology
Delixi Electric at the 140th Canton Fair Expanding Solutions Strengthening Global Partnerships
Published
8 minutes agoon
October 26, 2026By
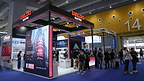
GUANGZHOU, China, Oct. 26, 2026 /PRNewswire/ — The 140th China Import and Export Fair, widely known as the Canton Fair, opened in Guangzhou on October 15, 2026, marking the event’s 70th anniversary. Delixi Electric returned with an expanded portfolio spanning power distribution, industrial control, home electrical products and tools, while inviting distributors and business partners worldwide to explore new opportunities for cooperation.
Under the brand philosophy “Making it happen,” the company presented products for industrial, commercial and residential applications. The display was designed to give international customers more choice and help channel partners broaden their offerings.
A key highlight was the official Canton Fair debut of Delixi Electric’s tool portfolio. Presented under the theme “The right tool for every task,” the range covers hand tools, power tools and measuring tools. A dedicated trial area allowed visitors to experience the products firsthand.
Among Delixi Electric’s industrial offerings, the H500 Series high-performance vector drive and CDC8 Series AC contactor were key highlights. Winner of the 2025 iF Design Award and a CIIF industrial automation award, the H500 targets mid- to high-end drive applications, while the CDC8 supports reliable control in demanding equipment-manufacturing environments. The wider display also featured wall switches, multi-standard sockets and adapters, and power distribution products.
Qi Wenjie, General Manager of Delixi Electric’s Overseas Business Division, said:
“For many years, the Canton Fair has been an important platform for us to understand how market needs are evolving and to engage closely with customers and partners from around the world. As the Fair marks its 70th anniversary, we are pleased to meet global customers and partners here once again.”
“For Delixi Electric, participating in the Canton Fair is about more than presenting individual products. It is also an opportunity to better understand local needs, demonstrate our broader capabilities in power distribution, and explore long-term value together with our customers and partners.”
Since its Canton Fair debut in 2023, Delixi Electric has participated for four consecutive years. Its business network now covers more than 80 countries and regions.
Looking ahead, the company will continue investing in product development, quality management, international certification, supply chain capabilities and local service. By expanding its portfolio and working closely with local partners, Delixi Electric aims to support market development and create sustainable growth opportunities for distributors, customers and industry partners worldwide.
View original content to download multimedia:https://www.prnewswire.com/news-releases/delixi-electric-at-the-140th-canton-fair-expanding-solutions-strengthening-global-partnerships-302918778.html
Technology
SSI SCHAEFER’s Four-Way Pallet Roaming Shuttle Is Expanding Warehouse Design Possibilities
Published
1 hour agoon
October 26, 2026By
SEOUL, South Korea, Oct. 26, 2026 /PRNewswire/ — For warehouse operators in South Korea, warehouse design is increasingly shaped by competing demands: making better use of available space, managing labor constraints and maintaining reliable operations without committing to automation that exceeds business needs.
The challenge is not simply to store more pallets, but to determine how storage capacity can be configured around the inventory characteristics and the movement the operation actually requires.
Rethinking the use of warehouse space
Warehouse capacity is often assessed by the number of pallet positions available. However, the same building footprint can support different storage configurations, each with its own implications for accessibility, material flow and operating requirements.
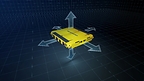
Four-way pallet roaming shuttles, such as the SSI Pallet Roaming Shuttle, use onboard multi-sensor navigation to determine their position, monitor their surroundings in real time, and accurately detect obstacles. This enables flexible pallet handling across multiple storage levels, opening up greater possibilities for high-density, single- or multi-deep pallet storage configurations.
For facilities where building expansion is restricted, the ability to use available space more effectively can be an important design consideration. With system heights of 24 metres and options for 40 metres subject to configuration, solutions like the shuttle allow warehouse planners to evaluate storage designs that make greater use of the space.
Matching movement capability to operational needs
The significance of four-way movement lies in the flexibility it introduces into storage design. This can be particularly relevant to manufacturing operations storing raw materials or finished goods, food and beverage distribution, and temperature-controlled warehouses where storage conditions and space utilisation are crucial design considerations.
The shuttle supports payloads of up to 3000 kg and uses RFID and photoelectric positioning, with a specified positioning accuracy of ±5 mm. Operating at a maximum aislewise speed of 1.5 m/s when loaded and 1.6 m/s when unloaded, it provides a technical basis for evaluating its suitability against a warehouse’s storage and movement requirement.
Automation solving the right challenges, at the right time
For South Korean warehouse operators facing a rapidly aging population and labor constraints, the question is whether automating pallet storage and movement will address a meaningful operational need. Suited to medium-to-low SKU ranges and lower-throughput applications, the SSI Pallet Roaming Shuttle is worth considering where frequent retrievals and reduced reliance on repetitive manual handling are priorities, rather than high-volume pallet retrieval.
“The value of warehouse automation lies in how well a system fits the operation it is designed to serve. More automation does not automatically mean a better warehouse.
The real measure of an effective solution is how well its storage density, retrieval capability and throughput match the operation’s needs. Investing in capacity or performance that the business cannot fully utilise—or sacrificing retrieval flexibility for density—misses the point of warehouse automation,” said Jeon Jae Beom, Head of Sales, SSI Schaefer Korea.
For South Korean businesses balancing space, labor and investment pressures, the key is to select systems according to its intended role in the wider operation, not on the assumption that greater automation will resolve every capacity or productivity challenge.
For more information, visit www.ssi-schaefer.com/ko-kr.
About SSI SCHAEFER
The SSI SCHAEFER Group is a leading global solution provider for all areas of intralogistics. With innovative technologies and software, the company empowers small to medium-sized enterprises as well as large companies to increase the efficiency and sustainability of their storage, picking, and transport processes. SSI SCHAEFER offers complete solutions ranging from fully automated warehouses with tailored service and maintenance packages to robotics and automated guided vehicles, as well as manual and semi-automated systems such as workstations, racks and containers.
View original content to download multimedia:https://www.prnewswire.com/apac/news-releases/ssi-schaefers-four-way-pallet-roaming-shuttle-is-expanding-warehouse-design-possibilities-302917779.html
SOURCE SSI Schaefer Korea
Technology
Heybike Launches V1 Pro, a 72V Power Beast with 8,000W Peak Power and Bigger Attitude
Published
1 hour agoon
October 26, 2026By

ONTARIO, Calif., Oct. 23, 2026 /PRNewswire/ — Heybike today announced the launch of the V1 Pro, a 72V electric dirt bike designed for riders who want bigger tires, bigger attitude, and ultimate off-road performance. With 8,000W peak power, 17-inch front and 14-inch rear tires, and Wheelie Boost Assist, the V1 Pro delivers powerful off-road performance while featuring hydraulic disc brakes and a magnetic emergency kill switch. Available now on Heybike’s official website, the V1 Pro is offered at an Early Bird price of $1,999, compared with its $2,199 MSRP.
The 72V Power Beast, Ready for Every Trail
With its oversized Big Foot tires, bold styling, and powerful 72V drive system, the Heybike V1 Pro is built to stand out. Delivering 8,000W peak power and 250 N•m of wheel torque, it reaches speeds of up to 50 MPH and tackles inclines of up to 45°, bringing serious power to demanding off-road adventures.
Its staggered 17-inch front and 14-inch rear Big Foot tires provide a larger rear contact patch for traction, while 285 mm of ground clearance helps the bike clear rocks, roots, and ruts. A 150 mm-travel front fork and rear hydraulic shock help absorb bumps on uneven terrain.
Powered by a 72V 27Ah battery with 1,944 Wh of capacity, the Heybike V1 Pro offers a range of up to 60 miles on a single charge, with charging taking approximately 5.5–6 hours using the included 84V 5A charger.
Smart Control. Your Ride, Your Way.
The Heybike app lets riders adjust speed limits and throttle response, choose from ECO, LINEAR, and SPORT riding modes, and configure regenerative braking to suit their riding preferences and terrain.
For added personalization, an optional Bluetooth speaker and horn accessory supports music playback and multiple simulated motorcycle engine sounds.
Enhanced Protection for Every Adventure
The Heybike V1 Pro combines performance with multiple safety-focused features. Its 220 mm front and 190 mm rear hydraulic disc brakes provide stopping power, while regenerative braking adds another layer of deceleration control.
A magnetic emergency kill switch is designed to cut power if the rider falls or steps away from the bike. A throttle-reset safety mechanism prevents power delivery until the throttle has returned to its reset position.
The Heybike V1 Pro features a UL 2849-certified battery system and an IPX6 waterproof rating, offering added protection for outdoor riding in changing weather conditions.
Together, these features complement the V1 Pro’s performance-focused design with added control and protection for off-road riding.
Wheelie Boost Assist: Unleash Your Wild Side
Experience wheelies like never before. With just a single mode control, Wheelie Boost™ lifts the front wheel to a fixed angle, safely turning a complex trick into an exciting riding experience. Less effort, more wild — unleash your bigger attitude and take your V1 Pro ride to the next level.
Bring the Family Together. Conquer Every Terrain.
More than an off-road ride, the Heybike V1 Pro opens the door to shared outdoor adventures and memorable family moments. Designed to bring riders together, it makes weekend trail rides and outdoor exploration opportunities for parents and teens to connect, build confidence, and discover new terrain side by side.
From family outings to challenging off-road adventures, the V1 Pro brings power, excitement, and the freedom to explore together.
A Step Up From the Original Heybike V1
Launched in the first half of 2026, the Heybike V1 quickly gained popularity among teens across the United States. Building on that success, the V1 Pro takes off-road performance to the next level with nearly 100% more peak power, 43.8% greater battery capacity, 11% higher top speed, 20% more range, and a 50% higher maximum climbing angle.
Beyond raw power, the V1 Pro delivers 31.5% more wheel torque and 14.5% greater ground clearance, along with stronger front and rear suspension system for a smoother ride. Its larger 17-inch front and 14-inch rear Big Foot tires further enhance off-road control and rear traction, while the full-size frame is designed to accommodate a broader range of riders.
Make Their Next Ride Unforgettable
The Heybike V1 Pro is available now for $1,999 (MSRP $2,199). Customers can also receive a limited-quantity launch gift box with their purchase, while supplies last.
More riding challenges, giveaways, and community activities are on the way. Stay tuned for more ways to ride, connect, and share the adventure.
Shop the Heybike V1 Pro on its official website.
About Heybike
Heybike is a leading global e-bike brand making joy easy to reach for every age and every terrain, from city commutes to off-road adventures, blending accessible innovation, safety-first engineering, and design that connects. Every ride connects you to a worldwide community — to your family, to your city, and to the simple joy of moving. Learn more on Heybike’s official website.
View original content to download multimedia:https://www.prnewswire.com/news-releases/heybike-launches-v1-pro-a-72v-power-beast-with-8-000w-peak-power-and-bigger-attitude-302918913.html
SOURCE Heybike


Delixi Electric at the 140th Canton Fair Expanding Solutions Strengthening Global Partnerships

Hong Kong names Nasdaq-listed Solana Company a strategic enterprise

SSI SCHAEFER’s Four-Way Pallet Roaming Shuttle Is Expanding Warehouse Design Possibilities

Send Rakhi to UK swiftly with UK Gifts Portal

Whiteboard Series with NEAR | Ep: 45 Joel Thorstensson from ceramic.network

Nullmax and Renesas Forge Strategic Partnership to Deliver Competitive ADAS Solutions for the Global Market

Why You Should Build on #NEAR – Co-founder Illia Polosukhin at CV Labs
Whiteboard Series with NEAR | Ep: 45 Joel Thorstensson from ceramic.network

NEAR End of Year Town Hall 2021: The Open Web World, MetaBUILD 2 Hackathon and 2021 recap
Trending
-

 Technology2 days ago
Miami Startup BOB Raises $5.5M To Build An AI-Powered Banking Platform
-

 Technology4 days ago
Voqalize Says Voice Is Becoming the Default Way People Use Software
-

 Technology5 days ago
Toku launches Makimoto Flows, a visual builder for speech AI pipelines, taking its open-source initiative beyond transcription
-

 Coin Market4 days ago
Bitcoin ETFs bag another $528M, taking 3-day haul past $1B
-

 Technology4 days ago
Snapmaker Introduces New Filament Bundle, Expanding Its Full Spectrum Printing Ecosystem
-

 Technology4 days ago
New GASA Research: 71% of Adults Surveyed Across 13 Asian Markets Encountered Scams, with Estimated Losses of US$136.5 Billion
-

 Technology5 days ago
Asymbl Opens Austin Headquarters as AI Takes On More Work
-

 Technology4 days ago
PRC-Saltillo Acquires Ner Chat, Bringing Minspeak® Symbols to Glint Visual Support Platform