Fourth Quarter 2024
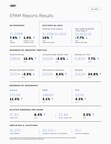
Revenues of $1.248 billion, up 7.9% year-over-yearGAAP Income from Operations was 10.9% of revenues and Non-GAAP Income from Operations was 16.7% of revenuesGAAP Diluted EPS of $1.80, an increase of 8.4%, and Non-GAAP Diluted EPS of $2.84, an increase of 3.3% on a year-over-year basis
Full Year 2024
Revenues of $4.728 billion, up 0.8% year-over-yearGAAP Income from Operations was 11.5% of revenues and Non-GAAP Income from Operations was 16.5% of revenuesGAAP Diluted EPS of $7.84, an increase of 11.0%, and Non-GAAP Diluted EPS of $10.86, an increase of 2.5% on a year-over-year basis
NEWTOWN, Pa., Feb. 20, 2025 /PRNewswire/ — EPAM Systems, Inc. (NYSE: EPAM), a leading digital transformation services and product engineering company, today announced results for its fourth quarter and full year ended December 31, 2024.
“After navigating a dynamic year, we are pleased to report a strong fourth quarter. We continued to build sequential momentum, and saw a return to year-over-year organic growth, while we simultaneously accelerated our global strategy with the acquisitions of NEORIS and First Derivative,” said Arkadiy Dobkin, CEO & President, EPAM. “As we look ahead, we believe 2025 will be a year of transition, as clients balance their cost focus with the need to accelerate their transformational and GenAI journeys. We see a strong need to continue to invest in our talent, advanced technological and consulting capabilities, and the integration of recent acquisitions to best position ourselves to capture market share once demand returns to more normalized levels.”
Fourth Quarter 2024 Highlights
Revenues increased to $1.248 billion, a year-over-year increase of $91.1 million, or 7.9%. On an organic constant currency basis, revenues grew 1.0% compared to the fourth quarter of 2023;GAAP income from operations was $136.5 million, an increase of $14.0 million, or 11.4%, compared to $122.5 million in the fourth quarter of 2023;Non-GAAP income from operations was $208.2 million, an increase of $7.8 million, or 3.9%, compared to $200.4 million in the fourth quarter of 2023;Diluted earnings per share (“EPS”) on a GAAP basis was $1.80, an increase of $0.14, or 8.4%, compared to $1.66 in the fourth quarter of 2023;Non-GAAP diluted EPS was $2.84, an increase of $0.09, or 3.3%, compared to $2.75 in the fourth quarter of 2023;Completed the acquisition of NEORIS creating a competitive offering for clients across Latin America and in Spanish- and Portuguese-speaking countries, while broadening EPAM’s global and nearshore delivery capabilities across Latin America and Europe; andCompleted the acquisition of First Derivative strengthening EPAM’s financial services consulting and delivery capabilities in North America, Europe and APAC and expanding our client portfolio in financial services.
Full Year 2024 Highlights
Revenues increased to $4.728 billion, a year-over-year increase of $37.4 million, or 0.8%. On an organic constant currency basis, revenues declined 1.7% year-over-year;We recorded a benefit of $68.8 million for research & development government incentives in Poland. Specifically, $23.5 million of the benefit related to activities performed during 2023 and $45.3 million of the benefit related to activities performed during the full year of 2024. This benefit was included as a reduction to our Cost of revenues. The impact of this benefit on net income was partially offset as the incentives drove a higher effective tax rate for both GAAP and non-GAAP results. We expect the incentive will be recurring with benefits recognized continuing in the future;GAAP income from operations was $544.6 million, an increase of $43.3 million, or 8.6%, compared to $501.2 million in 2023. GAAP income from operations benefited from the recognition of $68.8 million of incentives related to research and development activities performed in Poland and was negatively impacted by $31.3 million of costs incurred in connection with the Company’s Cost Optimization Programs;Non-GAAP income from operations was $779.2 million, an increase of $14.1 million, or 1.8%, compared to $765.1 million in 2023. Non-GAAP income from operations benefited from the recognition of $45.3 million of incentives related to research and development activities performed in Poland in 2024;Diluted EPS on a GAAP basis was $7.84, an increase of $0.78, or 11.0%, compared to $7.06 in 2023. EPS on a GAAP basis was positively impacted by the recognition of the Polish incentives, which increased income from operations. However, this benefit was partially offset by an increase to the effective tax rate; andNon-GAAP diluted EPS was $10.86, an increase of $0.27, or 2.5%, compared to $10.59 in 2023. EPS on a non-GAAP basis was positively impacted by the recognition of the Polish incentives for activities performed during the full year of 2024, which increased income from operations. However, this benefit was partially offset by an increase to the effective tax rate.
Cash Flow and Other Metrics
Cash provided by operating activities was $130.3 million in the fourth quarter of 2024, a decrease from $171.4 million in the fourth quarter of 2023; and was $559.2 million in 2024, a decrease from $562.6 million in 2023;The Company repurchased 53 thousand shares of its common stock for $13.0 million during the fourth quarter of 2024 under its share repurchase program. During the year ended December 31, 2024, the Company repurchased 1,854 thousand shares of its common stock for $398.0 million under its share repurchase programs. As of December 31, 2024, the Company had $437.0 million remaining under its share repurchase authorization;Cash, cash equivalents and restricted cash totaled $1.290 billion as of December 31, 2024, a decrease of $752.7 million, or 36.8%, from $2.043 billion as of December 31, 2023 largely the result of payments for the acquisitions of NEORIS and First Derivative; andTotal headcount was approximately 61,200 as of December 31, 2024. Included in this number were approximately 55,100 delivery professionals, an increase of 16.3% from December 31, 2023.
2025 Outlook – Full Year and First Quarter
Full Year
EPAM expects the following for the full year:
The Company expects the year-over-year revenue growth rate to be in the range of 10.0% to 14.0% for 2025. The Company expects the year-over-year revenue growth rate on an organic constant currency basis to be in the range of 1.0% to 5.0%;For the full year, EPAM expects GAAP income from operations to be in the range of 9.0% to 10.0% of revenues and non-GAAP income from operations to be in the range of 14.5% to 15.5% of revenues;The Company expects its GAAP effective tax rate and its non-GAAP effective tax rate to both be approximately 24.0%; andEPAM expects GAAP diluted EPS will be in the range of $6.78 to $7.08 for the year, and non-GAAP diluted EPS will be in the range of $10.45 to $10.75 for the year. The Company expects weighted average diluted shares outstanding for the year of 58.1 million.
First Quarter
EPAM expects the following for the first quarter:
The Company expects revenues will be in the range of $1.275 billion to $1.290 billion for the first quarter reflecting a year-over-year increase of 10.0% at the midpoint of the range. The Company expects year-over-year revenue growth on an organic constant currency basis to be approximately flat at the midpoint of the range;For the first quarter, EPAM expects GAAP income from operations to be in the range of 6.5% to 7.5% of revenues and non-GAAP income from operations to be in the range of 12.5% to 13.5% of revenues;The Company expects its GAAP effective tax rate to be approximately 19% and its non-GAAP effective tax rate to be approximately 24%; andEPAM expects GAAP diluted EPS will be in the range of $1.27 to $1.37 for the quarter, and non-GAAP diluted EPS will be in the range of $2.22 to $2.32 for the quarter. The Company expects weighted average diluted shares outstanding for the quarter of 57.7 million.
Conference Call Information
EPAM will host a conference call to discuss results on Thursday, February 20, 2025 at 8:00 a.m. EST. The conference call will be available live on the EPAM website at https://investors.epam.com. Please visit the website at least 15 minutes prior to the call to register for the event. For those who cannot access the live webcast, a replay will be available in the Investor Relations section of the website.
About EPAM Systems
Since 1993, EPAM Systems, Inc. (NYSE: EPAM) has used its software engineering expertise to become a leading global provider of digital engineering, cloud and AI-enabled transformation services, and a leading business and experience consulting partner for global enterprises and ambitious startups. We address our clients’ transformation challenges by focusing EPAM Continuum’s integrated strategy, experience and technology consulting with our 30+ years of engineering execution to speed our clients’ time to market and drive greater value from their innovations and digital investments.
We leverage AI and GenAI to deliver transformative solutions that accelerate our clients’ digital innovation and enhance their competitive edge. Through platforms like EPAM AI/RUN™ and initiatives like DIALX Lab, we integrate advanced AI technologies into tailored business strategies, driving significant industry impact and fostering continuous innovation.
We deliver globally but engage locally with our expert teams of consultants, architects, designers and engineers, making the future real for our clients, our partners, and our people around the world. We believe the right solutions are the ones that improve people’s lives and fuel competitive advantage for our clients across diverse industries. Our thinking comes to life in the experiences, products and platforms we design and bring to market.
Added to the S&P 500 and the Forbes Global 2000 in 2021 and recognized by Glassdoor and Newsweek as Most Loved Workplace, our multidisciplinary teams serve customers across six continents. We are proud to be among the top 15 companies in Information Technology Services in the Fortune 1000 and to be recognized as a leader in the IDC MarketScapes for Worldwide Experience Build Services, Worldwide Experience Design Services and Worldwide Software Engineering Services.
Learn more at www.epam.com follow us on LinkedIn.
Non-GAAP Financial Measures
EPAM supplements results reported in accordance with United States generally accepted accounting principles, referred to as GAAP, with non-GAAP financial measures. Management believes these measures help illustrate underlying trends in EPAM’s business and uses the measures to establish budgets and operational goals, communicate internally and externally, for managing EPAM’s business and evaluating its performance. Management also believes these measures help investors compare EPAM’s operating performance with its results in prior periods. EPAM anticipates that it will continue to report both GAAP and certain non-GAAP financial measures in its financial results, including non-GAAP results that exclude stock-based compensation expenses, acquisition-related costs including amortization of acquired intangible assets, impairment of assets, expenses associated with EPAM’s humanitarian commitment to its professionals in Ukraine, unbilled business continuity resources resulting from Russia’s invasion of Ukraine, costs associated with the geographic repositioning of EPAM employees based outside of Ukraine impacted by the war and geopolitical instability in the region, employee separation costs incurred in connection with restructuring programs including the Company’s exit from Russia, certain other one-time charges and benefits, changes in fair value of contingent consideration, foreign exchange gains and losses, excess tax benefits related to stock-based compensation, and the related effect on income taxes of the pre-tax adjustments. Management also compares revenues on an “organic constant currency basis,” which is a non-GAAP financial measure. This measure excludes the effect of acquisitions by removing revenues from an acquired company in the twelve months after completing an acquisition, the decision to exit from Russia by removing revenues from clients located in Russia in both the current period and prior period of comparison, and foreign currency exchange rate fluctuations by translating current period revenues into U.S. dollars at the weighted average exchange rates of the prior period of comparison. Because EPAM’s reported non-GAAP financial measures are not calculated in accordance with GAAP, these measures are not comparable to GAAP and may not be comparable to similarly described non-GAAP measures reported by other companies within EPAM’s industry. Consequently, EPAM’s non-GAAP financial measures should not be evaluated in isolation or supplant comparable GAAP measures, but rather, should be considered together with the information in EPAM’s consolidated financial statements, which are prepared in accordance with GAAP.
Forward-Looking Statements
This press release includes estimates and statements which may constitute forward-looking statements made pursuant to the safe harbor provisions of the Private Securities Litigation Reform Act of 1995, the accuracy of which are necessarily subject to risks, uncertainties, and assumptions as to future events that may not prove to be accurate. Our estimates and forward-looking statements are mainly based on our current expectations and estimates of future events and trends, which affect or may affect our business and operations. These statements may include words such as “may,” “will,” “should,” “believe,” “expect,” “anticipate,” “intend,” “plan,” “estimate” or similar expressions. Those future events and trends may relate to, among other things, developments relating to the war in Ukraine and escalation of the war in the surrounding region, political and civil unrest or military action in the geographies where we conduct business and operate, difficult conditions in global capital markets, foreign exchange markets and the broader economy, and the effect that these events may have on customer demand and our revenues, operations, access to capital, and profitability. Other factors that could cause actual results to differ materially from those expressed or implied include general economic conditions, the risk factors discussed in the Company’s most recent Annual Report on Form 10-K and the factors discussed in the Company’s Quarterly Reports on Form 10-Q, particularly under the headings “Management’s Discussion and Analysis of Financial Condition and Results of Operations” and “Risk Factors” and other filings with the Securities and Exchange Commission. Although we believe that these estimates and forward-looking statements are based upon reasonable assumptions, they are subject to several risks and uncertainties and are made based on information currently available to us. EPAM undertakes no obligation to update or revise any forward-looking statements, whether as a result of new information, future events, or otherwise, except as may be required under applicable securities law.
EPAM SYSTEMS, INC. AND SUBSIDIARIES
CONSOLIDATED STATEMENTS OF INCOME
(Unaudited)
(In thousands, except per share data)
Three Months Ended
December 31,
Year Ended December 31,
2024
2023
2024
2023
Revenues
$ 1,248,351
$ 1,157,257
$ 4,727,940
$ 4,690,540
Operating expenses:
Cost of revenues (exclusive of depreciation and amortization)
868,314
797,633
3,277,497
3,256,514
Selling, general and administrative expenses
216,969
213,972
816,300
815,065
Depreciation and amortization expense
26,556
23,158
89,559
91,800
Loss on sale of business
—
—
—
25,922
Income from operations
136,512
122,494
544,584
501,239
Interest and other income, net
6,451
13,962
46,876
51,124
Foreign exchange loss
(5,632)
(9,053)
(7,048)
(15,778)
Income before provision for income taxes
137,331
127,403
584,412
536,585
Provision for income taxes
34,032
29,849
129,879
119,502
Net income
$ 103,299
$ 97,554
$ 454,533
$ 417,083
Net income per share:
Basic
$ 1.82
$ 1.69
$ 7.93
$ 7.21
Diluted
$ 1.80
$ 1.66
$ 7.84
$ 7.06
Shares used in calculation of net income per share:
Basic
56,818
57,767
57,288
57,829
Diluted
57,435
58,913
57,983
59,085
EPAM SYSTEMS, INC. AND SUBSIDIARIES
CONSOLIDATED BALANCE SHEETS
(Unaudited)
(In thousands, except par value)
As of
December 31,
2024
As of
December 31,
2023
Assets
Current assets
Cash and cash equivalents
$ 1,286,267
$ 2,036,235
Trade receivables and contract assets, net of allowance of $5,612 and $11,864, respectively
1,002,175
897,032
Short-term investments
1,690
60,739
Prepaid and other current assets
136,116
97,355
Total current assets
2,426,248
3,091,361
Property and equipment, net
207,667
235,053
Operating lease right-of-use assets, net
128,244
134,898
Intangible assets, net
436,418
71,118
Goodwill
1,181,575
562,459
Deferred tax assets
269,799
197,901
Other noncurrent assets
100,522
59,575
Total assets
$ 4,750,473
$ 4,352,365
Liabilities
Current liabilities
Accounts payable
$ 44,702
$ 31,992
Accrued compensation and benefits expenses
484,952
412,747
Accrued expenses and other current liabilities
201,356
124,823
Income taxes payable, current
50,395
38,812
Operating lease liabilities, current
39,634
36,558
Total current liabilities
821,039
644,932
Long-term debt
25,194
26,126
Operating lease liabilities, noncurrent
98,426
109,261
Deferred tax liabilities, noncurrent
92,362
8,744
Other noncurrent liabilities
82,301
91,832
Total liabilities
1,119,322
880,895
Commitments and contingencies
Equity
Stockholders’ equity
Common stock, $0.001 par value; 160,000 authorized; 56,869 shares issued and outstanding at December 31, 2024, and 57,787 shares issued and outstanding at December 31, 2023
57
58
Additional paid-in capital
1,190,222
1,008,766
Retained earnings
2,555,796
2,501,107
Accumulated other comprehensive loss
(116,864)
(39,040)
Total EPAM Systems, Inc. stockholders’ equity
3,629,211
3,470,891
Noncontrolling interest in consolidated subsidiaries
1,940
579
Total equity
3,631,151
3,471,470
Total liabilities and equity
$ 4,750,473
$ 4,352,365
EPAM SYSTEMS, INC. AND SUBSIDIARIES
Reconciliations of Non-GAAP Financial Measures to Comparable GAAP Financial Measures
(Unaudited)
(In thousands, except percent and per share amounts)
Reconciliation of revenue growth as reported on a GAAP basis to revenue growth/(decline) on an organic constant currency basis is presented in the table below:
Three Months Ended
December 31, 2024
Year Ended
December 31, 2024
Revenue growth as reported
7.9 %
0.8 %
Foreign exchange rates impact
0.4 %
(0.1) %
Inorganic revenue growth
(7.3) %
(2.7) %
Impact of exit from Russia
— %
0.3 %
Revenue growth/(decline) on an organic constant currency basis
1.0 %
(1.7) %
Reconciliation of various income statement amounts from GAAP to non-GAAP for the three months and years ended December 31, 2024 and 2023:
Three Months Ended December 31, 2024
Year Ended December 31, 2024
GAAP
Adjustments
Non-GAAP
GAAP
Adjustments
Non-GAAP
Cost of revenues (exclusive of depreciation and amortization)(1)
$ 868,314
$ (22,040)
$ 846,274
$ 3,277,497
$ (59,821)
$ 3,217,676
Selling, general and administrative expenses(2)
$ 216,969
$ (37,637)
$ 179,332
$ 816,300
$ (145,329)
$ 670,971
Income from operations(3)
$ 136,512
$ 71,675
$ 208,187
$ 544,584
$ 234,625
$ 779,209
Operating margin
10.9 %
5.8 %
16.7 %
11.5 %
5.0 %
16.5 %
Net income(4)
$ 103,299
$ 60,066
$ 163,365
$ 454,533
$ 175,430
$ 629,963
Diluted earnings per share
$ 1.80
$ 2.84
$ 7.84
$ 10.86
Three Months Ended December 31, 2023
Year Ended December 31, 2023
GAAP
Adjustments
Non-GAAP
GAAP
Adjustments
Non-GAAP
Cost of revenues (exclusive of depreciation and amortization)(1)
$ 797,633
$ (22,183)
$ 775,450
$ 3,256,514
$ (89,464)
$ 3,167,050
Selling, general and administrative expenses(2)
$ 213,972
$ (49,747)
$ 164,225
$ 815,065
$ (125,768)
$ 689,297
Income from operations(3)
$ 122,494
$ 77,939
$ 200,433
$ 501,239
$ 263,871
$ 765,110
Operating margin
10.6 %
6.7 %
17.3 %
10.7 %
5.6 %
16.3 %
Net income(4)
$ 97,554
$ 64,211
$ 161,765
$ 417,083
$ 208,555
$ 625,638
Diluted earnings per share
$ 1.66
$ 2.75
$ 7.06
$ 10.59
Items (1) through (4) above are detailed in the following table with the specific cross-reference noted in the appropriate item.
Three Months Ended
December 31,
Year Ended
December 31,
2024
2023
2024
2023
Stock-based compensation expenses
$ 22,074
$ 19,228
$ 80,944
$ 68,797
Poland R&D incentives(a)
(556)
—
(23,473)
—
Humanitarian support in Ukraine(b)
522
2,955
2,350
11,252
Unbilled business continuity resources(c)
—
—
—
9,415
Total adjustments to GAAP cost of revenues(1)
22,040
22,183
59,821
89,464
Stock-based compensation expenses
22,624
18,966
86,353
78,933
Cost Optimization charges(d)
4,837
27,936
31,270
35,052
Other acquisition-related expenses
7,031
275
15,808
2,723
Humanitarian support in Ukraine(b)
3,127
836
10,821
6,145
Geographic repositioning(e)
(4)
916
849
1,793
One-time charges
22
818
228
1,122
Total adjustments to GAAP selling, general and administrative expenses(2)
37,637
49,747
145,329
125,768
Amortization of purchased intangible assets
11,998
6,009
29,475
22,717
Loss on sale of business(f)
—
—
—
25,922
Total adjustments to GAAP income from operations(3)
71,675
77,939
234,625
263,871
Foreign exchange loss
5,632
9,053
7,048
15,778
Change in fair value of contingent consideration included in Interest and other income, net
1,673
1,000
5,700
2,818
One-time benefits/(charges) included in Interest and other income, net
(1,331)
700
(3,143)
700
Provision for income taxes:
Tax effect on non-GAAP adjustments
(15,640)
(19,755)
(44,522)
(53,815)
Excess tax benefits related to stock-based compensation
(1,943)
(4,726)
(22,448)
(19,829)
Net discrete benefit from tax planning(g)
—
—
(1,830)
(968)
Total adjustments to GAAP net income(4)
$ 60,066
$ 64,211
$ 175,430
$ 208,555
(a)
We have excluded from non-GAAP results the portion of the benefit from Poland R&D incentives related to qualifying activities performed in 2023 as it represents a nonrecurring one-time benefit.
(b)
Humanitarian support in Ukraine includes expenses related to EPAM’s $100 million humanitarian commitment in response to Russia’s invasion of Ukraine to support EPAM professionals and their families in and displaced from Ukraine. These expenses are incremental to those expenses incurred prior to the crisis, clearly separable from normal operations, and not expected to recur once the crisis has subsided and operations return to normal.
(c)
Given the uncertainty in the region introduced by Russia’s invasion of Ukraine, EPAM has assigned delivery professionals in locations outside of the region to ensure the continuity of delivery for customers who have substantial delivery exposure to Ukraine or other delivery concerns resulting from the invasion. These employees are not billed to clients and operate largely in a standby or backup capacity. These expenses are incremental to those expenses incurred prior to the crisis, clearly separable from normal operations, and not expected to recur once the crisis has subsided and operations return to normal.
(d)
Cost Optimization charges include severance, facilities and contract termination charges incurred in connection with the programs initiated in the third quarter of 2023 and second quarter of 2024. Consistent with the Company’s historical non-GAAP policy, costs incurred in connection with formal restructuring initiatives have been excluded from non-GAAP results as these are one-time and unusual in nature.
(e)
Geographic repositioning includes expenses associated with the relocation to other countries of employees based outside of Ukraine impacted by the war and geopolitical instability in the region, and includes the cost of accommodations, travel and food. These expenses are incremental to those expenses incurred prior to the crisis, clearly separable from normal operations, and not expected to recur once the crisis has subsided and operations return to normal.
(f)
On July 26, 2023, the Company completed the sale of its remaining operations in Russia and recorded a loss on sale of approximately $25.9 million during the year ended December 31, 2023, including the recognition of the accumulated currency translation loss related to this foreign entity that was previously included in Accumulated other comprehensive loss in the financial statements. The Company excluded this loss from non-GAAP results as it is one-time and unusual in nature.
(g)
One-time benefit related to the implementation of tax planning to disregard certain foreign subsidiaries as separate entities for U.S. income tax purposes. Consistent with the Company’s historical non-GAAP policy, the benefit related to the implementation of tax planning has been excluded from non-GAAP results as it is one-time and unusual in nature.
EPAM SYSTEMS, INC. AND SUBSIDIARIES
Reconciliations of Guidance Non-GAAP Financial Measures to Comparable GAAP Financial Measures
(Unaudited)
The below guidance constitutes forward-looking statements within the meaning of the federal securities laws and is based on a number of assumptions that are subject to change and many of which are outside the control of the Company. Actual results may differ materially from the Company’s expectations depending on factors discussed in the Company’s filings with the Securities and Exchange Commission.
Reconciliation of expected revenue growth on a GAAP basis to expected revenue growth on an organic constant currency basis is presented in the table below:
First Quarter 2025
Full Year 2025
(at midpoint of
range)
Revenue growth
10.0 %
10.0% to 14.0%
Foreign exchange rates impact
1.4 %
0.9 %
Inorganic revenue growth
(11.4) %
(9.9) %
Revenue growth on an organic constant currency basis
— %
1.0% to 5.0%
Reconciliation of expected GAAP to non-GAAP income from operations as a percentage of revenues is presented in the table below:
First Quarter 2025
Full Year 2025
GAAP income from operations as a percentage of revenues
6.5% to 7.5%
9.0% to 10.0%
Stock-based compensation expenses
3.9 %
3.7 %
Included in cost of revenues (exclusive of depreciation and amortization)
1.9 %
1.8 %
Included in selling, general and administrative expenses
2.0 %
1.9 %
Humanitarian support in Ukraine(b)
0.2 %
0.3 %
Cost Optimization charges(d)
0.5 %
0.2 %
Amortization of acquired intangible assets
1.4 %
1.3 %
Non-GAAP income from operations as a percentage of revenues(h)
12.5% to 13.5%
14.5% to 15.5%
(h) EPAM has not included the impact of potential future One-time charges including asset impairments, unusual gains and losses, expenses incurred in connection with future cost optimization actions, and Other acquisition-related expenses because the Company is unable to predict these amounts with reasonable certainty.
Reconciliation of expected GAAP to non-GAAP effective tax rate is presented in the table below:
First Quarter 2025
Full Year 2025
GAAP effective tax rate (approximately)
19 %
24 %
Excess tax benefits related to stock-based compensation
7.5 %
2.6 %
Tax effect on non-GAAP adjustments
(2.5) %
(2.6) %
Non-GAAP effective tax rate (approximately)
24 %
24 %
Reconciliation of expected GAAP to non-GAAP diluted earnings per share is presented in the table below:
First Quarter 2025
Full Year 2025
GAAP diluted earnings per share
$1.27 to $1.37
$6.78 to $7.08
Stock-based compensation expenses
0.87
3.33
Included in cost of revenues (exclusive of depreciation and amortization)
0.42
1.61
Included in selling, general and administrative expenses
0.45
1.72
Humanitarian support in Ukraine(b)
0.07
0.25
Cost Optimization charges(d)
0.10
0.12
Amortization of acquired intangible assets
0.31
1.17
Foreign exchange loss
0.02
0.07
Provision for income taxes:
Tax effect on non-GAAP adjustments
(0.29)
(1.04)
Excess tax benefits related to stock-based compensation
(0.13)
(0.23)
Non-GAAP diluted earnings per share(h)
$2.22 to $2.32
$10.45 to $10.75
View original content to download multimedia:https://www.prnewswire.com/news-releases/epam-reports-results-for-fourth-quarter-and-full-year-2024-302381106.html
SOURCE EPAM Systems, Inc.









 Technology5 days ago
 Technology4 days ago
 Coin Market4 days ago
 Coin Market4 days ago
 Technology4 days ago
 Technology4 days ago
 Technology3 days ago