
Technology
STAGWELL INC. (NASDAQ: STGW) REPORTS RESULTS FOR THE THREE AND TWELVE MONTHS ENDED DECEMBER 31, 2024
Published
1 year agoon
By
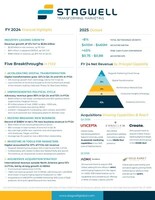
Q4 YoY Revenue Growth of 20%, With 22% Growth in Digital Transformation
Q4 YoY Net Revenue Growth of 14%, Organic Net Revenue Growth of 10%, Digital Transformation Net Revenue Growth of 15%
Q4 Net Income Attributable to Stagwell Inc. Common Shareholders of $3 million
Q4 Adjusted EBITDA of $123 million; Adjusted EBITDA Margin of 20%
Q4 EPS of $0.03; Adjusted EPS of $0.24
Eighth Consecutive Quarter of Record LTM Net New Business
Net New Business of $102 million in Q4; LTM Net New Business of $382 million
Introduce Guidance for 2025 of Total Net Revenue Growth of ~8%; Adjusted EBITDA of $410 million to $460 million; Free Cash Flow Conversion in excess of 45%
Stagwell To Host Investor Day on April 2nd 2025
NEW YORK, Feb. 27, 2025 /PRNewswire/ — (NASDAQ: STGW) – Stagwell Inc. (“Stagwell”) today announced financial results for the quarter and year ended December 31, 2024.
FOURTH QUARTER RESULTS:
Q4 Revenue of $789 million, an increase of 20% versus the prior year period; Full Year Revenue of $2.8 billion, an increase of 12% versus the prior yearQ4 Net Revenue of $630 million, an increase of 14% versus the prior year period; Full Year Net Revenue of $2.3 billion, an increase of 7% versus the prior yearQ4 Organic Net Revenue increased 10% versus the prior year period; Full Year Organic Net Revenue increased 5% versus the prior yearQ4 Net Income attributable to Stagwell Inc. Common Shareholders of $3 million versus $1 million in the prior year period; Full Year Net Income attributable to Stagwell Inc. Common Shareholders of $2 million versus $0.1 million in the prior yearQ4 Adjusted EBITDA of $123 million, an increase of 30% versus the prior year period; Full Year Adjusted EBITDA of $411 million, an increase of 14% versus the prior yearQ4 Adjusted EBITDA Margin of 20% on net revenue; Full Year Adjusted EBITDA Margin of 18% on net revenueQ4 Earnings Per Share Attributable to Stagwell Inc. Common Shareholders of $0.03 versus $0.00 in the prior year period; Full Year Earnings Per Share Attributable to Stagwell Inc. Common Shareholders of $0.02 versus $0.00 in the prior yearQ4 Adjusted Earnings Per Share attributable to Stagwell Inc. Common Shareholders of $0.24 versus $0.12 in the prior year period; Full Year Adjusted Earnings Per Share attributable to Stagwell Inc. Common Shareholders of $0.77 versus $0.57 in the prior yearNet new business of $102 million in the fourth quarter, last twelve-month net new business of $382 million
See “Non-GAAP Financial Measures” below for explanations and reconciliations of the Company’s non-GAAP financial measures.
Mark Penn, Chairman and CEO of Stagwell, said, “2024 was a breakthrough year for Stagwell and has fueled a strong start to 2025. We re-established ourselves as the fastest growing business in the industry, accelerated rapidly in Digital Transformation, took advantage of an unprecedented U.S. election cycle, and made strategic investments to expand our capabilities and geographical reach. I’m looking forward to a strong 2025.”
Frank Lanuto, Chief Financial Officer, commented: “Stagwell posted strong results in the fourth quarter with double-digit revenue growth in 4 of our 5 principal capabilities. We delivered fourth quarter revenue of $789 million. Simultaneously, we grew our adjusted EBITDA to $123 million, representing a 20% margin on net revenue, an improvement of approximately 230 bps over the prior year period, as we lowered our comp to revenue ratio to 57.5%, a company record. These results give us confidence in the year ahead.”
Financial Outlook
2025 financial guidance is announced as follows:
Total Net Revenue growth of approximately 8%Adjusted EBITDA of $410 million to $460 millionFree Cash Flow Conversion in excess of 45%Adjusted EPS of $0.75 – $0.88Guidance includes anticipated impact from acquisitions or dispositions.
* The Company has excluded a quantitative reconciliation with respect to the Company’s 2025 guidance under the “unreasonable efforts” exception in Item 10(e)(1)(i)(B) of Regulation S-K. See “Non-GAAP Financial Measures” below for additional information.
Video Webcast
Management will host a video webcast on Thursday, February 27, 2025, at 8:30 a.m. (ET) to discuss results for Stagwell Inc. for the quarter and year ended December 31, 2024. The video webcast will be accessible at https://bit.ly/3EVAIAk. An investor presentation has been posted on our website at www.stagwellglobal.com and may be referred to during the webcast.
A recording of the webcast will be accessible one hour after the webcast and available for ninety days at www.stagwellglobal.com.
Stagwell Inc.
Stagwell is the challenger network built to transform marketing. We deliver scaled creative performance for the world’s most ambitious brands, connecting culture-moving creativity with leading-edge technology to harmonize the art and science of marketing. Led by entrepreneurs, our specialists in 40+ countries are unified under a single purpose: to drive effectiveness and improve business results for their clients. Join us at www.stagwellglobal.com.
Contacts
For Investors:
Ben Allanson
IR@stagwellglobal.com
For Press:
Beth Sidhu
PR@stagwellglobal.com
Non-GAAP Financial Measures
In addition to its reported results, Stagwell Inc. has included in this earnings release certain financial results that the Securities and Exchange Commission (SEC) defines as “non-GAAP Financial Measures.” Management believes that such non-GAAP financial measures, when read in conjunction with the Company’s reported results, can provide useful supplemental information for investors analyzing period to period comparisons of the Company’s results. Such non-GAAP financial measures include the following:
(1) Organic Net Revenue: “Organic net revenue growth” and “Organic net revenue decline” reflects the year-over-year change in the Company’s reported net revenue attributable to the Company’s management of the entities it owns. We calculate organic net revenue growth (decline) by subtracting the net impact of acquisitions (divestitures) and the impact of foreign currency exchange fluctuations from the aggregate year-over-year increase or decrease in the Company’s reported net revenue. The net impact of acquisitions (divestitures) reflects the year-over-year change in the Company’s reported net revenue attributable to the impact of all individual entities that were acquired or divested in the current and prior year. We calculate impact of an acquisition as follows: (a) for an entity acquired during the current year, we present the entity’s prior year net revenue for the same period during which we owned it in the current year as impact of the acquisition in the current year; and (b) for an entity acquired in the prior year, we present the entity’s prior year net revenue for the period during which we did not own the entity in the prior year as impact of the acquisition in the current year. We calculate impact of a divestiture as follows: (a) for a divestiture in the current year, we present the entity’s prior year net revenue for the same period during which we no longer owned it in the current year as impact of the divestiture in the current year; and (b) for a divestiture in the prior year, we present the entity’s prior year net revenue for the period during which we owned it in the prior year as impact of the divestiture in the current year. We calculate the impact of any acquisition or divestiture without adjusting for foreign currency exchange fluctuations. The impact of foreign currency exchange fluctuations reflects the year-over-year change in the Company’s reported net revenue attributable to changes in foreign currency exchange rates. We calculate the impact of foreign currency exchange fluctuations for the portion of the reporting period in which we recognized revenue from a foreign entity in both the current year and the prior year. The impact is calculated as the difference between (1) reported prior period net revenue (converted to U.S. dollars at historical foreign currency exchange rates) and (2) prior period net revenue converted to U.S. dollars at current period foreign exchange rates.
(2) Net New Business: Estimate of annualized revenue for new wins less annualized revenue for losses incurred in the period.
(3) Adjusted EBITDA: defined as Net income excluding non-operating income or expense to achieve operating income, plus depreciation and amortization, stock-based compensation, deferred acquisition consideration adjustments, and other items. Other items include restructuring costs, acquisition-related expenses, and non-recurring items.
(4) Adjusted Diluted EPS is defined as (i) Net income (loss) attributable to Stagwell Inc. common shareholders, plus net income attributable to Class C shareholders, excluding amortization expense, impairment and other losses, stock-based compensation, deferred acquisition consideration adjustments, discrete tax items, and other items, divided by (ii) (a) the per weighted average number of common shares outstanding plus (b) the weighted average number of Class C shares outstanding, (if dilutive). Other items includes restructuring costs, acquisition-related expenses, and non-recurring items, and subject to the anti-dilution rules.
(5) Free Cash Flow: defined as Adjusted EBITDA less capital expenditures, change in net working capital, cash taxes, interest, and distributions to minority interests, but excludes contingent M&A payments. Free Cash Flow Conversion is the percentage of adjusted EBITDA.
Included in this earnings release are tables reconciling reported Stagwell Inc. results to arrive at certain of these non-GAAP financial measures.
This document contains forward-looking statements within the meaning of Section 27A of the Securities Act of 1933, as amended (the “Securities Act”), and Section 21E of the Securities Exchange Act of 1934, as amended (the “Exchange Act”). The Company’s representatives may also make forward-looking statements orally or in writing from time to time. Statements in this document that are not historical facts, including, statements about the Company’s beliefs and expectations, future financial performance, growth, and future prospects, the Company’s strategy, business and economic trends and growth, technological leadership and differentiation, potential and completed acquisitions, anticipated and actual operating efficiencies and synergies and estimates of amounts for redeemable noncontrolling interests and deferred acquisition consideration, constitute forward-looking statements. Forward-looking statements, which are generally denoted by words such as “ability,” “aim,” “anticipate,” “assume,” “believe,” “build,” “consider,” “continue,” “could,” “create,” “develop,” “drive,” “estimate,” “expect,” “focus,” “forecast,” “foresee,” “future,” “goal,” “guidance,” “in development,” “intend,” “likely,” “look,” “maintain,” “may,” “ongoing,” “opportunity,” “outlook,” “plan,” “possible,” “potential,” “predict,” “probable,” “project,” “should,” “target,” “will,” “would” or the negative of such terms or other variations thereof and terms of similar substance used in connection with any discussion of current plans, estimates and projections are subject to change based on a number of factors, including those outlined in this section.
Forward-looking statements in this document are based on certain key expectations and assumptions made by the Company. Although the management of the Company believes that the expectations and assumptions on which such forward-looking statements are based are reasonable, undue reliance should not be placed on the forward-looking statements because the Company can give no assurance that they will prove to be correct. The material assumptions upon which such forward-looking statements are based include, among others, assumptions with respect to general business, economic and market conditions, the competitive environment, anticipated and unanticipated tax consequences and anticipated and unanticipated costs. These forward-looking statements are based on current plans, estimates and projections, and are subject to change based on a number of factors, including those outlined in this section. These forward-looking statements are subject to various risks and uncertainties, many of which are outside the Company’s control. Therefore, you should not place undue reliance on such statements. Forward-looking statements speak only as of the date they are made, and the Company undertakes no obligation to update publicly any of them in light of new information or future events, if any.
Forward-looking statements involve inherent risks and uncertainties. A number of important factors could cause actual results to differ materially from those contained in any forward-looking statements. Such risk factors include, but are not limited to, the following:
risks associated with international, national and regional unfavorable economic conditions that could affect the Company or its clients;demand for the Company’s services, which may precipitate or exacerbate other risks and uncertainties;inflation and actions taken by central banks to counter inflation;the Company’s ability to attract new clients and retain existing clients;the impact of a reduction in client spending and changes in client advertising, marketing and corporate communications requirements;financial failure of the Company’s clients;the Company’s ability to retain and attract key employees;the Company’s ability to compete in the markets in which it operates;the Company’s ability to achieve its cost saving initiatives;the Company’s implementation of strategic initiatives;the Company’s ability to remain in compliance with its debt agreements and the Company’s ability to finance its contingent payment obligations when due and payable, including but not limited to those relating to redeemable noncontrolling interests and deferred acquisition consideration;the Company’s ability to manage its growth effectively;the Company’s ability to identify and complete acquisitions or other strategic transactions that complement and expand the Company’s business capabilities and successfully integrate newly acquired businesses into the Company’s operations, retain key employees, and realize expected cost savings, synergies and other related anticipated benefits within the expected time period;the Company’s ability to identify and complete divestitures and to achieve the anticipated benefits therefrom;the Company’s ability to develop products incorporating new technologies, including augmented reality, artificial intelligence, and virtual reality, and realize benefits from such products;the Company’s use of artificial intelligence, including generative artificial intelligence;adverse tax consequences for the Company, its operations and its stockholders, that may differ from the expectations of the Company, including that future changes in tax laws, potential increases to corporate tax rates in the United States and disagreements with tax authorities on the Company’s determinations that may result in increased tax costs;adverse tax consequences in connection with the business combination that formed the Company in August 2021, including the incurrence of material Canadian federal income tax (including material “emigration tax”);the Company’s ability to establish and maintain an effective system of internal control over financial reporting, including the risk that the Company’s internal controls will fail to detect misstatements in its financial statements;the Company’s ability to accurately forecast its future financial performance and provide accurate guidance;the Company’s ability to protect client data from security incidents or cyberattacks;economic disruptions resulting from war and other geopolitical tensions (such as the ongoing military conflicts between Russia and Ukraine and in the Middle East), terrorist activities, natural disasters, and public health events;stock price volatility; andforeign currency fluctuations.
Investors should carefully consider these risk factors, other risk factors described herein, and the additional risk factors outlined in more detail in our 2023 Form 10-K, filed with the Securities and Exchange Commission (the “SEC”) on March 11, 2024, and accessible on the SEC’s website at www.sec.gov, under the caption “Risk Factors,” and in the Company’s other SEC filings.
SCHEDULE 1
STAGWELL INC.
UNAUDITED CONSOLIDATED STATEMENTS OF OPERATIONS
(amounts in thousands, except per share amounts)
Three Months Ended
December 31,
Year Ended
December 31,
2024
2023
2024
2023
Revenue
$ 788,708
$ 654,895
$ 2,841,216
$ 2,527,177
Operating Expenses
Cost of services
502,522
419,865
1,842,978
1,621,174
Office and general expenses
203,887
179,871
711,803
661,250
Depreciation and amortization
38,771
35,036
151,652
142,831
Impairment and other losses
—
833
1,715
11,395
745,180
635,605
2,708,148
2,436,650
Operating Income
43,528
19,290
133,068
90,527
Other income (expenses):
Interest expense, net
(24,038)
(22,889)
(92,317)
(90,644)
Foreign exchange, net
645
(672)
(1,656)
(2,960)
Gain on sale of business
—
94,505
—
94,505
Other, net
(547)
108
(1,372)
(359)
(23,940)
71,052
(95,345)
542
Income before income taxes and equity in earnings of non-consolidated affiliates
19,588
90,342
37,723
91,069
Income tax expense
3,741
35,560
13,182
40,557
Income before equity in earnings of non-consolidated affiliates
15,847
54,782
24,541
50,512
Equity in income (loss) of non-consolidated affiliates
—
(8,423)
503
(8,870)
Net income
15,847
46,359
25,044
41,642
Net income attributable to noncontrolling and redeemable noncontrolling interests
(12,612)
(45,073)
(22,785)
(41,508)
Net income attributable to Stagwell Inc. common shareholders
$ 3,235
$ 1,286
$ 2,259
$ 134
Earnings Per Common Share:
Basic
$ 0.03
$ 0.01
$ 0.02
$ —
Diluted
$ 0.03
$ —
$ 0.02
$ —
Weighted Average Number of Common Shares Outstanding:
Basic
109,266
112,769
110,890
117,259
Diluted
115,147
119,621
115,752
122,170
SCHEDULE 2
STAGWELL INC.
UNAUDITED COMPONENTS OF NET REVENUE CHANGE
(amounts in thousands)
Net Revenue – Components of Change
Change
Three Months
Ended
December 31,
2023
Foreign
Currency
Net
Acquisitions
(Divestitures)
Organic
Total Change
Three Months
Ended
December 31,
2024
Organic
Total
Integrated Agencies Network
$ 302,137
$ 25
$ 4,800
$ 27,405
$ 32,230
$ 334,367
9.1 %
10.7 %
Brand Performance Network
168,519
75
—
6,046
6,121
174,640
3.6 %
3.6 %
Communications Network
68,229
42
15,757
23,666
39,465
107,694
34.7 %
57.8 %
All Other
12,181
(161)
2,950
(2,048)
741
12,922
(16.8) %
6.1 %
$ 551,066
$ (19)
$ 23,507
$ 55,069
$ 78,557
$ 629,623
10.0 %
14.3 %
Net Revenue – Components of Change
Change
Year Ended
December 31,
2023
Foreign
Currency
Net
Acquisitions
(Divestitures)
Organic
Total Change
Year Ended
December 31,
2024
Organic
Total
Integrated Agencies Network
$ 1,232,798
$ 226
$ 7,208
$ 32,521
$ 39,955
$ 1,272,753
2.6 %
3.2 %
Brand Performance Network
627,810
2,220
2,252
18,948
$ 23,420
651,230
3.0 %
3.7 %
Communications Network
245,261
(28)
22,177
$ 66,385
$ 88,534
333,795
27.1 %
36.1 %
All Other
46,585
(984)
(609)
(6,108)
(7,701)
38,884
(13.1) %
(16.5) %
$ 2,152,454
$ 1,434
$ 31,028
$ 111,746
$ 144,208
$ 2,296,662
5.2 %
6.7 %
(1) See Non-GAAP Financial Measures section above for the definition of Adjusted EBITDA and Other items, net.
Note: The Company made changes to its internal management and reporting structure in the first quarter of 2024, resulting in a change to its reportable segments (Networks). Specifically, certain agencies previously within the Brand Performance Network are now in the Integrated Agencies Network. Periods presented prior to the first quarter of 2024 have been recast to reflect the reclassification of certain reporting units (Brands) between operating segments.
SCHEDULE 3
STAGWELL INC.
UNAUDITED SEGMENT OPERATING RESULTS
(amounts in thousands)
For the Three Months Ended December 31, 2024
Integrated
Agencies
Network
Brand
Performance
Network
Communications
Network
All Other
Corporate
Total
Net Revenue
$ 334,367
$ 174,640
$ 107,694
$ 12,922
$ —
$ 629,623
Billable costs
73,558
13,688
72,150
(311)
—
159,085
Revenue
407,925
188,328
179,844
12,611
—
788,708
Billable costs
73,558
13,688
72,150
(311)
—
159,085
Staff costs
212,062
100,890
54,590
10,364
12,315
390,221
Administrative costs
32,857
23,959
10,940
2,692
5,006
75,454
Unbillable and other costs, net
16,455
19,224
965
4,105
—
40,749
Adjusted EBITDA (1)
72,993
30,567
41,199
(4,239)
(17,321)
123,199
Stock-based compensation
2,083
1,989
643
175
8,345
13,235
Depreciation and amortization
19,345
8,071
5,119
2,780
3,456
38,771
Deferred acquisition consideration
7,600
(1,290)
9,673
(938)
—
15,045
Other items, net (1)
7,388
3,173
1,146
185
728
12,620
Operating income (loss)
$ 36,577
$ 18,624
$ 24,618
$ (6,441)
$ (29,850)
$ 43,528
(1) See Non-GAAP Financial Measures section above for the definition of Adjusted EBITDA and Other items, net.
SCHEDULE 4
STAGWELL INC.
UNAUDITED SEGMENT OPERATING RESULTS
(amounts in thousands)
For the Year Ended December 31, 2024
Integrated
Agencies
Network
Brand
Performance
Network
Communications
Network
All Other
Corporate
Total
Net Revenue
$ 1,272,753
$ 651,230
$ 333,795
$ 38,884
$ —
$ 2,296,662
Billable costs
262,692
100,654
181,345
(137)
—
544,554
Revenue
1,535,445
751,884
515,140
38,747
—
2,841,216
Billable costs
262,692
100,654
181,345
(137)
—
544,554
Staff costs
792,041
397,301
177,629
34,999
47,736
1,449,706
Administrative costs
128,954
93,155
37,057
6,139
16,402
281,707
Unbillable and other costs, net
72,756
65,901
2,235
13,570
—
154,462
Adjusted EBITDA (1)
279,002
94,873
116,874
(15,824)
(64,138)
410,787
Stock-based compensation
27,253
6,977
3,374
904
13,653
52,161
Depreciation and amortization
78,076
34,595
14,126
12,718
12,137
151,652
Deferred acquisition consideration
13,290
(7,744)
18,770
(1,321)
—
22,995
Impairment and other losses
1,500
—
—
—
215
1,715
Other items, net (1)
20,592
19,536
3,250
887
4,931
49,196
Operating income (loss)
$ 138,291
$ 41,509
$ 77,354
$ (29,012)
$ (95,074)
$ 133,068
(1) See Non-GAAP Financial Measures section above for the definition of Adjusted EBITDA and Other items, net.
SCHEDULE 5
STAGWELL INC.
UNAUDITED SEGMENT OPERATING RESULTS
(amounts in thousands)
For the Three Months Ended December 31, 2023
Integrated
Agencies
Network
Brand
Performance
Network
Communications
Network
All Other
Corporate
Total
Net Revenue
$ 302,137
$ 168,519
$ 68,229
$ 12,181
$ —
$ 551,066
Billable costs
51,665
16,921
35,217
26
—
103,829
Revenue
353,802
185,440
103,446
12,207
—
654,895
Billable costs
51,665
16,921
35,217
26
—
103,829
Staff costs
195,953
97,871
43,319
6,292
11,088
354,523
Administrative costs
29,618
23,174
8,568
3,445
(1,871)
62,934
Unbillable and other costs, net
18,111
17,357
277
2,885
—
38,630
Adjusted EBITDA (1)
58,456
30,117
16,065
(441)
(9,217)
94,980
Stock-based compensation
12,015
2,364
1,157
91
6,937
22,564
Depreciation and amortization
19,680
8,090
2,800
2,238
2,228
35,036
Deferred acquisition consideration
3,813
1,739
(3,373)
—
—
2,179
Impairment and other losses
737
96
—
—
—
833
Other items, net (1)
6,403
3,713
198
95
4,669
15,078
Operating income (loss)
$ 15,808
$ 14,115
$ 15,283
$ (2,865)
$ (23,051)
$ 19,290
(1) See Non-GAAP Financial Measures section above for the definition of Adjusted EBITDA and Other items.
Note: The Company made changes to its internal management and reporting structure in the first quarter of 2024, resulting in a change to its reportable segments (Networks). Specifically, certain agencies previously within the Brand Performance Network are now in the Integrated Agencies Network. Periods presented prior to the first quarter of 2024 have been recast to reflect the reclassification of certain reporting units (Brands) between operating segments.
SCHEDULE 6
STAGWELL INC.
UNAUDITED SEGMENT OPERATING RESULTS
(amounts in thousands)
For the Year Ended December 31, 2023
Integrated
Agencies
Network
Brand
Performance
Network
Communications
Network
All Other
Corporate
Total
Net Revenue
$ 1,232,798
$ 627,810
$ 245,261
$ 46,585
$ —
$ 2,152,454
Billable costs
185,913
100,364
88,446
—
—
374,723
Revenue
1,418,711
728,174
333,707
46,585
—
2,527,177
Billable costs
185,913
100,364
88,446
—
—
374,723
Staff costs
768,846
386,803
159,165
37,416
36,938
1,389,168
Administrative costs
122,618
87,337
33,664
4,689
11,472
259,780
Unbillable and other costs, net
71,776
55,891
613
15,087
—
143,367
Adjusted EBITDA (1)
269,558
97,779
51,819
(10,607)
(48,410)
360,139
Stock-based compensation
27,485
6,204
3,334
518
19,638
57,179
Depreciation and amortization
81,957
33,250
11,016
8,390
8,218
142,831
Deferred acquisition consideration
11,931
2,851
30
(1,752)
—
13,060
Impairment and other losses
11,299
96
—
—
—
11,395
Other items, net (1)
20,225
12,206
1,535
1,174
10,007
45,147
Operating income (loss)
$ 116,661
$ 43,172
$ 35,904
$ (18,937)
$ (86,273)
$ 90,527
(1) See Non-GAAP Financial Measures section above for the definition of Adjusted EBITDA and Other items, net.
Note: The Company made changes to its internal management and reporting structure in the first quarter of 2024, resulting in a change to its reportable segments (Networks). Specifically, certain agencies previously within the Brand Performance Network are now in the Integrated Agencies Network. Periods presented prior to the first quarter of 2024 have been recast to reflect the reclassification of certain reporting units (Brands) between operating segments.
SCHEDULE 7
STAGWELL INC.
UNAUDITED RECONCILIATION OF ADJUSTED DILUTED EARNINGS PER SHARE (NON-GAAP MEASURE)
(amounts in thousands, except per share amounts)
For the Three Months Ended December 31, 2024
GAAP
Adjustments
Non-GAAP
Net income attributable to Stagwell Inc. common shareholders
$ 3,235
$ 22,226
$ 25,461
Net income attributable to Class C shareholders
—
40,500
40,500
Net income attributable to Stagwell Inc. and Class C shareholders and adjusted net income
$ 3,235
$ 62,726
$ 65,961
Weighted average number of common shares outstanding
115,147
2,567
117,714
Weighted average number of common Class C shares outstanding
—
151,649
151,649
Weighted average number of shares outstanding
115,147
154,216
269,363
Diluted EPS and Adjusted Diluted EPS (1)
$ 0.03
$ 0.24
Adjustments to Net income
Amortization
$ 30,572
Stock-based compensation
13,235
Deferred acquisition consideration
15,045
Other items, net
12,620
71,472
Adjusted tax expense
(20,040)
51,432
Net income attributable to Class C shareholders
11,294
$ 62,726
Allocation of adjustments to Net income
Net income attributable to Stagwell Inc. common shareholders – add-backs
$ 22,226
Net income attributable to Class C shareholders – add-backs
29,206
Net income attributable to Class C shareholders
11,294
40,500
$ 62,726
(1) Adjusted Diluted EPS is defined within the Non-GAAP Financial Measures section of the Executive Summary.
SCHEDULE 8
STAGWELL INC.
UNAUDITED RECONCILIATION OF ADJUSTED DILUTED EARNINGS PER SHARE (NON-GAAP MEASURE)
(amounts in thousands, except per share amounts)
For the Year Ended December 31, 2024
GAAP
Adjustments
Non-GAAP
Net income attributable to Stagwell Inc. common shareholders
$ 2,259
$ 80,403
$ 82,662
Net income attributable to Class C shareholders
—
123,942
123,942
Net income attributable to Stagwell Inc. and Class C and adjusted net income
$ 2,259
$ 204,345
$ 206,604
Weighted average number of common shares outstanding
115,752
2,234
117,986
Weighted average number of common Class C shares outstanding
—
151,649
151,649
Weighted average number of shares outstanding
115,752
153,883
269,635
Diluted EPS and Adjusted Diluted EPS (1)
$ 0.02
$ 0.77
Adjustments to Net Income
Amortization
$ 122,442
Impairment and other losses
1,715
Stock-based compensation
52,161
Deferred acquisition consideration
22,995
Other items, net
49,196
248,509
Adjusted tax expense
(61,308)
187,201
Net income attributable to Class C shareholders
17,144
$ 204,345
Allocation of adjustments to Net income
Net income attributable to Stagwell Inc. common shareholders – add-backs
$ 80,403
Net income attributable to Class C shareholders – add-backs
106,798
Net income attributable to Class C shareholders
17,144
123,942
$ 204,345
(1) Adjusted Diluted EPS is defined within the Non-GAAP Financial Measures section of the Executive Summary.
SCHEDULE 9
STAGWELL INC.
UNAUDITED RECONCILIATION OF ADJUSTED DILUTED EARNINGS PER SHARE (NON-GAAP MEASURE)
(amounts in thousands, except per share amounts)
For the Three Months Ended December 31, 2023
GAAP
Adjustments
Non-GAAP
Net income (loss) attributable to Stagwell Inc. common shareholders
$ 127
$ (4,705)
$ (4,578)
Net income attributable to Class C shareholders
—
35,780
35,780
Net income attributable to Stagwell Inc. and Class C and adjusted net income
$ 127
$ 31,075
$ 31,202
Weighted average number of common shares outstanding
119,621
—
119,621
Weighted average number of common Class C shares outstanding
—
151,649
151,649
Weighted average number of shares outstanding
119,621
151,649
271,270
Diluted EPS and Adjusted Diluted EPS (1)
$ —
$ 0.12
Adjustments to Net income (loss)
Amortization
$ 27,231
Impairment and other losses
833
Stock-based compensation
22,564
Deferred acquisition consideration
3,338
Gain on sale of business
(94,505)
Other items, net
15,078
(25,461)
Adjusted tax expense
14,768
(10,693)
Net income attributable to Class C shareholders
41,768
$ 31,075
Allocation of adjustments to Net income (loss)
Net loss attributable to Stagwell Inc. common shareholders – add-backs
$ (4,705)
Net loss attributable to Class C shareholders – add-backs
(5,988)
Net income attributable to Class C shareholders
41,768
35,780
$ 31,075
(1) Adjusted Diluted EPS is defined within the Non-GAAP Financial Measures section of the Executive Summary.
SCHEDULE 10
STAGWELL INC.
UNAUDITED RECONCILIATION OF ADJUSTED DILUTED EARNINGS PER SHARE (NON-GAAP MEASURE)
(amounts in thousands, except per share amounts)
For the Year Ended December 31, 2023
GAAP
Adjustments
Non-GAAP
Net income attributable to Stagwell Inc. common shareholders
$ 134
$ 52,712
$ 52,846
Net income attributable to Class C shareholders
—
106,153
106,153
Net income attributable to Stagwell Inc. and Class C and adjusted net income
$ 134
$ 158,865
$ 158,999
Weighted average number of common shares outstanding
122,170
3,628
125,798
Weighted average number of common Class C shares outstanding
—
154,972
154,972
Weighted average number of shares outstanding
122,170
158,600
280,770
Diluted EPS and Adjusted Diluted EPS (1)
$ —
$ 0.57
Adjustments to Net income
Amortization
$ 113,835
Impairment and other losses
11,395
Stock-based compensation
57,179
Deferred acquisition consideration
13,060
Gain on sale of business
(94,505)
Other items, net
45,147
146,111
Adjusted tax expense
(26,312)
119,799
Net income attributable to Class C shareholders
39,066
$ 158,865
Allocation of adjustments to Net income
Net income attributable to Stagwell Inc. common shareholders
$ 52,712
Net income to attributable to Class C shareholders – add-backs
67,087
Net income attributable to Class C shareholders
39,066
106,153
$ 158,865
(1) Adjusted Diluted EPS is defined within the Non-GAAP Financial Measures section of the Executive Summary.
SCHEDULE 11
STAGWELL INC.
UNAUDITED CONSOLIDATED BALANCE SHEETS
(amounts in thousands)
December 31, 2024
December 31, 2023
ASSETS
Current Assets
Cash and cash equivalents
$ 131,339
$ 119,737
Accounts receivable, net
716,415
697,178
Expenditures billable to clients
173,194
114,097
Other current assets
114,200
94,054
Total Current Assets
1,135,148
1,025,066
Fixed assets, net
72,706
77,825
Right-of-use assets – operating leases
219,400
254,278
Goodwill
1,554,146
1,498,815
Other intangible assets, net
836,783
818,220
Other assets
90,038
92,843
Total Assets
$ 3,908,221
$ 3,767,047
LIABILITIES, REDEEMABLE NONCONTROLLING INTERESTS (“RNCI”), AND SHAREHOLDERS’ EQUITY
Current Liabilities
Accounts payable
$ 449,347
$ 414,980
Accrued media
245,883
291,777
Accruals and other liabilities
265,356
233,046
Advance billings
294,609
301,674
Current portion of lease liabilities – operating leases
60,195
65,899
Current portion of deferred acquisition consideration
51,906
66,953
Total Current Liabilities
1,367,296
1,374,329
Long-term debt
1,353,624
1,145,828
Long-term portion of deferred acquisition consideration
50,209
34,105
Long-term lease liabilities – operating leases
245,397
281,307
Deferred tax liabilities, net
47,239
40,509
Other liabilities
59,139
54,905
Total Liabilities
3,122,904
2,930,983
Redeemable Noncontrolling Interests
8,412
10,792
Commitments, Contingencies and Guarantees
Shareholders’ Equity
Common shares – Class A & B
115
118
Common shares – Class C
2
2
Paid-in capital
343,647
348,494
Retained earnings
11,740
21,148
Accumulated other comprehensive loss
(23,773)
(13,067)
Stagwell Inc. Shareholders’ Equity
331,731
356,695
Noncontrolling interests
445,174
468,577
Total Shareholders’ Equity
776,905
825,272
Total Liabilities, Redeemable Noncontrolling Interests and Shareholders’ Equity
$ 3,908,221
$ 3,767,047
SCHEDULE 12
STAGWELL INC.
UNAUDITED SUMMARY CASH FLOW DATA
(amounts in thousands)
Year Ended December 31,
2024
2023
Cash flows from operating activities:
Net income
$ 25,044
$ 41,642
Adjustments to reconcile net income to cash provided by operating activities:
Stock-based compensation
52,161
57,179
Depreciation and amortization
151,652
142,831
Amortization of right-of-use lease assets and lease liability interest
75,117
76,653
Impairment and other losses
1,715
11,395
Deferred income taxes
(10,686)
19,443
Adjustment to deferred acquisition consideration
23,005
13,060
Gain on sale of business
—
(94,505)
Other, net
7,622
8,313
Changes in working capital:
Accounts receivable
8,465
(58,704)
Expenditures billable to clients
(54,350)
(21,477)
Other assets
(6,200)
1,153
Accounts payable
24,438
52,837
Accrued expenses and other liabilities
(28,658)
(24,647)
Advance billings
(22,651)
(41,137)
Current portion of lease liabilities – operating leases
(83,905)
(87,629)
Deferred acquisition related payments
(19,910)
(15,400)
Net cash provided by operating activities
142,859
81,007
Cash flows from investing activities:
Capital expenditures
(18,912)
(14,238)
Acquisitions, net of cash acquired
(103,254)
(23,339)
Capitalized software
(35,094)
(28,175)
Proceeds from sale of business, net
—
229,484
Other
(5,212)
(7,781)
Net cash (used in) provided by investing activities
(162,472)
155,951
Cash flows from financing activities:
Repayment of borrowings under revolving credit facility
(1,755,000)
(1,986,500)
Proceeds from borrowings under revolving credit facility
1,960,000
1,945,500
Shares repurchased and cancelled
(108,249)
(223,835)
Distributions to noncontrolling interests
(26,723)
(24,964)
Payment of deferred consideration
(29,774)
(49,221)
Purchase of noncontrolling interest
(3,316)
—
Debt issuance costs
—
(844)
Net cash provided by (used in) financing activities
36,938
(339,864)
Effect of exchange rate changes on cash and cash equivalents
(5,723)
2,054
Net increase (decrease) in cash and cash equivalents
11,602
(100,852)
Cash and cash equivalents at beginning of period
119,737
220,589
Cash and cash equivalents at end of period
$ 131,339
$ 119,737
View original content to download multimedia:https://www.prnewswire.com/news-releases/stagwell-inc-nasdaq-stgw-reports-results-for-the-three-and-twelve-months-ended-december-31-2024-302387320.html
SOURCE Stagwell Inc.

You may like
Technology
AI-Powered Connectivity: APAC Charts a Path to a Smarter Digital Future
Published
2 hours agoon
July 18, 2026By

Asia-Pacific’s first Broadband Development Summit brings regulators and operators to Bangkok to set the agenda
BANGKOK, July 19, 2026 /PRNewswire/ — Government officials, standards bodies and telecom operators gathered in Bangkok on 14 July for the inaugural Broadband Development Summit APAC 2026, convened by the World Broadband Association (WBBA) to build consensus on AI-era networks.
Participants included the ITU, Thailand’s National Board of the Digital Economy and Society, WBBA, IAB, FNCAP, WAA, NIDA and the IPv6 Council, alongside operators Telkomsel, XLSmart, Surge, Globe, AIS, CMI and HKT and Huawei.
Denny Deng, President of Huawei Asia Pacific Carrier Business, envisions a “faster, smarter, greener” Asia-Pacific.
VOICES FROM THE SUMMIT
“To seize the opportunities of the AI era, we call on the industry to accelerate broadband evolution, advance computing-network synergy, and strengthen the cross-border connectivity. Together, let us build faster, smarter, and greener digital infrastructure for Asia-Pacific.”
— Denny Deng, President of Asia Pacific Carrier Business, Huawei
“High-speed broadband is no longer just about ‘getting online’ — it is the vital infrastructure upon which the entire AI revolution is being built. We view AI not merely as a tool, but as a primary engine for national competitiveness and a catalyst for improving the quality of life for all.”
— Wetang Phuangsup, Ph.D., Secretary-General, the National Board of the Digital Economy and Society, Thailand
“Three initiatives define the road to 2030. We must close the quality divide so the value of broadband reaches everyone. We must build AI-ready networks — 10G access, 800GE cores, intelligence end to end. And we must do it together, through shared standards.”
— Martin Creaner, Director General of WBBA
“Moving towards next-generation networks, network architectures must continue to evolve to deliver broader connectivity, superior quality, enhanced security, and greater intelligence. This evolution is essential for Net5.5G, positioning the network not simply as infrastructure, but as the foundation that enables AI, strengthens resilience and efficiency, and supports digital transformation across industries.”
— Dhruv Dhody, Industry Standardization Expert at Huawei, Chair of the IAB, IETF
“Across Asia-Pacific, fibre is extending beyond homes and offices into rooms, devices, and machines. By working together, we can accelerate fibre innovation and adoption to build truly AI-ready infrastructure.”
— Ilham Nandana, Chair of the Market Intelligence Committee, Fiber Network Council APAC (FNCAP)
“We fixed it before you feel it! AIS is redefining premium home broadband by combining ultra-fast connectivity with AI-driven network intelligence and smart home ecosystem — delivering proactive, invisible service excellence that transforms connectivity into differentiated customer value and sustainable ARPU growth.”
— Thanit Chaiyaboonthanit, Head of Technology Department, Broadband Business, AIS
“Connecting the Unconnected: Affordable Broadband at Scale. Create equal access to global information and empower Indonesia’s digital society.”
— Shannedy Ong, CTO of Surge Indonesia
“Beyond Connectivity: Telkomsel is transforming into a true value creator. By leveraging our FBB market-leading footprint, we power growth through service excellence, customer loyalty, and a next-generation home ecosystem.”
— Stanislaus Susatyo, Director of Sales, Telkomsel Indonesia
“We stopped treating AI as an add-on feature. Instead, our approach at Globe starts with architecture, embedding intelligence into the very core of how we build, how we sell, and how we operate.
AI continuously monitors network health, customer behavior and service quality. Rather than waiting for failures, the system predicts degradation and initiates corrective actions. By maintaining minute-level awareness of network health, our systems automatically resolve 30% of all Wi-Fi issues without any human intervention.”
— Danny Theseira, Head of Broadband Business Group at Globe Telecom
“Huawei is driving the Optics-AI Synergy to foster their collaborative growth. Through AI-ON, operators could build an AI-centric all-optical target network and establish 1-5-20ms latency circles across the Asia Pacific region. AI-ON also supports efficient computing access and usage while delivering an ultimate network experience through gigabit/ultra-gigabit home broadband, accelerating the widespread adoption of AI services.”
— Kim Jin, Vice President & Chief Marketing Officer Optical Business Product Line, Huawei
“Connectivity is not just about technology. It is a lifeline, a platform for opportunity, and a driver of sustainable development. I believe the intersection of connectivity and artificial intelligence will shape the future of smarter, more resilient networks.”
— Dr. Cosmas Zavazava, Director of the Telecommunication Development Bureau, ITU
“Performance and user experience are the essential path to the next-generation WLAN. Based on standards and AI-driven innovation, let’s jointly explore the path to the future autonomous WLAN with all the stakeholders.”
— Dr. Crane H. Yang, Secretary-General, World WLAN Application Alliance (WAA)
“At the summit, NIDA and WBBA signed an MOU to accelerate next-generation network evolution and establish pioneering smart city benchmarks through the co-development of industry standards, the harmonization of global regulations, and the sharing of vertical industry insights.
NIDA focuses on advancing network architecture standards, while WBBA drives global consensus on broadband evolution. This natural strategic complementarity creates vast opportunities for future collaboration.”
— Joey Deng, Secretary-General of NIDA
“ION-2030 develops the global standard for next generation optical networks in the AI era. It provides exceptional AI application and service experience. The WBBA and ITU will jointly accelerate its development, and this is a unique opportunity for Asia-Pacific stakeholders to actively influence the future of optical broadband networks.”
— Dr. Marcus Brunner, Chief Expert Standardization, WBBA WG1 Chair and Vice-Chair of ETSI ISG F5G
“The transition into the AI era demands a high-quality, deterministic digital foundation. By releasing Net5.5G policy guidelines, Malaysia is accelerating the evolution of next-generation network standards based on IPv6, establishing an innovative infrastructure to unleash AI’s value and drive a prosperous digital economy for 2030.”
— Prof. Sureswaran Ramadass, Chair of APAC at IPv6 Council, Industry Partner of WBBA
“The digital economy is thriving across the Asia-Pacific region, with AI emerging as a core catalyst for intelligent transformation. China Mobile International (CMI) is driving regional growth by integrating China’s advanced AI capabilities with comprehensive communications, computing, and AI services. Moving forward, CMI will collaborate closely with industry partners to foster a shared, AI-driven future for the region.”
— Paul Lin, Managing Director of Commercial and Technology, Asia Pacific, China Mobile International
“Next-generation network infrastructure is the oxygen of the intelligent economy. By integrating cutting-edge 800G connectivity with quantum-safe security, HKT is laying the essential foundations to keep Hong Kong’s enterprises highly competitive, secure, and ready for the computing paradigm shifts of tomorrow.”
— Wilson Cheung, Vice President, Broadband Design & Cyber Security, HKT
“The evolution toward Net5.5G AI WAN is an important step in strengthening XLSMART’s transport network for the future. By progressively adopting AI-assisted operations, SRv6, SDN, service differentiation, and higher-capacity transport infrastructure, we are enhancing network intelligence, operational efficiency, and service resilience while supporting long-term sustainability. This transformation is a continuous journey that aligns with the industry’s vision of AI-native broadband networks. Through collaboration with our technology partners and the broader ecosystem, we will continue to develop capabilities that deliver better network performance and support Indonesia’s growing digital connectivity needs.”
— Regie Ginanjar, Head of Transport Autonomy & Orchestration, Transport Network Transformation, XLSMART
“For the AI era, Huawei upgrades the IP bearer network via security resilience, multi-dimensional awareness, and network autonomy. This empowers carriers to guarantee service experience, accelerate monetization, and enhance efficiency, ushering in a new chapter of intelligent connectivity.”
— Arthur Wang, Vice President of Data Communication Product Line, Huawei
A CONVERGING VIEW
Speakers agreed AI is shifting networks from connectivity to intelligent connectivity, as broadband, IP, computing and cross-border infrastructure converge to support innovation and coordination.
WBBA launched the AI-Net Certification, a global benchmark for national policy, industrial ecosystems and network intelligence. XLSmart was named first AI-Net Champion, and Indonesia was among the first with a certified operator, backed by its Net5.5G roadmap.
In another high-profile segment, WBBA Director General Martin Creaner presented the Gigacity Certification to KOMDIGI, SURGE, Telkomsel, AIS, TRUE, HKT and Globe, recognizing regional broadband pioneers.
View original content to download multimedia:https://www.prnewswire.com/apac/news-releases/ai-powered-connectivity-apac-charts-a-path-to-a-smarter-digital-future-302829032.html
SOURCE HUAWEI
Technology
Laifen Expands U.S. Retail Footprint with Costco Launch of Best-Selling SE Hair Dryer
Published
3 hours agoon
July 18, 2026By

Starting July 18, Costco Members Can Shop Laifen’s Award-Winning Hair Dryer in Select Warehouse Locations Across the U.S.
NEW YORK, July 18, 2026 /PRNewswire/ — Laifen, ranked the world’s No.1 high-speed hair dryer brand, today announced the launch of its best-selling SE High-Speed Hair Dryer at select Costco warehouse locations, marking the brand’s largest U.S. retail expansion to date and bringing its award-winning haircare technology to Costco members across select U.S. markets.
The launch brings Laifen’s award-winning haircare technology to Costco, making it easier for consumers to experience the brand through one of the nation’s leading membership retailers. Laifen joins Costco’s growing portfolio of premium beauty and personal care brands. The initial rollout includes select Costco warehouse locations across the United States, with a strong presence across the Western U.S., including California, the Pacific Northwest and the Southwest.
Costco’s reputation for quality and its highly selective merchandising approach make this partnership especially meaningful. The Costco launch reflects Laifen’s continued expansion beyond direct-to-consumer channels as the brand accelerates its U.S. omnichannel retail strategy. “Costco represents an important milestone in our U.S. retail strategy,” said Romeo, General Manager of International Business of Laifen. “As more consumers seek salon-quality performance at an accessible price, we’re excited to make Laifen available through one of America’s most trusted retailers.”
Engineered to deliver professional-level performance in a sleek, lightweight design, the Laifen SE is powered by the brand’s proprietary high-speed brushless motor, delivering fast drying, reduced heat damage and smoother styling. An intelligent temperature control system continuously monitors airflow to help minimize frizz while protecting hair from excessive heat.
The Costco launch represents the next phase of Laifen’s U.S. retail expansion as the brand continues to grow beyond its direct-to-consumer and online channels. By expanding into one of the nation’s most trusted retailers, Laifen aims to broaden access to its category-disrupting haircare solutions while advancing its mission to bring more thoughtful design and everyday excellence into more homes.
The Laifen SE High-Speed Hair Dryer in White will be available at select Costco locations, while Costco.com shoppers will have access to additional color options including Purple and Pink, alongside the White model.
For more information on Laifen, please visit LaifenTech.com.
About Laifen:
Founded in 2019, Laifen is a global personal care technology brand combining high-performance engineering with modern design across hair care, oral care, and grooming categories. Ranked the world’s No. 1 high-speed hair dryer brand by Euromonitor International, Laifen first gained recognition for its self-developed 110,000 RPM high-speed brushless motor, the proprietary technology behind its award-winning hair dryers.
Building on this innovation, Laifen has expanded its portfolio to include electric toothbrushes and shavers, delivering premium technology and elevated everyday experiences to consumers worldwide. Today, Laifen products and accessories are used by over 22 million households across more than 60 countries, supported by more than 600 patents and recognized with over 50 international design and innovation awards. Driven by continuous technological breakthroughs, Laifen is committed to making cutting-edge personal care technology more accessible to consumers around the world.
View original content to download multimedia:https://www.prnewswire.com/news-releases/laifen-expands-us-retail-footprint-with-costco-launch-of-best-selling-se-hair-dryer-302828573.html
SOURCE Laifen
NEW YORK, July 18, 2026 /PRNewswire/ — Pillsbury Winthrop Shaw Pittman LLP (“Pillsbury”) was among many law firms targeted by sophisticated social engineering attempts in an incident last year. While the firm quickly detected and blocked the activity, an unauthorized actor was able to access some of the firm’s documents during a short window of time. Pillsbury notified any impacted clients last year and undertook a detailed process to review the accessed documents for personal information. Pillsbury then began notifying individuals whose personal information was affected. That process is now complete, and today, Pillsbury is publishing substitute notice as a final step.
For more information, please visit the substitute notice on our website at https://www.pillsburylaw.com/en/breach-notice.html.
View original content to download multimedia:https://www.prnewswire.com/news-releases/pillsbury-notice-of-data-breach-302828892.html
SOURCE Pillsbury Winthrop Shaw Pittman LLP


AI-Powered Connectivity: APAC Charts a Path to a Smarter Digital Future

Laifen Expands U.S. Retail Footprint with Costco Launch of Best-Selling SE Hair Dryer
Pillsbury Notice of Data Breach
Send Rakhi to UK swiftly with UK Gifts Portal

Whiteboard Series with NEAR | Ep: 45 Joel Thorstensson from ceramic.network

New Gooseneck Omni Antennas Offer Enhanced Signals in a Durable Package

Why You Should Build on #NEAR – Co-founder Illia Polosukhin at CV Labs
Whiteboard Series with NEAR | Ep: 45 Joel Thorstensson from ceramic.network

NEAR End of Year Town Hall 2021: The Open Web World, MetaBUILD 2 Hackathon and 2021 recap
Trending
-

 Coin Market3 days ago
Revolut receives in-principle approval from UAE authorities for crypto services
-

 Technology3 days ago
GPU.ai Named Official Title Sponsor of AGI Summit SF 2026
-

 Near Videos4 days ago
Confidential Intents is now generally available
-

 Technology3 days ago
InventHelp Inventor Develops Improved Food Delivery Bag (LBT-9719)
-

 Coin Market3 days ago
Ostium pauses trading as security firms report multimillion-dollar oracle exploit
-

 Coin Market3 days ago
Crypto firms face AML risks during post-MiCA migration, says AMLA chair
-

 Near Videos3 days ago
The best AI agents need your most sensitive data
-

 Technology3 days ago
Club Offers for Travel Enthusiasts in Germany