
Coin Market
Bitcoin is signaling a golden cross — What does it mean for BTC price?


Technology7 minutes ago
Threekit Launches AI Sales Agent for Manufacturers

Technology7 minutes ago
CENTEGIX Launches The Safety Signal Podcast, Where Crisis Meets Connection
Technology7 minutes ago
ICON International Launches Content and Entertainment Solution, Establishing New Pathways for Brand-Funded Film and Television
Technology2 years ago
Send Rakhi to UK swiftly with UK Gifts Portal

Near Videos4 years ago
Whiteboard Series with NEAR | Ep: 45 Joel Thorstensson from ceramic.network

Technology2 years ago
New Gooseneck Omni Antennas Offer Enhanced Signals in a Durable Package

Near Videos4 years ago
Why You Should Build on #NEAR – Co-founder Illia Polosukhin at CV Labs
Near Videos4 years ago
Whiteboard Series with NEAR | Ep: 45 Joel Thorstensson from ceramic.network

Near Videos4 years ago
NEAR End of Year Town Hall 2021: The Open Web World, MetaBUILD 2 Hackathon and 2021 recap
-

 Technology5 days ago
District Taco Kicks Off The Summer’s Biggest Soccer Event with Free Delivery Offer
-

 Technology5 days ago
VEVOR Launches “Beat the Heat at Home” Summer Comfort Lineup for Outdoor Living
-

 Technology5 days ago
YEEDI Delivers Lowest-Ever Pricing on Self-Cleaning Roller Mop Robot Vacuums With Early Prime Day Deals
-

 Technology4 days ago
Kakunin Announces Cryptographic Compliance Shield for Google Gemini and OpenAI Agent Ecosystems
-

 Coin Market4 days ago
Trump says Iran peace deal to be signed Sunday, contradicting Tehran
-

 Coin Market4 days ago
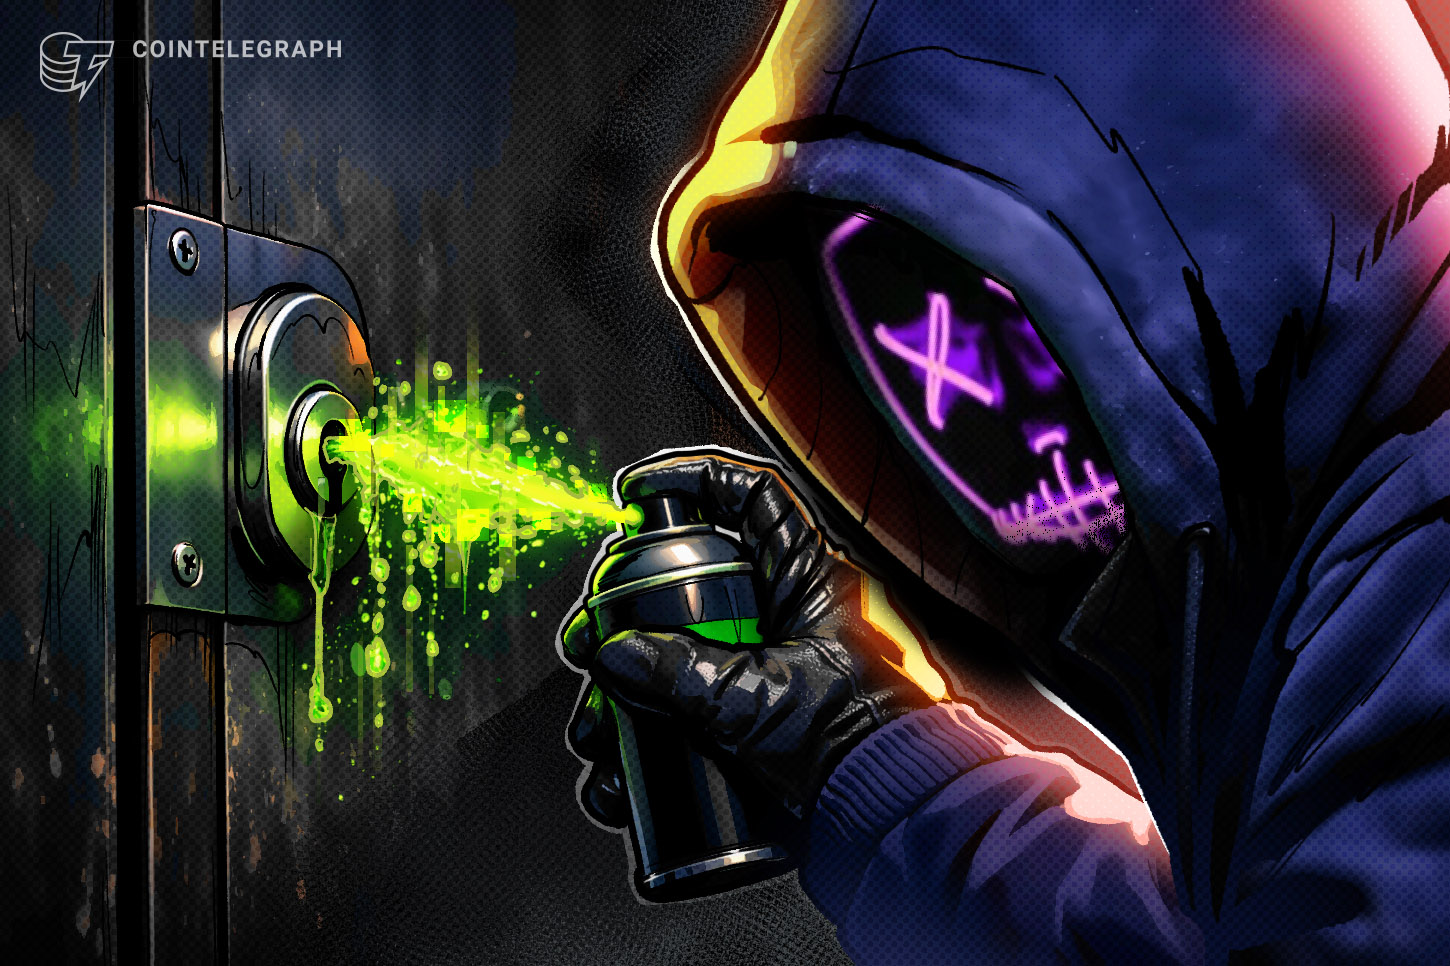
Humanity Protocol’s $36M hack tied to suspected North Korean hackers: Quantstamp
-

 Technology4 days ago
Tradr to Ring Opening Bell at Cboe to Celebrate SpaceX ETF Launches
-
 Technology5 days ago
MGI Tech Showcases Expanding Genomics Ecosystem at ESHG 2026 with New IVD Partnering Program and OEM Collaborations