
Technology
Shutterstock Reports First Quarter 2026 Financial Results

Published
4 months agoon
By

NEW YORK, April 28, 2026 /PRNewswire/ — Shutterstock, Inc. (NYSE: SSTK) (the “Company”), a family of brands delivering scalable creative and GenAI solutions to help customers fuel great work, today announced financial results for the first quarter ended March 31, 2026.
Commenting on the Company’s performance, Paul Hennessy, the Company’s Chief Executive Officer, said, “During the first quarter, we maintained a strong focus on operational discipline and cost management, delivering $43 million in Adjusted EBITDA in the face of ongoing industry headwinds. While first quarter revenue was impacted by a slower start in our Content business than expected and the timing of revenue recognition associated with data licensing deals, we continue to invest in areas that will drive long-term growth and remain committed to simplifying our product offerings to better meet our customers’ needs.”
He continued, “We remain highly confident in the long-term trajectory of our Data Licensing and AI Services division. With a robust pipeline of major opportunities currently in progress, we are making the necessary investments today to expand our commercial execution and position Shutterstock as the premier, go-to provider for end-to-end AI model training data and adjacent services.”
With regards to the pending merger with Getty Images, Mr. Hennessy said, “Like Getty Images, we disagree with the CMA’s most recent assessment and do not believe the merger would substantially lessen competition in Editorial content in the UK. We remain confident in the merits of the merger and will continue working closely with Getty Images and the CMA toward closing.”
MERGER AGREEMENT UPDATE WITH GETTY IMAGES
The Company has been working diligently towards regulator Merger approval.
On February 23, 2026, the Company announced the DOJ had concluded its review of the Merger and the applicable waiting period under the Hart-Scott-Rodino Antitrust (“HSR”) Act had expired, without conditions. As a result, the Merger condition under the HSR Act has been satisfied.On February 19, 2026, the Company announced that the U.K. Competition and Markets Authority (“CMA”) issued its Interim Report and provisionally concluded the Merger is not expected to result in competition issues in the global stock content market, but that the Merger may result in a “substantial lessening of competition” (“SLC”) in the U.K. editorial market; andOn April 16, 2026, the CMA published the summary of its Interim Report on Remedies (“IRR”), following its interim report of February 19, 2026 which provisionally found that the Merger could be expected to lead to an SLC in the supply of editorial content in the U.K. The IRR states that the remedy proposal offered by Getty Images was unlikely to address the provisional SLC it had identified but that a sale of Shutterstock’s Rex Features, Backgrid and Splash News businesses would likely be acceptable. The CMA is now further consulting on that proposition including its view that Rex Features Backgrid and Splash News could be sold to different buyers. The statutory deadline for the CMA to publish its final report is June 14, 2026.
The Company remains committed to the proposed Merger and will continue to engage with the CMA, including on its provisional SLC finding, and work with Getty Images to expeditiously secure the necessary clearances on its Editorial business.
In 2025, global Editorial revenue was $32.7 million, of which $11.7 million related to our Rex Features related content and Shutterstock brands and $21.0 million was from our Backgrid and Splash branded content. In addition, our 2025 Editorial revenue for customers in the U.K. was $10.6 million, of which $5.4 million related to our Rex Features and Shutterstock brands and $5.2 million was from our Backgrid and Splash branded content.
First Quarter 2026 highlights as compared to First Quarter 2025:
Financial Highlights
Revenues were $199.2 million compared to $242.6 million.Net loss was $47.6 million compared to net income of $18.7 million.Net loss per diluted common share was $1.34 compared to net income per diluted common share of $0.53.Adjusted net income was $20.7 million compared to $36.3 million.Adjusted net income per diluted common share was $0.58 compared to $1.03.Adjusted EBITDA was $42.7 million compared to $63.4 million.
FIRST QUARTER RESULTS
Revenue
First quarter revenue of $199.2 million decreased by $43.5 million or 18% as compared to the first quarter of 2025.
Revenue from our Content product offering decreased by $24.8 million, or 12%, as compared to the first quarter of 2025, to $178.1 million. The reduction in our Content revenue was driven primarily by weakness in new customer acquisition. Content revenue represented 89% of our total revenue in the first quarter of 2026.
Revenue generated from our Data, Distribution, and Services product offering decreased by $18.7 million, or 47%, as compared to the first quarter of 2025, to $21.0 million, and represented 11% of first quarter revenue in 2026. Revenue recognition in our data offering may vary from quarter-to-quarter based on the delivery timing of metadata licenses.
Net income and net income per diluted common share
Net income decreased by $66.3 million to a net loss of $47.6 million in the first quarter of 2026, compared to net income of $18.7 million for the first quarter of 2025. Net loss per diluted common share was $1.34, as compared to net income per diluted common share of $0.53 for the same period in 2025. These increased losses were attributable to the decline in revenue with operating costs not declining at a similar rate, $15.3 million of unrealized losses related to our investment in Meitu, Inc, $28.0 million of legal contingency expenses and $6.1 million of workforce optimizations expenses.
Adjusted net income and adjusted net income per diluted common share
Adjusted net income of $20.7 million in the first quarter of 2026 decreased by $15.6 million, compared to adjusted net income of $36.3 million for the first quarter of 2025, primarily due to the decline in revenue.
Adjusted net income per diluted common share was $0.58 as compared to $1.03 for the first quarter of 2025.
Adjusted EBITDA
Adjusted EBITDA of $42.7 million for the first quarter of 2026 decreased by $20.7 million, or 33%, as compared to the first quarter of 2025, primarily due to the decline in revenue.
Net loss margin of 23.9% for the first quarter of 2026 decreased by 31.6%, as compared to net income margin of 7.7% in the first quarter of 2025. The adjusted EBITDA margin of 21.4% for the first quarter of 2026 decreased by 4.7%, as compared to 26.1% in the first quarter of 2025.
FIRST QUARTER LIQUIDITY
Our cash and cash equivalents decreased by $15.7 million to $162.5 million at March 31, 2026, as compared with $178.2 million as of December 31, 2025. This decrease was driven by $17.4 million of net cash provided by our operating activities, partially offset by $20.0 million of net cash used in financing activities and $11.1 million of net cash used in investing activities.
Net cash provided by our operating activities was driven by our operating income and changes in the timing of cash collections from our customers and payments pertaining to operating expenses, offset by payments of year-end bonuses and commissions. In addition, cash flows for the three months ended March 31, 2026 were unfavorably impacted by $7.2 million of expenses related to the Getty Images proposed merger.
Cash used in investing activities for the three months ended March 31, 2026 consisted of $11.8 million related to capital expenditures and content acquisition, partially offset by $0.4 million related to the receipt of the Giphy Retention Compensation, as reimbursed by the Giphy seller.
Cash used in financing activities for the three months ended March 31, 2026 consisted of $12.8 million related to the payment of the quarterly cash dividend, $6.4 million paid in settlement of tax withholding obligations related to employee stock-based compensation awards, and $0.8 million used for the repayment of our credit facility.
Adjusted free cash flow was $13.1 million for the first quarter of 2026, an decrease of $10.3 million from the first quarter of 2025.
QUARTERLY CASH DIVIDEND
During the three months ended March 31, 2026, the Company declared and paid a cash dividend of $0.36 per common share or $12.8 million.
On April 20, 2026, the Board of Directors declared a dividend of $0.36 per share of outstanding common stock, payable on June 18, 2026 to stockholders of record at the close of business on June 4, 2026.
KEY OPERATING METRICS
Three Months Ended March 31,
2026
2025
Subscribers (end of period)(1)
993,000
1,079,000
Subscriber revenue (in millions)(2)
$ 103.8
$ 109.9
Average revenue per customer (last twelve months)(3)
$ 284
$ 244
Paid downloads (in millions)(4)
104.1
120.9
Subscribers, Subscriber Revenue and Average Revenue Per Customer from acquisitions are included in these metrics beginning twelve months after the closing of the respective business combination. Accordingly, the metrics include Subscribers, Subscriber revenue, and Average revenue per customer from Backgrid beginning February 2025. 2025 metrics include the counts and revenues from Envato, which was acquired in July 22, 2024.
(1) Subscribers is defined as those customers who purchase one or more of our monthly recurring products for a continuous period of at least three months, measured as of the end of the reporting period.
(2) Subscriber revenue is defined as the revenue generated from subscribers during the period.
(3) Average revenue per customer is calculated by dividing total revenue for the last twelve-month period by customers. Customers is defined as total active, paying customers that contributed to total revenue over the last twelve-month period.
(4) Paid downloads is the number of downloads that our customers make in a given period of our content. Paid downloads exclude content related to our Studios business, downloads of content that are offered to customers for no charge, including our free trials and metadata delivered through our data deal offering.
NON-GAAP FINANCIAL MEASURES
To supplement Shutterstock’s consolidated financial statements presented in accordance with the accounting principles generally accepted in the United States, or GAAP, Shutterstock’s management considers certain financial measures that are not prepared in accordance with GAAP, collectively referred to as non-GAAP financial measures, including adjusted EBITDA, adjusted EBITDA margin, adjusted net income, adjusted net income per diluted share, revenue growth (including by distribution channel) on a constant currency basis (expressed as a percentage), billings and adjusted free cash flow.
Shutterstock defines adjusted EBITDA as net income adjusted for depreciation and amortization, non-cash equity-based compensation, Giphy Retention Compensation Expense – non-recurring, foreign currency transaction gains and losses, severance costs associated with strategic workforce optimizations, impairment loss on long-term investment, impairment of lease assets, unrealized losses / gains on investments, legal contingencies, interest income and expense, income taxes and Merger related costs; adjusted EBITDA margin as the ratio of adjusted EBITDA to revenue; adjusted net income as net income adjusted for the impact of non-cash equity-based compensation, amortization of acquisition-related intangible assets, Giphy Retention Compensation Expense – non-recurring, severance costs associated with strategic workforce optimizations (reported in Other), unrealized losses / gains on investments (reported in Other), impairment loss on long-term investment, impairment of lease assets, legal contingencies Merger related costs and the estimated tax impact of such adjustments; adjusted net income per diluted common share as adjusted net income divided by weighted average diluted shares; revenue growth (including by product offering) on a constant currency basis (expressed as a percentage) as the increase in current period revenues over prior period revenues, utilizing fixed exchange rates for translating foreign currency revenues for all periods in the comparison; billings as revenue adjusted for the change in deferred revenue, excluding deferred revenue acquired through business combinations; and adjusted free cash flow as net cash provided by operating activities, adjusted for capital expenditures, content acquisition, cash received related to Giphy Retention Compensation in connection with the acquisition of Giphy, and cash paid for costs related to the Getty Images merger.
The expense associated with the Giphy Retention Compensation related to (i) the one-time employment inducement bonuses and (ii) the vesting of the cash value of unvested Meta equity awards held by the employees prior to closing, which are reflected in operating expenses (together, the “Giphy Retention Compensation Expense – non-recurring”), are required payments in accordance with the terms of the acquisition. Meta’s sale of Giphy was directed by the United Kingdom Competition and Markets Authority (the “CMA”) and accordingly, the terms of the acquisition were subject to CMA preapproval. Management considers the operating expense associated with these required payments to be unusual and non-recurring in nature. The Giphy Retention Compensation Expense – non-recurring is not considered an ongoing expense necessary to operate the Company’s business. Therefore, such expenses have been included in the below adjustments for calculating adjusted EBITDA, adjusted EBITDA margin, adjusted net income and adjusted net income per diluted common share. For the three months ended March 31, 2026, the Company also incurred $3.3 million of Giphy Retention Compensation expense related to recurring employee costs, which is included in operating expenses, and are not included in the below adjustments for calculating adjusted EBITDA, adjusted EBITDA margin, adjusted net income and adjusted net income per diluted common share.
These figures have not been calculated in accordance with GAAP and should be considered only in addition to results prepared in accordance with GAAP and should not be considered as a substitute for, or superior to, GAAP results. Shutterstock cautions investors that non-GAAP financial measures are not based on any standardized methodology prescribed by GAAP and are not necessarily comparable to similarly-titled measures presented by other companies.
Shutterstock’s management believes that adjusted EBITDA, adjusted EBITDA margin, adjusted net income, adjusted net income per diluted common share, revenue growth (including by product offering) on a constant currency basis (expressed as a percentage), billings and adjusted free cash flow are useful to investors because these measures enable investors to analyze Shutterstock’s operating results on the same basis as that used by management. Additionally, management believes that adjusted EBITDA, adjusted EBITDA margin, adjusted net income and adjusted net income per diluted common share provide useful information to investors about the performance of the Company’s overall business because such measures eliminate the effects of unusual or other infrequent charges that are not directly attributable to Shutterstock’s underlying operating performance; and revenue growth (including by product offering) on a constant currency basis (expressed as a percentage) provides useful information to investors by eliminating the effect of foreign currency fluctuations that are not directly attributable to Shutterstock’s operating performance. Management also believes that providing these non-GAAP financial measures enhances the comparability for investors in assessing Shutterstock’s financial reporting. Shutterstock’s management believes that adjusted free cash flow is useful for investors because it provides them with an important perspective on the cash available for strategic measures, after making necessary capital investments in internal-use software and website development costs to support the Company’s ongoing business operations and provides them with the same measures that management uses as the basis for making resource allocation decisions.
Shutterstock’s management also uses the non-GAAP financial measures adjusted EBITDA, adjusted EBITDA margin, adjusted net income, adjusted net income per diluted common share, revenue growth (including by product offering) on a constant currency basis (expressed as a percentage), billings and adjusted free cash flow, in conjunction with GAAP financial measures, as an integral part of managing the business and to, among other things: (i) monitor and evaluate the performance of Shutterstock’s business operations, financial performance and overall liquidity; (ii) facilitate management’s internal comparisons of the historical operating performance of its business operations; (iii) facilitate management’s external comparisons of the results of its overall business to the historical operating performance of other companies that may have different capital structures and debt levels; (iv) review and assess the operating performance of Shutterstock’s management team and, together with other operational objectives, as a measure in evaluating employee compensation; (v) analyze and evaluate financial and strategic planning decisions regarding future operating investments; and (vi) plan for and prepare future annual operating budgets and determine appropriate levels of operating investments.
Reconciliations of the differences between each of our non-GAAP financial measures (adjusted EBITDA, adjusted EBITDA margin, adjusted net income, adjusted net income per diluted common share, revenue growth (including by product offering) on a constant currency basis (expressed as a percentage), billings, adjusted free cash flow), and each measure’s most directly comparable financial measure calculated and presented in accordance with GAAP, are presented under the headings “Reconciliation of Non-GAAP Financial Information to GAAP” and “Supplemental Financial Data” immediately following the Consolidated Balance Sheets.
Previously Announced Merger Agreement with Getty Images
On January 7, 2025, Shutterstock announced that it entered into a merger agreement with Getty Images to combine in a merger of equals transaction, creating a premier visual content company. The transaction is subject to the satisfaction of customary closing conditions, including receipt of required regulatory approvals. As previously announced, a majority of Shutterstock stockholders approved the adoption of the merger agreement at a special meeting of stockholders held on June 10, 2025.
As previously communicated, in light of the pending transaction with Getty Images, Shutterstock will not be hosting a conference call or providing financial guidance in conjunction with its first quarter 2026 results.
For additional information associated with the transaction, please see the Company’s filings from time to time with the Securities and Exchange Commission.
ABOUT SHUTTERSTOCK
Shutterstock is in the business of turning ideas into impact. Powered by a global network of millions of creators and our cutting-edge technology, we provide businesses, creatives and brand leaders with the essential, universal ingredients to make their work more effective. Shutterstock is home to the world’s largest and most diverse collection of high-quality licensable assets, data and AI solutions, advertising and distribution solutions, exclusive editorial content, and full-service studio production—delivering unparalleled resources to fuel great work.
Discover our impact at www.shutterstock.com and connect with us on LinkedIn, Instagram, X, Facebook and YouTube.
FORWARD-LOOKING STATEMENTS
The statements in this press release, and any related oral statements, include forward-looking statements within the meaning of Section 27A of the Securities Act of 1933, as amended, and Section 21E of the Securities Exchange Act of 1934, as amended. All statements, other than historical facts, are forward-looking statements. Forward-looking statements may discuss goals, intentions and expectations as to future plans, trends, events, results of operations or financial condition, financings or otherwise, based on current beliefs and involve numerous risks and uncertainties that could cause actual results to differ materially from expectations. Forward-looking statements speak only as of the date they are made or as of the dates indicated in the statements and should not be relied upon as predictions of future events, as there can be no assurance that the events or circumstances reflected in these statements will be achieved or will occur or the timing thereof. Forward-looking statements can often, but not always, be identified by the use of forward-looking terminology including “believes,” “expects,” “may,” “will,” “should,” “could,” “might,” “seeks,” “intends,” “plans,” “pro forma,” “estimates,” “anticipates,” “designed,” or the negative of these words and phrases, other variations of these words and phrases or comparable terminology, but not all forward-looking statements include such identifying words. Forward-looking statements are based upon current plans, estimates and expectations that are subject to risks, uncertainties and assumptions. Should one or more of these risks or uncertainties materialize, or should underlying assumptions prove incorrect, actual results may vary. The forward-looking statements in this press release relate to, among other things, statements regarding industry prospects, future business, future results of operations or financial condition, future dividends, future stock performance, our ability to consummate acquisitions and integrate the businesses we have acquired or may acquire into our existing operations, new or planned features, products or services, management strategies, our ability to offer premier Data Licensing and AI Services, our competitive position, our ability to obtain applicable regulatory approvals on a timely basis or otherwise for the proposed transaction with Getty Images, our ability to satisfy the other closing conditions of the proposed transaction with Getty Images, on a timely basis or otherwise, and the expected timing and completion of the proposed transaction with Getty Images. Important factors that could cause actual results to differ materially from the forward-looking statements include, among other things: risks and uncertainties associated with our proposed transaction with Getty Images and those risks discussed under the section captioned “Risk Factors” in Shutterstock’s Annual Report on Form 10-K for the fiscal year ended December 31, 2025, subsequent Quarterly Reports on Form 10-Q and other filings with the SEC. Should one or more of these risks or uncertainties materialize, or should underlying assumptions prove incorrect, actual results may vary materially from those indicated or anticipated by such forward looking statements. While the list of factors presented here is considered representative, no such list should be considered to be a complete statement of all potential risks and uncertainties. Unlisted factors may present significant additional obstacles to the realization of forward looking statements. Shutterstock does not assume, and hereby disclaims, any obligation to update forward-looking statements, except as may be required by law.
Shutterstock, Inc.
Consolidated Statements of Operations
(In thousands, except for per share data)
(unaudited)
Three Months Ended March 31,
2026
2025
Revenue
$ 199,170
$ 242,620
Operating expenses:
Cost of revenue
94,788
100,888
Sales and marketing
48,346
53,359
Product development
19,405
19,865
General and administrative
67,585
58,307
Total operating expenses
230,124
232,419
(Loss) / income from operations
(30,954)
10,201
Interest expense
(3,760)
(4,298)
Other (expense) / income, net
(14,661)
14,515
(Loss) / income before income taxes
(49,375)
20,418
(Benefit) / provision for income taxes
(1,806)
1,730
Net (loss) / income
$ (47,569)
$ 18,688
(Losses) / earnings per share:
Basic
$ (1.34)
$ 0.54
Diluted
$ (1.34)
$ 0.53
Weighted average common shares outstanding:
Basic
35,543
34,890
Diluted
35,543
35,322
Shutterstock, Inc.
Consolidated Balance Sheets
(In thousands, except par value amount)
(unaudited)
March 31, 2026
December 31, 2025
ASSETS
Current assets:
Cash and cash equivalents
$ 162,518
$ 178,244
Accounts receivable, net of allowance of $3,547 and $3,431
103,362
112,626
Prepaid expenses and other current assets
55,366
47,769
Total current assets
321,246
338,639
Property and equipment, net
61,968
62,553
Right-of-use assets
9,003
9,770
Intangible assets, net
203,879
215,673
Goodwill
574,169
574,614
Deferred tax assets, net
68,185
61,289
Other assets
72,748
93,398
Total assets
$ 1,311,198
$ 1,355,936
LIABILITIES AND STOCKHOLDERS’ EQUITY
Current liabilities:
Accounts payable
$ 13,532
$ 13,898
Accrued expenses
103,626
129,952
Contributor royalties payable
95,375
94,163
Deferred revenue
208,661
212,984
Debt
158,111
158,110
Other current liabilities
49,790
19,295
Total current liabilities
629,095
628,402
Deferred tax liability, net
617
1,134
Long-term debt
115,898
116,639
Lease liabilities
15,338
17,247
Other non-current liabilities
18,172
11,476
Total liabilities
779,120
774,898
Commitments and contingencies
Stockholders’ equity:
Common stock, $0.01 par value; 200,000 shares authorized; 41,076 and 41,049 shares
issued and 35,555 and 35,528 shares outstanding as of March 31, 2026 and December 31,
2025, respectively
410
410
Treasury stock, at cost; 5,521 shares as of March 31, 2026 and December 31, 2025
(269,804)
(269,804)
Additional paid-in capital
533,004
520,018
Accumulated other comprehensive loss
(6,349)
(4,754)
Retained earnings
274,817
335,168
Total stockholders’ equity
532,078
581,038
Total liabilities and stockholders’ equity
$ 1,311,198
$ 1,355,936
Shutterstock, Inc.
Consolidated Statements of Cash Flows
(In thousands, except par value amount)
(unaudited)
Three Months Ended
March 31,
2026
2025
CASH FLOWS FROM OPERATING ACTIVITIES
Net (loss) / income
$ (47,569)
$ 18,688
Adjustments to reconcile net income to net cash provided by operating activities:
Depreciation and amortization
22,704
22,671
Deferred taxes
(7,342)
(7,772)
Non-cash equity-based compensation
13,372
17,884
Legal contingencies
28,000
—
Bad debt expense
105
593
Unrealized loss / (gain) on investments, net
15,305
(13,260)
Changes in operating assets and liabilities:
Accounts receivable
8,966
(16,618)
Prepaid expenses and other current and non-current assets
5,351
17,982
Accounts payable and other current and non-current liabilities
(19,414)
(17,264)
Contributor royalties payable
1,625
3,379
Deferred revenue
(3,733)
(1,036)
Net cash provided by operating activities
$ 17,370
$ 25,247
CASH FLOWS FROM INVESTING ACTIVITIES
Capital expenditures
(11,595)
(10,808)
Cash received related to Giphy Retention Compensation
368
492
Acquisition of content
(191)
(897)
Security deposit (release) / payment
272
(21)
Net cash used in investing activities
$ (11,146)
$ (11,234)
CASH FLOWS FROM FINANCING ACTIVITIES
Cash paid related to settlement of employee taxes related to RSU vesting
(6,387)
(3,539)
Payment of cash dividends
(12,782)
(11,501)
Repayment of credit facility
(781)
(781)
Net cash used in financing activities
$ (19,950)
$ (15,821)
Effect of foreign exchange rate changes on cash
(2,000)
2,788
Net (decrease) / increase in cash and cash equivalents
(15,726)
980
Cash and cash equivalents, beginning of period
178,244
111,251
Cash and cash equivalents, end of period
$ 162,518
$ 112,231
Supplemental Disclosure of Cash Information:
Cash paid / (received) for income taxes
$ 744
$ (604)
Cash paid for interest
3,770
4,359
Shutterstock, Inc.
Reconciliation of Non-GAAP Financial Information to GAAP
(In thousands, except per share information)
(unaudited)
Adjusted EBITDA, adjusted EBITDA margin, adjusted net income, adjusted net income per diluted share, revenue growth (including by distribution channel) on a constant currency basis (expressed as a percentage), billings and adjusted free cash flow are not financial measures prepared in accordance with United States generally accepted accounting principles (GAAP). Such non-GAAP financial measures should not be construed as alternatives to any other measures of performance determined in accordance with GAAP. Investors are cautioned that non-GAAP financial measures are not based on any standardized methodology prescribed by GAAP and are not necessarily comparable to similarly-titled measures presented by other companies.
Three Months Ended March 31,
2026
2025
Net (loss) / income
$ (47,569)
$ 18,688
Add / (less) Non-GAAP adjustments:
Non-cash equity-based compensation
13,372
17,884
Tax effect of non-cash equity-based compensation (1)
(3,142)
(4,203)
Acquisition-related amortization expense (2)
9,599
9,697
Tax effect of acquisition-related amortization expense (1)
(2,256)
(2,279)
Legal contingencies
28,000
—
Giphy Retention Compensation Expense – non-recurring
649
566
Tax effect of Giphy Retention Compensation Expense – non-recurring(1)
(153)
(133)
Merger related costs
2,855
11,861
Tax effect of Merger related costs(1)
(642)
(2,669)
Other(3)
21,385
(13,080)
Tax effect of other(1)
(1,368)
(41)
Adjusted net income
$ 20,730
$ 36,291
Net (loss) / income per diluted common share
$ (1.34)
$ 0.53
Adjusted net income per diluted common share
$ 0.58
$ 1.03
Weighted average diluted shares
35,543
35,322
(1) Statutory tax rates are used to calculate the tax effect of the adjustments.
(2) Of these amounts, $8.9 million and $9.0 million are included in cost of revenue for the three months ended March 31, 2026 and 2025, respectively. The remainder of acquisition-related amortization expense is included in general and administrative expense in the Statement of Operations.
(3) Other consists of unrealized gains and losses on investments and severance costs associated with strategic workforce optimizations.
Three Months Ended March 31,
2026
2025
Net (loss) / income
$ (47,569)
$ 18,688
Add / (less) Non-GAAP adjustments:
Interest expense
3,760
4,298
Interest income
(801)
(935)
Provision for income taxes
(1,806)
1,730
Depreciation and amortization
22,704
22,671
EBITDA
$ (23,712)
$ 46,452
Non-cash equity-based compensation
13,372
17,884
Giphy Retention Compensation Expense – non-recurring
649
566
Merger related costs
2,855
11,861
Foreign currency loss / (gain)
157
(320)
Unrealized loss / (gain) on investment
15,305
(13,260)
Legal contingencies
28,000
—
Workforce optimization – severance
6,080
180
Adjusted EBITDA
$ 42,706
$ 63,363
Revenue
$ 199,170
$ 242,620
Net (loss) / income margin
(23.9) %
7.7 %
Adjusted EBITDA margin
21.4 %
26.1 %
Three Months Ended March 31,
2026
2025
Reported revenue (in thousands)
$ 199,170
$ 242,620
Revenue (decline) /growth
(18) %
13 %
Revenue (decline) / growth on a constant currency basis
(19) %
14 %
Content reported revenue (in thousands)
$ 178,126
$ 202,888
Content revenue (decline) / growth
(12) %
17 %
Content revenue (decline) / growth on a constant currency basis
(14) %
17 %
Data, Distribution, and Services reported revenue (in thousands)
$ 21,044
$ 39,732
Data, Distribution, and Services revenue growth / (decline)
(47) %
(2) %
Data, Distribution, and Services revenue growth / (decline) on a constant currency basis
(47) %
(2) %
Three Months Ended March 31,
2026
2025
Cash flow information:
Net cash provided by operating activities
$ 17,370
$ 25,247
Net cash used in investing activities
$ (11,146)
$ (11,234)
Net cash used in financing activities
$ (19,950)
$ (15,821)
Adjusted free cash flow:
Net cash provided by operating activities
$ 17,370
$ 25,247
Capital expenditures
(11,595)
(10,808)
Content acquisitions
(191)
(897)
Cash received related to Giphy Retention Compensation
368
492
Merger related costs
7,180
9,350
Adjusted Free Cash Flow
$ 13,132
$ 23,384
Three Months Ended March 31,
2026
2025
Content
$ 178,126
$ 202,888
Data, Distribution, and Services
$ 21,044
$ 39,732
Total revenue
$ 199,170
$ 242,620
Change in total deferred revenue
$ (4,323)
$ 753
Total billings
$ 194,847
$ 243,373
Shutterstock, Inc.
Supplemental Financial Data
(unaudited)
Historical Operating Metrics
Three Months Ended
3/31/26
12/31/25
9/30/25
6/30/25
3/31/25
12/31/245
9/30/245
6/30/24
Subscribers (end of period, in thousands) (1)
993
1,032
1,060
1,073
1,079
1,088
1,105
490
Subscriber revenue (in millions) (2)
$ 103.8
$ 104.7
$ 107.2
$ 108.0
$ 109.9
$ 107.7
$ 113.1
$ 80.3
Average revenue per customer (last twelve months) (3)
$ 284
$ 281
$ 279
$ 266
$ 244
$ 255
$ 254
$ 434
Paid downloads (in millions) (4)
104.1
107.9
111.7
112.6
120.9
125.8
112.3
33.4
Subscribers, Subscriber Revenue and Average Revenue Per Customer from acquisitions are included in these metrics beginning twelve months after the closing of the respective business combination. Accordingly, the metrics include Subscribers, Subscriber revenue, and Average revenue per customer from Backgrid beginning February 2025. 2025 metrics include the counts and revenues from Envato, which was acquired in July 22, 2024.
(1) Subscribers is defined as those customers who purchase one or more of our monthly recurring products for a continuous period of at least three months, measured as of the end of the reporting period.
(2) Subscriber revenue is defined as the revenue generated from subscribers during the period.
(3) Average revenue per customer is calculated by dividing total revenue for the last twelve-month period by customers. Customers is defined as total active, paying customers that contributed to total revenue over the last twelve-month period.
(4) Paid downloads is the number of downloads that our customers make in a given period of our content. Paid downloads exclude content related to our Studios business, downloads of content that are offered to customers for no charge, including our free trials and metadata delivered through our data deal offering.
(5) Subscribers and Subscriber Revenue are presented as if Envato was acquired as of the beginning of the period presented. Average revenue per customer includes Envato historical results over the last twelve month period.
Equity-Based Compensation by expense category
Three Months Ended
($ in thousands)
3/31/26
12/31/25
9/30/25
6/30/25
3/31/25
12/31/24
9/30/24
6/30/24
Cost of revenue
$ 183
$ 558
$ 528
$ 532
$ 396
$ 505
$ 443
$ 300
Sales and marketing
2,112
2,287
2,098
2,559
2,255
2,627
3,226
3,167
Product development
3,078
3,218
3,370
3,529
2,912
2,722
2,745
4,171
General and administrative
7,999
8,542
6,966
9,005
12,321
9,256
8,680
7,338
Total non-cash equity-based compensation
$ 13,372
$ 14,605
$ 12,962
$ 15,625
$ 17,884
$ 15,110
$ 15,094
$ 14,976
Depreciation and Amortization by expense category
Three Months Ended
($ in thousands)
3/31/26
12/31/25
9/30/25
6/30/25
3/31/25
12/31/24
9/30/24
6/30/24
Cost of revenue
$ 20,898
$ 21,010
$ 21,028
$ 20,804
$ 20,742
$ 21,191
$ 19,653
$ 20,087
General and administrative
1,806
1,725
1,849
1,807
1,929
2,096
1,991
1,346
Total depreciation and amortization
$ 22,704
$ 22,735
$ 22,877
$ 22,611
$ 22,671
$ 23,287
$ 21,644
$ 21,433
View original content to download multimedia:https://www.prnewswire.com/news-releases/shutterstock-reports-first-quarter-2026-financial-results-302754948.html
SOURCE Shutterstock, Inc.

You may like
Technology
SickSlip Expands Beyond Doctor’s Notes Into Sports Physicals, HSA/FSA Letters, and Dive Medicals
Published
28 minutes agoon
August 28, 2026By

Founded by Dr. Adam Z. Kawalek, SportSlip brings sports physicals online, built on the joint AAP/AHA pre-participation consensus with ECG screening read to international criteria.
LOS ANGELES, Aug. 28, 2026 /PRNewswire/ — SickSlip, the physician-founded company that modernized the workplace and school absence note, has expanded into three new categories, led by sports physicals for student athletes.
SportSlip is built around a proprietary physician-designed screening that captures a full cardiac, medical, and orthopedic history. It is modeled on the joint AAP/AHA pre-participation consensus, incorporates the American Heart Association’s full 14-element cardiac history, and offers an optional ECG review interpreted under the international (Seattle) criteria used in European and Olympic athlete screening.
“A sports physical is not a formality. It is often the one moment a young athlete’s cardiac, medical, and orthopedic history gets a careful look before they push their body hard, and it deserves real rigor,” said Adam Z. Kawalek, MD, a board-certified internal medicine physician on the medical staff at Cedars-Sinai Medical Center and SickSlip’s founder.
“We built SportSlip’s screening on the standards a good clinic would use. The difference is access. More than 100 million Americans no longer have a regular primary care physician, so for many families a well-designed telehealth screening is not the convenient option. It is the only one they have.”
SickSlip also launched MedSlip, issuing letters of medical necessity so patients can put pre-tax HSA and FSA funds toward expenses that require physician certification, and DiveSlip, physician-signed dive medical clearances for recreational scuba certification.
“Any brand that wants its product covered by HSA or FSA dollars needs a physician’s letter of medical necessity, and that’s the bottleneck. MedSlip is the physician layer that clears it, to the IRS standard and tied to a real diagnosis. Our aim is to be the medical-necessity rail the HSA and FSA economy runs on,” Dr. Kawalek added.
Every SickSlip document is signed by a licensed, board-certified physician with built-in verification for authenticity.
About SickSlip
SickSlip is a digital health company providing physician-reviewed documentation for work and school absences, sports physicals, HSA/FSA letters, and dive medicals. Founded in Los Angeles, it has served over 3,500 patients across 30 states.
SickSlip: www.sickslip.co
SportSlip: www.sportslip.co
MedSlip: www.medslip.co
DiveSlip: www.diveslip.co
Media contact:
Sahil Beg
sahil@sickslip.co
View original content to download multimedia:https://www.prnewswire.com/news-releases/sickslip-expands-beyond-doctors-notes-into-sports-physicals-hsafsa-letters-and-dive-medicals-302862802.html
SOURCE SickSlip
Technology
Grand Opening of $750M CANXPORT Logistics Hub a Triumph for Canadian Trade
Published
28 minutes agoon
August 28, 2026By

PRINCE RUPERT, BC, Aug. 28, 2026 /PRNewswire/ — Ray-Mont Logistics, Canadian National Railway (CN), and the Prince Rupert Port Authority (PRPA) announce the grand opening of CANXPORT, an innovative $750 million export logistics facility at the Port of Prince Rupert that is growing markets for Canadian exporters while supporting thousands of Canadian jobs.
CANXPORT, operated by Montreal-based Ray-Mont Logistics, will unlock global customers for Western Canada’s trade corridor. CANXPORT provides expanded capacity for rail-to-container transloading of multiple export products at the Port of Prince Rupert, including from the petrochemical, forestry, agriculture and mining sectors.
CN is proud to support Canadian trade and the operations at CANXPORT with its investment to expand the Zanardi Rapids Bridge, increase the rail corridor capacity, and enhance the port’s intermodal ecosystem.
Indigenous partners are actively involved in the development and operation of CANXPORT. PRPA awarded the primary contract to develop the site to an Indigenous joint venture that includes Metlakatla First Nation, Lax Kw’alaams Band, Gitxaala Nation and IDL Projects Inc. Metlakatla and Lax Kw’alaams are also majority owners of Gat Leedm Logistics, which is the main provider of truck drayage services at the Port of Prince Rupert.
The development of CANXPORT was supported by a $150 million loan from the Canada Infrastructure Bank (CIB), representing the CIB’s first-ever investment in a port project, in recognition of the project’s long-term economic benefits and importance for growing global trade. Transport Canada’s National Trade Corridors Fund contributed nearly $50 million and the Province’s Stronger BC program provided $25 million toward the project. As North America’s closest West Coast port to Asia, the Port of Prince Rupert is uniquely positioned to support Canada’s trade diversification strategy and generate prosperity to strengthen communities across the country.
PARTNER QUOTES
“CANXPORT is an investment in Canada’s trade future, creating jobs, expanding export capacity, and connecting Canadian products to global markets. This facility strengthens the Port of Prince Rupert as a world-class gateway while creating lasting economic opportunities for communities across Canada.”
– Kurt Slocombe, President and CEO, Prince Rupert Port Authority
“As a Canadian company, Ray-Mont Logistics is proud to invest in Prince Rupert and deliver a made-in-Canada solution that supports Canadian exporters and businesses. CANXPORT will lead the way in creating economic opportunities across the country and demonstrating what Canadian innovation can achieve on the global stage.”
– Charles Raymond, President and CEO, Ray-Mont Logistics
“CANXPORT is a part of the momentum building at Prince Rupert, creating new opportunities and connecting Canadian trade with global markets more efficiently. CN’s investments in Prince Rupert, including the Zanardi Rapids Bridge Project, expand capacity and enhance the competitiveness of this important gateway.”
– Tracy Robinson, President and Chief Executive Officer, CN
“Dow is pleased to see this transformational investment, which reinforces our confidence in the long-term strength and competitiveness of the region. The Port of Prince Rupert has been an exceptional partner, and this strategic investment further strengthens current and future port utilization and efficiency, helping companies that rely on the region’s infrastructure to serve global markets.”
– Skya Kruithof, President, Dow Canada
“CANXPORT is a powerful example of what can be achieved when Indigenous Nations are active partners in economic development. The Metlakatla First Nation played a direct role in bringing this facility to life by leading its construction together with our joint venture partners. Our vision, leadership and unwavering commitment to building a stronger economic future for our Nation and the region is bolstered by our businesses like Gat Leedm Logistics and the South Kaien Logistics Park that support the Prince Rupert Gateway.”
– Chief Robert Nelson, Metlakatla First Nation
“The opening of CANXPORT is an important milestone for the region and demonstrates the value of First Nations participation in major projects. Gitxaała Nation is pleased to have been involved in the development of this project and to see investment in the Port of Prince Rupert creating employment, business opportunities and long-term economic benefits for our people and the region.”
– Luugagwelks, Elected Chief Councillor Linda Innes, Gitxaała Nation
“Canada’s prosperity depends on our ability to get Canadian products to global markets quickly and reliably. CANXPORT will help our exporters reach more customers, strengthen our supply chains and create good jobs here at home. By expanding Canada’s trade capacity and opening new opportunities in fast-growing international markets, we are building a stronger, more resilient economy that delivers greater prosperity for communities across the country.”
– The Honourable Steven MacKinnon
Minister of Transport and Leader of the Government in the House of Commons
“The opening of CANXPORT is a major step forward for British Columbia’s trade future. By expanding export capacity at the Port of Prince Rupert, this project supports B.C.’s Look West strategy to diversify trade, grow exports to non-U.S. markets, and strengthen Canada’s trade corridors. It also demonstrates the value of strong partnerships between Indigenous Nations, industry, and governments in building infrastructure that creates jobs and benefits communities.”
– Mike Farnworth, B.C. Minister of Transportation and Transit
“The opening of CANXPORT reflects the power of partnerships. The CIB’s $150 million investment enabled new trade capacity, created long-term jobs for Indigenous and local communities and strengthens Canada’s ability to compete in global markets. By improving the movement of goods, CANXPORT will support economic growth and productivity for years to come.”
– Ehren Cory, CEO, Canada Infrastructure Bank
KEY FACTS
CANXPORT is the first in a series of major projects to come online at the Port of Prince Rupert as part of a $3 billion expansion to grow the Gateway.CANXPORT contributes up to 400,000 twenty-foot equivalent units (TEUs) of rail-to-container transloading capacity to the Port annually, with the ability to increase capacity to 750,000 TEUs for bulk and breakbulk commodities in the future.The Port of Prince Rupert is the third-largest port in Canada with the deepest natural harbour in North America and shipped $8.1 billion of Canada’s exports in 2025. In 2025, the Port of Prince Rupert handled 26.3 million tonnes of cargo, a 14% increase over 2024.The Port of Prince Rupert currently supports approximately 7,940 full-time jobs across BC, representing $690 million in annual wages, and contributes $1.5 billion to Canada’s GDP.
ABOUT THE PRINCE RUPERT PORT AUTHORITY
The Prince Rupert Port Authority manages the Port of Prince Rupert, Canada’s northernmost trade gateway on the west coast. The Port of Prince Rupert anchors one of the fastest and most reliable supply chains between North America and Asia, providing vital infrastructure to support shippers and industries as they move their goods and resources to market. The Port of Prince Rupert handles $8.1 billion in Canadian exports and $32.1 billion in imports, supports approximately 7,940 full-time jobs throughout BC, representing $690 million in annual wages, and contributes $1.5 billion to Canada’s GDP.
View original content to download multimedia:https://www.prnewswire.com/news-releases/grand-opening-of-750m-canxport-logistics-hub-a-triumph-for-canadian-trade-302862538.html
SOURCE Prince Rupert Port Authority
Technology
Luxshare Precision Expects Net Profit to Rise 15%-25% in the First Nine Months of 2026
Published
28 minutes agoon
August 28, 2026By

Growth outlook supported by continued execution across consumer electronics, AI data center infrastructure and automotive electronics
DONGGUAN, China, Aug. 28, 2026 /PRNewswire/ — Luxshare Precision Industry Co., Ltd. (“Luxshare Precision” or the “Company”) (SZSE: 002475; HKEX: 02475), a global provider of precision intelligent manufacturing solutions, announced its preliminary earnings outlook for the nine months ending September 30, 2026.
The Company expects net income attributable to shareholders of RMB 13.25 billion to RMB 14.40 billion, representing year-over-year growth of 15% to 25%. Adjusted net income attributable to shareholders, excluding non-recurring gains and losses, is expected to reach RMB 10.37 billion to RMB 11.72 billion, an increase of 8.63% to 22.79%. Basic earnings per share is expected to range from RMB 1.79 to RMB 1.95, compared with RMB 1.59 in the prior-year period.
The outlook reflects continued progress across the Company’s three core business platforms, supported by its global manufacturing footprint, vertically integrated capabilities and precision intelligent manufacturing platform. The estimates are preliminary and unaudited, with final results to be reported in the Company’s 2026 third-quarter report.
“Our expected performance reflects disciplined execution across our diversified business portfolio and progress in converting earlier technology and capacity investments into commercial programs,” said Wang Laichun, Chairwoman and General Manager of Luxshare Precision. “We remain focused on AI-enabled devices, AI infrastructure and intelligent vehicles, while strengthening localized delivery, operating efficiency and long-term value creation.”
Growth Across Three Core Businesses
Consumer Electronics. Based on the latest disclosed results for the six months ended June 30, 2026, segment revenue increased 19.3% year over year to RMB 122.48 billion. Luxshare Precision continued to deepen core customer relationships, expand ODM and JDM capabilities, and increase its participation in AI-enabled devices. By integrating technologies across acoustics, optics, electrical systems, thermal management, magnetics and precision structures, the Company is extending its capabilities from components and modules to product definition, system development and end-to-end manufacturing. Key areas include AI PCs, smart wearables, AI glasses and intelligent acoustic products.
Communications and Data Center. First-half revenue increased 49.7% to RMB 16.61 billion. The Company is building an integrated AI infrastructure portfolio spanning high-speed copper interconnects, optical interconnects, thermal management and power management. Progress includes batch shipments of 1.6T DAC, ACC and AEC products, volume production of 800G optical products, continued customer introductions for liquid-cooling solutions, and scaled production of DC-DC server power modules. Its system-led development model supports coordinated optimization of bandwidth, signal integrity, power density and thermal performance.
Automotive Electronics. First-half revenue increased 274.1% to RMB 32.39 billion, supported by organic growth, customer program ramp-ups and Leoni’s contribution. Luxshare Precision has expanded its portfolio across connectors, wiring harnesses, intelligent control systems, smart chassis technologies and powertrain solutions. High-speed connectors, intelligent cockpit platforms and advanced driver-assistance systems are progressing across multiple customer programs, while rear-wheel steering products have entered mass production on mainstream vehicle models in China. The continued integration of Leoni strengthens the Company’s global customer access, engineering resources and localized delivery capabilities as it develops a platform-based global Tier 1 business.
Targeted Investment Supports Commercialization
The following figures represent the Company’s latest disclosed data for the six months ended June 30, 2026.
Gross margin increased by 17 basis points year over year to 11.78%, supported by operating leverage, internal efficiency improvements and faster growth in Automotive Electronics and Communications and Data Center, which carry gross margins above the Company average.
Capital expenditures totaled RMB 10.27 billion, up RMB 742 million year over year, primarily supporting overseas facilities, infrastructure and new product lines. Research and development investment increased 43.1% to RMB 6.57 billion, with more than half directed toward forward-looking technology preparation for programs approaching commercialization.
Inventory totaled RMB 50.37 billion at June 30, 2026, an increase of 19.0% from year-end 2025, below first-half revenue growth of 40.2%. The increase primarily reflected business expansion and strategic material preparation for selected products. Digital operating platforms continue to strengthen coordination across demand planning, procurement, inventory and production.
Global Platform and Outlook
Luxshare Precision operates across five continents, 29 countries and more than 100 production sites, supporting localized delivery, customer collaboration and supply chain resilience. Its vertically integrated platform spans core components, functional modules and system-level products, while AI-enabled digital manufacturing tools support quality management, predictive maintenance, production scheduling and standardized global execution.
For the remainder of 2026, the Company will continue advancing consumer electronics product launches and ODM/JDM programs; accelerating commercialization across high-speed interconnects, optical products, liquid cooling and power management; and capturing further integration benefits and customer opportunities in Automotive Electronics.
Luxshare Precision will maintain disciplined capital allocation and continue investing in technology, manufacturing capacity and global delivery capabilities that support sustainable, high-quality growth.
About Luxshare Precision
Luxshare Precision Industry Co., Ltd. is a global provider of precision intelligent manufacturing solutions serving Consumer Electronics, Communications and Data Center, Automotive Electronics and other technology-driven industries. The Company supports customers from product definition and process development through new product introduction, volume manufacturing and global delivery.
View original content to download multimedia:https://www.prnewswire.com/news-releases/luxshare-precision-expects-net-profit-to-rise-1525-in-the-first-nine-months-of-2026-302861865.html
SOURCE Luxshare Precision Industry Co., Ltd.


SickSlip Expands Beyond Doctor’s Notes Into Sports Physicals, HSA/FSA Letters, and Dive Medicals

Grand Opening of $750M CANXPORT Logistics Hub a Triumph for Canadian Trade

Luxshare Precision Expects Net Profit to Rise 15%-25% in the First Nine Months of 2026

Send Rakhi to UK swiftly with UK Gifts Portal

Whiteboard Series with NEAR | Ep: 45 Joel Thorstensson from ceramic.network

New Gooseneck Omni Antennas Offer Enhanced Signals in a Durable Package

Why You Should Build on #NEAR – Co-founder Illia Polosukhin at CV Labs
Whiteboard Series with NEAR | Ep: 45 Joel Thorstensson from ceramic.network

NEAR End of Year Town Hall 2021: The Open Web World, MetaBUILD 2 Hackathon and 2021 recap
Trending
-

 Technology3 days ago
Combos Makes Its Global Debut at Gamescom, Bringing AI-Created Games by Everyday Creators
-
 Technology3 days ago
Handshakes Launches AI Agent to Transform Corporate Due Diligence and Investigation
-
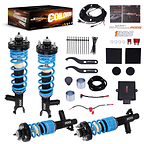
 Technology5 days ago
Maxpeedingrods Introduces IDDS Series Coilover System with Electronic Damping Control
-
 Technology2 days ago
JinkoSolar Announces Second Quarter 2026 Financial Results
-

 Near Videos4 days ago
NEAR’s AI Money Thesis | NEAR Co-Founder Illia Polosukhin
-

 Technology5 days ago
World’s First Autonomous Humanoid Tennis Match: GALBOT Robots Complete 100+ Consecutive Rallies
-

 Technology16 hours ago
Evernorth Announces Effectiveness of Form S-4 Registration Statement, Progresses Toward Planned Nasdaq-Listing
-

 Technology5 days ago
Inspira Enterprise Expands into Australia to Accelerate AI-Driven Cybersecurity and Digital Resilience Across Enterprises