
Technology
Jack Henry & Associates, Inc. Reports Third Quarter Fiscal 2026 Results
Published
1 day agoon
By
Third quarter summary:
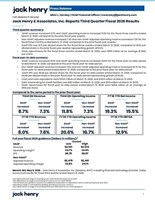
GAAP revenue increased 8.7% and GAAP operating income increased 11.8% for the fiscal three months ended March 31, 2026, compared to the prior fiscal year quarter.Non-GAAP adjusted revenue increased 7.3% and non-GAAP adjusted operating income increased 7.3% for the fiscal three months ended March 31, 2026, compared to the prior fiscal year quarter.1GAAP EPS was $1.71 per diluted share for the fiscal three months ended March 31, 2026, compared to $1.52 per diluted share in the prior fiscal year quarter representing growth of 12.2%.Stock repurchases for the fiscal three months ended March 31, 2026, were $159 million at an average of $162 per share.
Fiscal year-to-date summary:
GAAP revenue increased 8.0% and GAAP operating income increased 20.6% for the fiscal year-to-date period ended March 31, 2026, compared to the prior fiscal year-to-date period.Non-GAAP adjusted revenue increased 7.6% and non-GAAP adjusted operating income increased 16.7% for the fiscal year-to-date period ended March 31, 2026, compared to the prior fiscal year-to-date period.1GAAP EPS was $5.41 per diluted share for the fiscal year-to-date period ended March 31, 2026, compared to $4.49 per diluted share in the prior fiscal year-to-date period representing growth of 20.4%.Cash and cash equivalents were $20.6 million at March 31, 2026, and $39.9 million at March 31, 2025.Debt outstanding for credit facilities was $90 million at March 31, 2026, and $170 million at March 31, 2025.Stock repurchases for fiscal year-to-date period ended March 31, 2026, were $284 million at an average of $160 per share.
Full year fiscal 2026 guidance (Dollars in millions):3
Current
GAAP
Low
High
Revenue
$2,521
$2,533
Operating margin4
24.7 %
24.9 %
EPS
$6.78
$6.87
Non-GAAP5
Adjusted revenue
$2,479
$2,491
Adjusted operating margin
23.9 %
24.1 %
MONETT, Mo., May 5, 2026 /PRNewswire/ — Jack Henry & Associates, Inc. (Nasdaq: JKHY), a leading financial technology provider, today announced results for fiscal third quarter ended March 31, 2026.
1 See tables below on page 4 reconciling non-GAAP financial measures to GAAP.
2See table below on page 14 reconciling net income to non-GAAP EBITDA.
3 The full fiscal year guidance assumes no additional acquisitions or dispositions will be made during fiscal year 2026.
4Operating margin is calculated by dividing operating income by revenue.
5See tables below on page 9 reconciling fiscal year 2026 GAAP to non-GAAP guidance.
According to Greg Adelson, President and CEO, “We delivered very strong third-quarter financial results, reflecting our differentiated set of modern solutions, unwavering focus on helping banks and credit unions win in the markets they serve, and disciplined execution across our business. Sales momentum remained strong, highlighted by 17 competitive core wins in the quarter, our best third quarter for new core wins in the last seven years. The sales pipeline is increasing, fueled by increased technology spending and competitive uncertainty, positioning Jack Henry well for driving long-term growth and value creation.”
Operating Results
Revenue, operating expenses, operating income, and net income for the fiscal three and nine months ended March 31, 2026, compared to the fiscal three and nine months ended March 31, 2025, were as follows:
Revenue
(Unaudited, dollars in thousands)
Three Months Ended
March 31,
%
Change
Nine Months Ended
March 31,
%
Change
2026
2025
2026
2025
Revenue
Services and Support
$ 365,149
$ 330,792
10.4 %
$ 1,087,808
$ 1,010,498
7.7 %
Percentage of Total Revenue
57.4 %
56.5 %
57.2 %
57.4 %
Processing
271,096
254,295
6.6 %
812,508
749,418
8.4 %
Percentage of Total Revenue
42.6 %
43.5 %
42.8 %
42.6 %
REVENUE
$ 636,245
$ 585,087
8.7 %
$ 1,900,316
$ 1,759,916
8.0 %
Services and support revenue increased for the fiscal three months ended March 31, 2026, primarily driven by growth in data processing and hosting revenue within private and public cloud revenue of 9.4% and higher deconversion revenue by $9,021. Processing revenue increased for the fiscal three months ended March 31, 2026, primarily driven by growth in digital and transaction revenue of 9.9%, card revenue of 3.6%, and faster payments revenue of 46.4%.Services and support revenue increased for the fiscal nine months ended March 31, 2026, primarily driven by growth in data processing and hosting revenue within private and public cloud revenue of 8.9% and higher deconversion revenue by $20,094. Processing revenue increased for the fiscal nine months ended March 31, 2026, primarily driven by growth in digital and transaction revenue of 12.8%, card revenue of 6.2%, and faster payments revenue of 50.5%.For the fiscal three months ended March 31, 2026, core segment revenue increased 9.2%, payments segment revenue increased 7.0%, complementary segment revenue increased 8.7%, and corporate services segment revenue increased 27.5%. For the fiscal three months ended March 31, 2026, core segment non-GAAP adjusted revenue increased 8.6%, payments segment non-GAAP adjusted revenue increased 4.7%, complementary segment non-GAAP adjusted revenue increased 7.2%, and corporate services non-GAAP adjusted segment revenue increased 27.1%. Total non-GAAP adjusted revenue increased 7.3% for the same period (see revenue lines of segment break-out tables on pages 5 and 6 below for a reconciliation of GAAP segment revenue to non-GAAP adjusted segment revenue).For the fiscal nine months ended March 31, 2026, core segment revenue increased 5.9%, payments segment revenue increased 8.0%, complementary segment revenue increased 9.5%, and corporate services segment revenue increased 14.5%. For the fiscal nine months ended March 31, 2026, core segment non-GAAP adjusted revenue increased 7.4%, payments segment non-GAAP adjusted revenue increased 6.5%, complementary segment non-GAAP adjusted revenue increased 8.4%, and corporate services non-GAAP adjusted segment revenue increased 14.2%. Total non-GAAP adjusted revenue increased 7.6% for the same period (see revenue lines of segment break-out tables on pages 7 and 8 below for a reconciliation of GAAP segment revenue to non-GAAP adjusted segment revenue).
Operating Expenses and Operating Income
(Unaudited, dollars in thousands)
Three Months Ended
March 31,
% Change
Nine Months Ended
March 31,
% Change
2026
2025
2026
2025
Cost of Revenue
$ 363,922
$ 340,586
6.9 %
$ 1,063,476
$ 1,016,868
4.6 %
Percentage of Total Revenue6
57.2 %
58.2 %
56.0 %
57.8 %
Research and Development
45,110
39,411
14.5 %
126,615
120,192
5.3 %
Percentage of Total Revenue6
7.1 %
6.7 %
6.7 %
6.8 %
Selling, General, and Administrative
72,166
66,350
8.8 %
211,965
209,839
1.0 %
Percentage of Total Revenue6
11.3 %
11.3 %
11.2 %
11.9 %
OPERATING EXPENSES
481,198
446,347
7.8 %
1,402,056
1,346,899
4.1 %
OPERATING INCOME
$ 155,047
$ 138,740
11.8 %
$ 498,260
$ 413,017
20.6 %
Operating Margin6
24.4 %
23.7 %
26.2 %
23.5 %
Cost of revenue increased for the fiscal three months ended March 31, 2026, compared to the fiscal three months ended March 31, 2025, primarily due to higher personnel costs, including compensation and benefit costs, partially related to a headcount increase in the trailing twelve months, higher direct costs generally consistent with increases in related lines of revenue, as well as increased amortization of intangible assets.Cost of revenue increased for the fiscal nine months ended March 31, 2026, compared to the fiscal nine months ended March 31, 2025, primarily due to higher personnel costs, including compensation and benefit costs, partially related to a headcount increase in the trailing twelve months, higher direct costs generally consistent with increases in related lines of revenue, and increased amortization of intangible assets. Personnel cost increases over the prior year period were tempered by lower than normal medical claims earlier in the fiscal year.Research and development expense increased for the fiscal three and nine months ended March 31, 2026, compared to the fiscal three and nine months ended March 31, 2025, primarily due to higher personnel costs (net of capitalization), including compensation and benefit costs, partially related to a headcount increase in the trailing twelve months.Selling, general, and administrative expense increased for the fiscal three months ended March 31, 2026, compared to the fiscal three months ended March 31, 2025, primarily due to higher personnel costs, including compensation and benefit costs, partially related to a headcount increase in the trailing twelve months.Selling, general, and administrative expense increased for the fiscal nine months ended March 31, 2026, compared to the fiscal nine months ended March 31, 2025, primarily due to higher personnel costs, including compensation and benefit costs, partially related to a headcount increase in the trailing twelve months and the higher gain on assets, net, in the current fiscal year period of $5,267 compared to the prior fiscal year period. Personnel cost increases over the prior year period were tempered by lower than normal medical claims earlier in the fiscal year.
Net Income
(Unaudited, in thousands,
except per share data)
Three Months Ended
March 31,
% Change
Nine Months Ended
March 31,
% Change
2026
2025
2026
2025
Income Before Income Taxes
$ 158,541
$ 141,908
11.7 %
$ 513,052
$ 426,087
20.4 %
Provision for Income Taxes
35,647
30,800
15.7 %
121,503
97,943
24.1 %
NET INCOME
$ 122,894
$ 111,108
10.6 %
$ 391,549
$ 328,144
19.3 %
Diluted earnings per share
$ 1.71
$ 1.52
12.2 %
$ 5.41
$ 4.49
20.4 %
Effective tax rates for the fiscal three and nine months ended March 31, 2026, and 2025, were 22.5% and 23.7% and 21.7% and 23.0%, respectively.
According to Mimi Carsley, CFO and Treasurer, “During the third quarter, we delivered strong growth in several key revenue areas, including continued expansion in cloud revenue and solid performance from our faster payments products and digital offerings. We anticipate relative weakness to the year to date in fiscal Q4 non-GAAP revenue and margins consistent with previously stated expectations. Based on our positive outlook, we have increased our full year non-GAAP revenue, non-GAAP margin expansion, and GAAP EPS guidance.”
6Operating margin is calculated by dividing operating income by revenue. Operating margin plus operating expense components as a percentage of total revenue may not equal 100% due to rounding.
Impact of Non-GAAP Adjustments
The tables below show our revenue, operating income, and net income for the fiscal three and nine months ended March 31, 2026, compared to the fiscal three and nine months ended March 31, 2025, excluding the impacts of deconversions in the fiscal quarter and fiscal year-to-date periods ended March 31, 2026, and March 31, 2025, the acquisition in the current fiscal quarter and fiscal year-to-date period, the gain on assets, net, in the current fiscal year-to-date period, and the impact of a contract change in the prior fiscal quarter and fiscal year-to-date period.
(Unaudited, dollars in thousands)
Three Months Ended
March 31,
% Change
Nine Months Ended
March 31,
% Change
2026
2025
2026
2025
GAAP Revenue*
$ 636,245
$ 585,087
8.7 %
$ 1,900,316
$ 1,759,916
8.0 %
Adjustments:
Deconversion revenue
(18,665)
(9,644)
(33,504)
(13,410)
Revenue related to a contract change
—
(1,201)
—
(14,672)
Revenue from the acquisition
(1,651)
—
(3,595)
—
NON-GAAP ADJUSTED REVENUE*
$ 615,929
$ 574,242
7.3 %
$ 1,863,217
$ 1,731,834
7.6 %
GAAP Operating Income
$ 155,047
$ 138,740
11.8 %
$ 498,260
$ 413,017
20.6 %
Adjustments:
Operating income from deconversions
(14,635)
(6,851)
(25,337)
(9,724)
Operating income related to a contract change
—
(209)
—
(2,178)
Gain on assets, net
—
—
(6,829)
—
Operating loss from the acquisition
833
—
1,817
—
NON-GAAP ADJUSTED OPERATING INCOME
$ 141,245
$ 131,680
7.3 %
$ 467,911
$ 401,115
16.7 %
Non-GAAP Adjusted Operating Margin**
22.9 %
22.9 %
25.1 %
23.2 %
GAAP Net Income
$ 122,894
$ 111,108
10.6 %
$ 391,549
$ 328,144
19.3 %
Adjustments:
Net income from deconversions
(14,635)
(6,851)
(25,337)
(9,724)
Net income related to a contract change
—
(209)
—
(2,178)
Gain on assets, net
—
—
(6,829)
—
Net loss from the acquisition
833
—
1,817
—
Tax impact of adjustments***
3,313
1,694
7,284
2,857
NON-GAAP ADJUSTED NET INCOME
$ 112,405
$ 105,742
6.3 %
$ 368,484
$ 319,099
15.5 %
*GAAP revenue is comprised of services and support and processing revenues (see page 2). Services and support revenue less deconversion revenue for the three months ended March 31, 2026, and 2025, which was $18,665 for the current fiscal year quarter and $9,644 for the prior fiscal year quarter, and reducing the three months ended March 31, 2025, amount also for revenue related to a contractual change of $1,201, results in non-GAAP adjusted services and support revenue growth of 8.3% quarter over quarter. Processing revenue less revenue from the acquisition for the three months ended March 31, 2026, of $1,651, results in non-GAAP adjusted processing revenue growth of 6.0% quarter over quarter.
Services and support revenue less deconversion revenue for the nine months ended March 31, 2026, and 2025 which was $33,504 for the current fiscal year period and $13,410 for the prior fiscal year period, and reducing the nine months ended March 31, 2025, amount also for revenue related to a contractual change of $14,672, results in non-GAAP adjusted services and support revenue growth of 7.3% period over period. Processing revenue less revenue from the acquisition for the three months ended March 31, 2026, of $3,595, results in non-GAAP adjusted processing revenue growth of 7.9% period over period.
**Non-GAAP adjusted operating margin is calculated by dividing non-GAAP adjusted operating income by non-GAAP adjusted revenue.
***The tax impact of adjustments is calculated using a tax rate of 24% for the fiscal three and nine months ended March 31, 2026, and 2025. The tax rate for non-GAAP adjustment items takes a broad look at the Company’s recurring tax adjustments and applies them to non-GAAP revenue that does not have its own specific tax impacts.
The tables below show the segment break-out of revenue and cost of revenue for each period presented, as adjusted for the items above, and include a reconciliation to non-GAAP adjusted operating income presented above.
Three Months Ended March 31, 2026
(Unaudited, dollars in thousands)
Core
Payments
Complementary
Corporate
Services
Total
GAAP REVENUE
$ 195,448
$ 232,720
$ 187,489
$ 20,588
$ 636,245
Non-GAAP adjustments*
(7,506)
(7,574)
(5,054)
(182)
(20,316)
NON-GAAP ADJUSTED REVENUE
187,942
225,146
182,435
20,406
615,929
GAAP COST OF REVENUE
81,208
119,602
72,192
90,920
363,922
Non-GAAP adjustments*
(1,971)
(1,577)
(482)
(166)
(4,196)
NON-GAAP ADJUSTED COST OF REVENUE
79,237
118,025
71,710
90,754
359,726
GAAP SEGMENT INCOME
$ 114,240
$ 113,118
$ 115,297
$ (70,332)
Segment Income Margin**
58.5 %
48.6 %
61.5 %
(341.6) %
NON-GAAP ADJUSTED SEGMENT INCOME
$ 108,705
$ 107,121
$ 110,725
$ (70,348)
Non-GAAP Adjusted Segment Income Margin**
57.8 %
47.6 %
60.7 %
(344.7) %
Research and Development
45,110
Selling, General, and Administrative
72,166
Non-GAAP adjustments unassigned to a segment***
(2,318)
NON-GAAP TOTAL ADJUSTED OPERATING EXPENSES
474,684
NON-GAAP ADJUSTED OPERATING INCOME
$ 141,245
*Revenue non-GAAP adjustments for the Payments segment were ($1,651) of acquisition revenue and ($5,923) of deconversion revenue. Revenue non-GAAP adjustments for the remainder of the segments were deconversion revenue. Cost of revenue non-GAAP adjustments for the Payments segment were ($1,453) of acquisition costs and ($124) of deconversion costs. Cost of revenue non-GAAP adjustments for the Corporate Services segment were ($160) of acquisition costs and ($6) of deconversion costs. Cost of revenue non-GAAP adjustments for the remainder of the segments were deconversion costs.
**Segment income margin is calculated by dividing segment income by revenue for each segment. Non-GAAP adjusted segment income margin is calculated by dividing non-GAAP adjusted segment income by non-GAAP adjusted revenue for each segment.
***Non-GAAP adjustments unassigned to a segment were deconversion costs of $1,446, research and development costs related to the acquisition of $841, and selling, general, and administrative costs related to the acquisition of $31.
Three Months Ended March 31, 2025
(Unaudited, dollars in thousands)
Core
Payments
Complementary
Corporate
Services
Total
GAAP REVENUE
$ 179,052
$ 217,449
$ 172,442
$ 16,144
$ 585,087
Non-GAAP adjustments*
(6,039)
(2,394)
(2,324)
(88)
(10,845)
NON-GAAP ADJUSTED REVENUE
173,013
215,055
170,118
16,056
574,242
GAAP COST OF REVENUE
74,713
116,266
69,077
80,530
340,586
Non-GAAP adjustments*
(2,232)
(109)
(519)
(5)
(2,865)
NON-GAAP ADJUSTED COST OF REVENUE
72,481
116,157
68,558
80,525
337,721
GAAP SEGMENT INCOME
$ 104,339
$ 101,183
$ 103,365
$ (64,386)
Segment Income Margin**
58.3 %
46.5 %
59.9 %
(398.8) %
NON-GAAP ADJUSTED SEGMENT INCOME
$ 100,532
$ 98,898
$ 101,560
$ (64,469)
Non-GAAP Adjusted Segment Income Margin
58.1 %
46.0 %
59.7 %
(401.5) %
Research and Development
39,411
Selling, General, and Administrative
66,350
Non-GAAP adjustments unassigned to a segment***
(920)
NON-GAAP TOTAL ADJUSTED OPERATING EXPENSES
442,562
NON-GAAP ADJUSTED OPERATING INCOME
$ 131,680
*Revenue non-GAAP adjustments for the Core segment were ($1,201) of revenue related to the contractual change and ($4,838) of deconversion revenue. Revenue non-GAAP adjustments for the remainder of the segments were deconversion revenue. Cost of revenue non-GAAP adjustments for the Core segment were cost of revenue related to a contractual change of ($992) and ($1,240) of deconversion costs. Cost of revenue non-GAAP adjustments for the remainder of the segments were deconversion costs.
**Segment income margin is calculated by dividing segment income by revenue for each segment. Non-GAAP adjusted segment income margin is calculated by dividing non-GAAP adjusted segment income by non-GAAP adjusted revenue for each segment.
***Non-GAAP adjustments unassigned to a segment were deconversion costs.
Nine Months Ended March 31, 2026
(Unaudited, dollars in thousands)
Core
Payments
Complementary
Corporate
Services
Total
GAAP REVENUE
$ 576,841
$ 695,588
$ 563,414
$ 64,473
$ 1,900,316
Non-GAAP adjustments*
(13,775)
(14,399)
(8,632)
(293)
(37,099)
NON-GAAP ADJUSTED REVENUE
563,066
681,189
554,782
64,180
1,863,217
GAAP COST OF REVENUE
229,130
358,306
213,717
262,323
1,063,476
Non-GAAP adjustments*
(3,117)
(4,276)
(1,078)
(260)
(8,731)
NON-GAAP ADJUSTED COST OF REVENUE
226,013
354,030
212,639
262,063
1,054,745
GAAP SEGMENT INCOME
$ 347,711
$ 337,282
$ 349,697
$ (197,850)
Segment Income Margin**
60.3 %
48.5 %
62.1 %
(306.9) %
NON-GAAP ADJUSTED SEGMENT INCOME
$ 337,053
$ 327,159
$ 342,143
$ (197,883)
Non-GAAP Adjusted Segment Income Margin
59.9 %
48.0 %
61.7 %
(308.3) %
Research and Development
126,615
Selling, General, and Administrative
211,965
Non-GAAP adjustments unassigned to a segment***
1,981
NON-GAAP TOTAL ADJUSTED OPERATING EXPENSES
1,395,306
NON-GAAP ADJUSTED OPERATING INCOME
$ 467,911
*Revenue non-GAAP adjustments for the Payments segment were ($3,595) of acquisition revenue and ($10,804) of deconversion revenue. Revenue non-GAAP adjustments for the remainder of the segments were deconversion revenue. Cost of revenue non-GAAP adjustments for the Payments segment were ($3,863) of acquisition costs and ($413) of deconversion costs. Cost of revenue non-GAAP adjustments for the Corporate Services segment were ($253) of acquisition costs and ($7) of deconversion costs. Cost of revenue non-GAAP adjustments for the remainder of the segments were deconversion costs.
**Segment income margin is calculated by dividing segment income by revenue for each segment. Non-GAAP adjusted segment income margin is calculated by dividing non-GAAP adjusted segment income by non-GAAP adjusted revenue for each segment.
***Non-GAAP adjustments unassigned to a segment were a gain on assets, net, of $6,829 less deconversion costs of $3,551, research and development costs related to the acquisition of $1,213, and selling, general, and administrative costs related to the acquisition of $84.
Nine Months Ended March 31, 2025
(Unaudited, dollars in thousands)
Core
Payments
Complementary
Corporate
Services
Total
GAAP REVENUE
$ 544,948
$ 644,207
$ 514,454
$ 56,307
$ 1,759,916
Non-GAAP adjustments*
(20,777)
(4,341)
(2,857)
(107)
(28,082)
NON-GAAP ADJUSTED REVENUE
524,171
639,866
511,597
56,200
1,731,834
GAAP COST OF REVENUE
225,850
344,023
200,763
246,232
1,016,868
Non-GAAP adjustments*
(13,859)
(180)
(678)
(5)
(14,722)
NON-GAAP ADJUSTED COST OF REVENUE
211,991
343,843
200,085
246,227
1,002,146
GAAP SEGMENT INCOME
$ 319,098
$ 300,184
$ 313,691
$ (189,925)
Segment Income Margin**
58.6 %
46.6 %
61.0 %
(337.3) %
NON-GAAP ADJUSTED SEGMENT INCOME
$ 312,180
$ 296,023
$ 311,512
$ (190,027)
Non-GAAP Adjusted Segment Income Margin
59.6 %
46.3 %
60.9 %
(338.1) %
Research and Development
120,192
Selling, General, and Administrative
209,839
Non-GAAP adjustments unassigned to a segment***
(1,458)
NON-GAAP TOTAL ADJUSTED OPERATING EXPENSES
1,330,719
NON-GAAP ADJUSTED OPERATING INCOME
$ 401,115
*Revenue non-GAAP adjustments for the Core segment were ($14,672) of revenue related to the contractual change and ($6,105) of deconversion revenue. Revenue non-GAAP adjustments for the remainder of the segments were deconversion revenue. Cost of revenue non-GAAP adjustments for the Core segment were cost of revenue related to a contractual change of ($12,494) and ($1,365) of deconversion costs. Cost of revenue non-GAAP adjustments for the remainder of the segments were deconversion costs.
**Segment income margin is calculated by dividing segment income by revenue for each segment. Non-GAAP adjusted segment income margin is calculated by dividing non-GAAP adjusted segment income by non-GAAP adjusted revenue for each segment.
***Non-GAAP adjustments unassigned to a segment were deconversion costs.
The table below shows our GAAP to non-GAAP guidance for the fiscal year ending June 30, 2026. Fiscal year 2026 non-GAAP guidance excludes the impacts of deconversion revenue and related operating expenses, acquisition revenues and related operating expenses, the revenues and operating expenses related to a contractual change, and the gain on assets, net, and assumes no additional acquisitions or dispositions will be made during the fiscal year.
GAAP to Non-GAAP GUIDANCE (Dollars in
millions, except per share data)
Annual FY’26
Adjusted for
FY26
Comparison
Reported
Contractual
Change
Low
High
FY25
FY25
FY25
GAAP REVENUE
$ 2,521
$ 2,533
$ 2,375
$ 2,375
$ —
Growth
6.1 %
6.6 %
Deconversions*
37
37
34
34
—
Acquisition
5
5
—
—
—
Contractual change
—
—
16
—
16
NON-GAAP ADJUSTED REVENUE**
$ 2,479
$ 2,491
$ 2,326
$ 2,341
$ (16)
Non-GAAP Adjusted Growth
6.6 %
7.1 %
GAAP OPERATING EXPENSES
$ 1,899
$ 1,903
$ 1,807
$ 1,807
$ —
Growth
5.1 %
5.3 %
Deconversion costs*
12
12
6
6
—
Acquisition costs
8
8
—
—
—
Contractual change
—
—
14
—
14
Gain on assets, net
(7)
(7)
—
—
—
NON-GAAP ADJUSTED OPERATING EXPENSES**
$ 1,886
$ 1,890
$ 1,787
$ 1,800
$ (14)
Non-GAAP Adjusted Growth
5.6 %
5.8 %
GAAP OPERATING INCOME
$ 622
$ 630
$ 569
$ 569
$ —
Growth
9.3 %
10.7 %
GAAP OPERATING MARGIN
24.7 %
24.9 %
23.9 %
23.9 %
NON-GAAP ADJUSTED OPERATING INCOME**
$ 593
$ 601
$ 539
$ 541
$ (2)
Non-GAAP Adjusted Growth
10.1 %
11.5 %
NON-GAAP ADJUSTED OPERATING MARGIN
23.9 %
24.1 %
23.2 %
23.1 %
GAAP EPS
$ 6.78
$ 6.87
$ 6.24
$ 6.24
$ —
Growth
8.7 %
10.0 %
*Deconversion revenue and related operating expenses are based on actual results for fiscal nine months ended March 31, 2026, and estimates for the remainder of the fiscal year 2026. See the Company’s Form 8-K filed with the Securities and Exchange Commission on April 28, 2026.
**GAAP to Non-GAAP revenue, operating expenses, and operating income may not foot due to rounding.
Balance Sheet and Cash Flow Review
Cash and cash equivalents were $21 million at March 31, 2026, compared to $40 million at March 31, 2025.Trade receivables were $282 million at March 31, 2026, and March 31, 2025. The Company had $90 million of borrowings at March 31, 2026, compared to $170 million of borrowings at March 31, 2025.Deferred revenue was $209 million at March 31, 2026, compared to $222 million at March 31, 2025.Stockholders’ equity increased to $2,135 million at March 31, 2026, compared to $2,036 million at March 31, 2025.
*See table below for Net Cash Provided by Operating Activities and on page 14 for Return on Average Stockholders’ Equity. Tables reconciling the non-GAAP measures Free Cash Flow and Net Operating Profit After Tax Return on Invested Capital (NOPAT ROIC) to GAAP measures are on pages 14 and 15. See the Use of Non-GAAP Financial Information section below for the definitions of Free Cash Flow and NOPAT ROIC.
The following table summarizes net cash from operating activities:
(Unaudited, in thousands)
Nine Months Ended March 31,
2026
2025
Net income
$ 391,549
$ 328,144
Depreciation
31,238
33,125
Amortization
127,462
120,136
Change in deferred income taxes
100,347
(12,765)
Other non-cash expenses
21,512
22,411
Change in receivables
37,379
50,871
Change in deferred revenue
(154,631)
(167,104)
Change in other assets and liabilities*
(95,570)
(60,426)
NET CASH FROM OPERATING ACTIVITIES
$ 459,286
$ 314,392
*For the fiscal nine months ended March 31, 2026, the change in other assets and liabilities includes the change in prepaid expenses, deferred costs and other of $(61,680), accrued expenses of $(19,137), income taxes of $(8,383), and the change in accounts payable of $(6,370). For the fiscal nine months ended March 31, 2025, the change in other assets and liabilities includes the change in prepaid expenses, deferred costs and other of $(42,989), the change in accrued expenses of $(23,436), and the change in accounts payable of $(9,541) partially offset by the change in income taxes of $15,540.
The following table summarizes net cash from investing activities:
(Unaudited, in thousands)
Nine Months Ended March 31,
2026
2025
Payment for acquisitions
$ (42,390)
$ —
Capital expenditures
(46,616)
(41,186)
Proceeds from sale of assets
24,572
—
Purchased software
(2,998)
(3,833)
Computer software developed
(140,003)
(130,298)
Purchase of investments
(13,710)
(2,000)
Proceeds from investments
1,000
1,000
NET CASH FROM INVESTING ACTIVITIES
$ (220,145)
$ (176,317)
The following table summarizes net cash from financing activities:
(Unaudited, in thousands)
Nine Months Ended March 31,
2026
2025
Borrowings on credit facilities
$ 360,000
$ 255,000
Repayments on credit facilities
(270,000)
(235,000)
Purchase of treasury stock
(284,414)
(35,052)
Dividends paid
(127,457)
(122,464)
Net cash from issuance of stock and tax related to stock-based compensation
1,350
1,027
NET CASH FROM FINANCING ACTIVITIES
$ (320,521)
$ (136,489)
Use of Non-GAAP Financial Information
Generally Accepted Accounting Principles (GAAP) is the term used to refer to the standard framework of guidelines for financial accounting in the United States. GAAP includes the standards, conventions, and rules accountants follow in recording and summarizing transactions in the preparation of financial statements. In addition to reporting financial results in accordance with GAAP, we have provided certain non-GAAP financial measures, including adjusted revenue, adjusted segment revenue, adjusted operating income, adjusted segment income, adjusted cost of revenue, adjusted segment cost of revenue, adjusted operating expenses, adjusted operating margin, adjusted segment income margin, non-GAAP earnings before interest, taxes, depreciation, and amortization (non-GAAP EBITDA), free cash flow, net operating profit after tax return on invested capital (NOPAT ROIC), and non-GAAP adjusted net income.
We believe non-GAAP financial measures help investors better understand the underlying fundamentals and true operations of our business. Adjusted revenue, adjusted segment revenue, adjusted operating income, adjusted operating margin, adjusted segment income, adjusted segment income margin, adjusted cost of revenue, adjusted segment cost of revenue, adjusted operating expenses, and adjusted net income eliminate one-time deconversion revenue and associated costs, the gain on assets, net, an acquisition, and a contractual change, which management believes are not indicative of the Company’s operating performance. Such adjustments give investors further insight into our performance. Non-GAAP EBITDA is defined as net income attributable to the Company before the effect of interest income, net, taxes, depreciation, and amortization, adjusted for net income before the effect of interest income, net, taxes, depreciation, and amortization attributable to eliminated one-time deconversions, the gain on assets, net, an acquisition, and a contractual change. Free cash flow is defined as net cash from operating activities, less capitalized expenditures, internal use software, and capitalized software, plus proceeds from the sale of assets. NOPAT ROIC is defined as operating income for the trailing four quarters multiplied by one minus the average effective tax rate (ETR) for the trailing four quarters, with the result divided by average invested capital (average of the beginning and ending period balances). Management believes that non-GAAP EBITDA is an important measure of the Company’s overall operating performance and excludes certain costs and other transactions that management deems one time or non-operational in nature; free cash flow is useful to measure the funds generated in a given period that are available for debt service requirements and strategic capital decisions; and NOPAT ROIC is a measure of the Company’s allocation efficiency and effectiveness of its invested capital. For these reasons, management also uses these non-GAAP financial measures in its assessment and management of the Company’s performance.
Non-GAAP financial measures used by the Company may not be comparable to similarly titled non-GAAP measures used by other companies. Non-GAAP financial measures have no standardized meaning prescribed by GAAP and therefore, are unlikely to be comparable with calculations of similar measures for other companies.
Any non-GAAP financial measures should be considered in context with the GAAP financial presentation and should not be considered in isolation or as a substitute for GAAP measures. Reconciliations of the non-GAAP financial measures to related GAAP measures are included.
About Jack Henry & Associates, Inc.®
Jack Henry® (Nasdaq: JKHY) is a well-rounded financial technology company that strengthens connections between financial institutions and the people and businesses they serve. We are an S&P 500 company that prioritizes openness, collaboration, and user centricity — offering banks and credit unions a vibrant ecosystem of internally developed modern capabilities as well as the ability to integrate with leading fintechs. For 50 years, Jack Henry has provided technology solutions to enable clients to innovate faster, strategically differentiate, and successfully compete while serving the evolving needs of their accountholders. We empower approximately 7,400 clients with people-inspired innovation, personal service, and insight-driven solutions that help reduce the barriers to financial health. Additional information is available at www.jackhenry.com.
Statements made in this news release that are not historical facts are “forward-looking statements” within the meaning of the Private Securities Litigation Reform Act of 1995, Section 27A of the Securities Act of 1933 and Section 21E of the Securities Exchange Act of 1934. Because forward-looking statements relate to the future, they are subject to inherent risks and uncertainties that could cause actual results to differ materially from those expressed or implied by such statements. Such risks and uncertainties include, but are not limited to, those discussed in the Company’s Securities and Exchange Commission filings, including the Company’s most recent reports on Form 10-K and Form 10-Q, particularly under the heading Risk Factors. Any forward-looking statement made in this news release speaks only as of the date of the news release, and the Company expressly disclaims any obligation to publicly update or revise any forward-looking statement, whether because of new information, future events or otherwise.
Quarterly Conference Call
The Company will hold a conference call on May 6, 2026, at 7:45 a.m. Central Time, and investors are invited to listen at www.jackhenry.com. A webcast replay will be available approximately one hour after the event at ir.jackhenry.com/corporate-events-and-presentations and will remain available for one year.
Condensed Consolidated Statements of Income (Unaudited)
(Dollars in thousands, except per share data)
Three Months Ended March 31,
% Change
Nine Months Ended March 31,
% Change
2026
2025
2026
2025
REVENUE
$ 636,245
$ 585,087
8.7 %
$ 1,900,316
$ 1,759,916
8.0 %
Cost of Revenue
363,922
340,586
6.9 %
1,063,476
1,016,868
4.6 %
Research and Development
45,110
39,411
14.5 %
126,615
120,192
5.3 %
Selling, General, and Administrative
72,166
66,350
8.8 %
211,965
209,839
1.0 %
EXPENSES
481,198
446,347
7.8 %
1,402,056
1,346,899
4.1 %
OPERATING INCOME
155,047
138,740
11.8 %
498,260
413,017
20.6 %
Interest income
4,869
5,899
(17.5) %
18,194
21,406
(15.0) %
Interest expense
(1,375)
(2,731)
(49.7) %
(3,402)
(8,336)
(59.2) %
Interest Income, net
3,494
3,168
10.3 %
14,792
13,070
13.2 %
INCOME BEFORE INCOME TAXES
158,541
141,908
11.7 %
513,052
426,087
20.4 %
Provision for Income Taxes
35,647
30,800
15.7 %
121,503
97,943
24.1 %
NET INCOME
$ 122,894
$ 111,108
10.6 %
$ 391,549
$ 328,144
19.3 %
Diluted net income per share
$ 1.71
$ 1.52
$ 5.41
$ 4.49
Diluted weighted average shares outstanding
71,978
73,013
72,433
73,058
Consolidated Balance Sheet Highlights (Unaudited)
(In thousands)
March 31,
% Change
2026
2025
Cash and cash equivalents
$ 20,573
$ 39,870
(48.4) %
Receivables
282,463
282,162
0.1 %
Total assets
3,050,557
2,932,018
4.0 %
Accounts payable and accrued expenses
$ 212,133
$ 201,389
5.3 %
Current and long-term debt
90,000
170,000
(47.1) %
Deferred revenue
208,742
221,828
(5.9) %
Stockholders’ equity
2,134,811
2,036,431
4.8 %
Calculation of Non-GAAP Earnings Before Interest Income, Net, Income Taxes, Depreciation and Amortization (Non-GAAP EBITDA)
Three Months Ended March 31,
% Change
Nine Months Ended March 31,
% Change
(Dollars in thousands)
2026
2025
2026
2025
Net income
$ 122,894
$ 111,108
$ 391,549
$ 328,144
Net interest
(3,494)
(3,168)
(14,792)
(13,070)
Taxes
35,647
30,800
121,503
97,943
Depreciation and amortization
53,653
51,013
158,700
153,261
Less: Net income before interest expense, taxes, depreciation and amortization attributable to eliminated one-time adjustments*
(14,275)
(7,060)
(31,290)
(11,901)
NON-GAAP EBITDA
$ 194,425
$ 182,693
6.4 %
$ 625,670
$ 554,377
12.9 %
*The fiscal third quarter 2026 and 2025 adjustments for net income before interest expense, taxes, depreciation and amortization were for deconversions of ($14,636) and an acquisition of $361, and were for deconversions of $6,851 and a contract change of $209, respectively. The fiscal year-to-date 2026 and 2025 adjustments were for deconversions of ($25,337), a gain on assets, net, of ($6,829), and an acquisition of $876, and were for deconversions of ($9,723) and a contractual change of ($2,178), respectively.
Calculation of Free Cash Flow (Non-GAAP)
Nine Months Ended March 31,
(In thousands)
2026
2025
Net cash from operating activities
$ 459,286
$ 314,392
Capitalized expenditures
(46,616)
(41,186)
Internal use software
(2,998)
(3,833)
Proceeds from sale of assets
24,572
—
Capitalized software
(140,003)
(130,298)
FREE CASH FLOW
$ 294,241
$ 139,075
Net income
$ 391,549
$ 328,144
Operating cash conversion*
117.3 %
95.8 %
Free cash flow conversion (excluding proceeds from sale of assets)*
68.9 %
42.4 %
*Operating cash conversion is net cash from operating activities divided by net income. Free cash flow conversion is free cash flow less proceeds from sale of assets of $24,572 for fiscal 2026 and $0 for fiscal 2025 divided by net income.
Calculation of the Return on Average Stockholders’ Equity
March 31,
(In thousands)
2026
2025
Net income (trailing four quarters)
$ 519,153
$ 429,217
Average stockholder’s equity (period beginning and ending balances)
2,085,621
1,908,181
RETURN ON AVERAGE STOCKHOLDERS’ EQUITY
24.9 %
22.5 %
Calculation of NOPAT ROIC (Non-GAAP)
March 31,
(In thousands)
2026
2025
Operating income (trailing four quarters)
$ 653,957
$ 538,644
Average Effective Tax Rate (trailing four quarters)
22.8 %
22.8 %
NOPAT operating income (trailing four quarters)*
504,855
415,833
Average invested capital (period beginning and ending balances)
2,215,621
2,118,181
NOPAT ROIC
22.8 %
19.6 %
*NOPAT operating income is calculated by multiplying the trailing four quarters operating income by one minus the average ETR. NOPAT ROIC is calculated by dividing NOPAT operating income by average invested capital (period beginning and ending balances).
FAQ for Analysts / Investors
1.) Why does fiscal 2025 non-GAAP revenue used for growth calculation not match reported fiscal 2025 non-GAAP revenue?
The restructuring of a third-party agreement has resulted in a $16 million fiscal year-over-year revenue headwind, with $12 million of that coming in the first quarter and $3 million additional in the second and third quarters.The remaining $1 million is expected to impact the fourth quarter.This restructuring has also resulted in a decrease in the related costs and the impact on margins is expected to be minimal.This has been adjusted for a consistent fiscal year-over-year comparison and is included in our fiscal year 2026 guidance (see page 9).
2.) What are some key elements of the outlook for the fourth quarter of fiscal 2026?
We expect the year-over-year revenue growth rates to slow slightly as we face overall tougher prior year comparables from the fourth quarter of fiscal 2025.We expect some contraction in margins in the fourth quarter of fiscal 2026 compared to the fiscal year-to-date period margins that positively benefited from lower than normal expense for medical claims under our self-insured employee healthcare plan, especially during the first and second quarters.
View original content to download multimedia:https://www.prnewswire.com/news-releases/jack-henry–associates-inc-reports-third-quarter-fiscal-2026-results-302763219.html
SOURCE Jack Henry & Associates, Inc.

You may like
Technology
BTQ Technologies’ QSSN Selected as Core Security Infrastructure for South Korea’s First Bank-Led KRW Stablecoin Proof-of-Concept
Published
11 hours agoon
May 6, 2026By

BTQ provides strategic advisory support and QSSN as core PQC security infrastructure for the iM Bank initiative on the Kaia mainnet, advancing post-quantum migration across global financial infrastructure
BTQ has been selected as the core post-quantum cryptography security technology provider for South Korea’s first bank-led KRW stablecoin proof-of-concept, delivering its Quantum Secure Stablecoin Settlement Network (“QSSN”) for the initiative.
BTQ is providing strategic advisory support and helping coordinate implementation across the partnership with iM Bank and Finger, supporting the integration of post-quantum protections into regulated digital money infrastructure.
Built on the Kaia mainnet, the proof-of-concept is connected to the blockchain ecosystems originally developed by Kakao and LINE, linking the initiative to two of the largest messaging and digital platform ecosystems in Korea and Japan.
VANCOUVER, BC, May 6, 2026 /PRNewswire/ – BTQ Technologies Corp. (“BTQ” or the “Company”) (Nasdaq: BTQ) (CBOE CA: BTQ), a global quantum technology company focused on securing mission-critical networks, today announced that it it has been selected as the core PQC security technology provider through its Quantum Secure Stablecoin Settlement Network (“QSSN”) in a proof-of-concept with its Korean strategic partner, Finger Inc. (“Finger”), and iM Bank, a leading Korean commercial bank, for South Korea’s first bank-led Korean won stablecoin infrastructure incorporating post-quantum cryptography (“PQC”).
The proof-of-concept represents more than a technical pilot. It marks an important step in bringing next-generation quantum security into banking infrastructure within Korea’s regulated financial system. In addition to providing QSSN as the core PQC security framework, BTQ is contributing consulting and strategic coordination across the three-way partnership, helping align the project’s security architecture, implementation approach, and long-term post-quantum migration objectives.
“Post-quantum migration requires more than a cryptographic upgrade. It requires coordination across infrastructure, implementation, and institutional stakeholders,” said Olivier Roussy Newton, Chief Executive Officer of BTQ Technologies. “In this initiative, BTQ is providing both strategic advisory support and QSSN as the post-quantum security architecture, while helping lead coordination across the three-way partnership. We believe this proof-of-concept demonstrates how financial institutions can begin integrating quantum-resilient protections into digital money systems in a practical and operationally viable way.”
South Korea’s First Bank-Led PQC Stablecoin Infrastructure Initiative
BTQ is working alongside iM Bank and Finger on a three-way initiative to validate the issuance and distribution infrastructure for a Korean won stablecoin. In addition to supplying QSSN as the PQC security layer, BTQ is providing consulting support and helping to guide coordination across the partnership as the parties evaluate how to integrate post-quantum protections into bank-led digital asset infrastructure.
The proof-of-concept will validate several key components, including real-time reconciliation between bank reserves and blockchain-issued supply, a global-standard smart contract architecture, connectivity to global infrastructure for overseas distribution, and the integration of a PQC-based dual-signature security structure. By applying BTQ’s PQC signature architecture alongside the existing ECDSA cryptographic framework, the system is designed to preserve operational continuity for financial institutions while proactively addressing future quantum computing threats.
Built on Kaia Mainnet
A notable feature of the proof-of-concept is that it will be implemented on the Kaia mainnet, one of Korea’s leading Layer 1 blockchain networks. Kaia was created through the merger of Klaytn, the blockchain originally developed by Kakao, and Finschia, the blockchain associated with LINE. Kakao and LINE sit at the center of two of the largest messaging and digital platform ecosystems in Korea and Japan, respectively, making Kaia a significant piece of regional digital infrastructure.
Klaytn previously participated in the Bank of Korea’s CBDC pilot ecosystem, and the Bank of Korea has continued to advance CBDC testing through initiatives such as Project Hangang.
By combining BTQ’s PQC technology with blockchain infrastructure tied to the Kakao and LINE ecosystems, the proof-of-concept is intended to establish a model that aligns institutional-grade security, blockchain scalability, and evolving regulatory requirements for digital money infrastructure.
QSSN as the Security Layer
The PQC security foundation for the initiative is BTQ’s Quantum Secure Stablecoin Settlement Network, or QSSN, a quantum-secure network architecture designed for stablecoin, tokenized deposit, payment, and digital asset infrastructure. QSSN is designed to protect critical issuer functions, including stablecoin issuance, burning, transfer authority, upgrade control, and administrative permissions, by integrating PQC-based signatures while maintaining existing user experience and operational workflows.
BTQ has previously announced that QSSN was highlighted in the U.S. Post-Quantum Financial Infrastructure Framework (“PQFIF”) as a model architecture for post-quantum digital money infrastructure. The Company has also positioned QSSN as a standards-oriented initiative advanced through QuINSA and aligned with emerging post-quantum financial infrastructure requirements.
Addressing the Harvest-Now, Decrypt-Later Risk
The timing of the proof-of-concept reflects the growing urgency surrounding the “Harvest-Now, Decrypt-Later” risk, in which attackers may collect encrypted financial data today and decrypt it later once sufficiently advanced quantum capabilities emerge. Global institutions are already accelerating post-quantum migration. The U.S. National Institute of Standards and Technology (“NIST”) has finalized its first set of post-quantum cryptography standards, including ML-DSA, ML-KEM, and SLH-DSA, while major technology companies and financial institutions continue to define their own post-quantum transition timelines.
BTQ’s QSSN addresses this challenge through a dual-signature design that allows existing ECDSA-based infrastructure to operate in parallel with NIST-aligned PQC signatures such as ML-DSA. This approach enables banks and payment infrastructure providers to begin a phased transition toward quantum-safe security without disrupting existing systems.
Expanding BTQ’s Korean Ecosystem
BTQ continues to expand its Korean ecosystem across digital assets, payments, banking infrastructure, and hardware-based security. In October 2025, BTQ announced that Finger had joined Danal as an early participant in BTQ’s QSSN pilot program, with the initiative expected to progress from proof-of-concept toward commercialization under QuINSA-aligned guidelines and broader industry frameworks such as PQFIF.
The commencement of the iM Bank proof-of-concept represents an important commercial signal for BTQ, indicating that demand for post-quantum migration among Korean financial institutions is beginning to move from policy discussion toward infrastructure-level implementation. As Korea advances both quantum technology policy and stablecoin-related regulatory discussions, BTQ believes QSSN is well positioned at the intersection of regulated finance, digital asset infrastructure, and post-quantum security.
About iM Bank
iM Bank is a South Korean commercial bank and a subsidiary of DGB Financial Group. Headquartered in Daegu, iM Bank presents itself as a financial companion for customers and traces its roots to Daegu Bank, which was established in 1967 as Korea’s first regional bank. For more information, please visit https://www.imbank.co.kr/
About Finger Inc. Group
Finger supplies and develops financial IT solutions to provide optimized money management strategies for employees and corporate customers. Providing “Smartphone Financial Services”, “Corporate Cash Management Services” for businesses, “Private Wealth Management Services” for private consumers.
Since the year 2000, Finger has accumulated a number of awards and patents regarding its businesses. Based on its Mobile Enterprise Application Platform(MEAP) Orchestra and its funds management system using screen-scrapping technologies, Finger was the first company in Korea to deliver a smartphone banking banking-service. For more information, please visit http://www.finger.co.kr/
About BTQ
BTQ Technologies Corp. (Nasdaq: BTQ | Cboe CA: BTQ) is a quantum technology company focused on accelerating the transition from classical networks to the quantum internet. Backed by a broad patent portfolio and deep technical expertise, BTQ is advancing a full-stack, neutral-atom quantum computing platform spanning hardware, middleware, and post-quantum security solutions for finance, telecommunications, logistics, life sciences, and defense.
Connect with BTQ: Website | LinkedIn | X/Twitter
ON BEHALF OF THE BOARD OF DIRECTORS
Olivier Roussy Newton
CEO, Chairman
Neither Cboe Canada nor its Regulation Services Provider accepts responsibility for the adequacy or accuracy of this release.
Forward Looking Information
Certain statements herein contain forward-looking statements and forward-looking information within the meaning of applicable securities laws. Such forward-looking statements or information include but are not limited to statements or information with respect to the business plans of the Company, including with respect to its research partnerships, and anticipated markets in which the Company may be listing its common shares. Forward-looking statements or information often can be identified by the use of words such as “anticipate”, “intend”, “expect”, “plan” or “may” and the variations of these words are intended to identify forward-looking statements and information.
The Company has made numerous assumptions including among other things, assumptions about general business and economic conditions, the development of post-quantum algorithms and quantum vulnerabilities, and the quantum computing industry generally. The foregoing list of assumptions is not exhaustive.
Although management of the Company believes that the assumptions made and the expectations represented by such statements or information are reasonable, there can be no assurance that forward-looking statements or information herein will prove to be accurate. Forward-looking statements and information are based on assumptions and involve known and unknown risks which may cause actual results to be materially different from any future results, expressed or implied, by such forward-looking statements or information. These factors include risks relating to: the availability of financing for the Company; business and economic conditions in the post-quantum and encryption computing industries generally; the speculative nature of the Company’s research and development programs; the supply and demand for labour and technological post-quantum and encryption technology; unanticipated events related to regulatory and licensing matters and environmental matters; changes in general economic conditions or conditions in the financial markets; changes in laws (including regulations respecting blockchains); risks related to the direct and indirect impact of COVID-19 including, but not limited to, its impact on general economic conditions, the ability to obtain financing as required, and causing potential delays to research and development activities; and other risk factors as detailed from time to time. The Company does not undertake to update any forward-looking information, except in accordance with applicable securities laws.
View original content to download multimedia:https://www.prnewswire.com/news-releases/btq-technologies-qssn-selected-as-core-security-infrastructure-for-south-koreas-first-bank-led-krw-stablecoin-proof-of-concept-302763840.html
SOURCE BTQ Technologies Corp.
Technology
Zimmer Biomet to Present at the BofA Securities 2026 Health Care Conference
Published
11 hours agoon
May 6, 2026By
WARSAW, Ind., May 6, 2026 /PRNewswire/ — Zimmer Biomet Holdings, Inc. (NYSE and SIX: ZBH), a global medical technology leader, today announced that members of the Zimmer Biomet management team will participate in the Bank of America Securities Health Care Conference on Wednesday, May 13, 2026, with a fireside chat at 8:40 a.m. PT (11:40 a.m. ET).
A live audio webcast can be accessed via Zimmer Biomet’s Investor Relations website at https://investor.zimmerbiomet.com. It will be available for replay following the fireside chat.
About Zimmer Biomet
Zimmer Biomet is a global medical technology leader with a comprehensive portfolio designed to maximize mobility and improve health. We seamlessly transform the patient experience through our innovative products and suite of integrated digital and robotic technologies that leverage data, data analytics and artificial intelligence.
With 90+ years of trusted leadership and proven expertise, Zimmer Biomet is positioned to deliver the highest quality solutions to patients and providers. Our legacy continues to come to life today through our progressive culture of evolution and innovation.
For more information about our product portfolio, our operations in 25+ countries and sales in 100+ countries or about joining our team, visit www.zimmerbiomet.com or follow on LinkedIn at www.linkedin.com/company/zimmerbiomet or X at www.x.com/zimmerbiomet.
Contacts:
Media
Investors
Troy Kirkpatrick
David DeMartino
614-284-1926
646-531-6115
troy.kirkpatrick@zimmerbiomet.com
david.demartino@zimmerbiomet.com
Kirsten Fallon
Zach Weiner
781-779-5561
908-591-6955
View original content to download multimedia:https://www.prnewswire.com/news-releases/zimmer-biomet-to-present-at-the-bofa-securities-2026-health-care-conference-302763299.html
SOURCE Zimmer Biomet Holdings, Inc.
Technology
NextLadder Ventures Announces Co-Founder Leadership Team, Investment Focus Areas For Over $1 Billion Initiative Empowering Americans with Personalized, Tech-Enabled Support Tools
Published
11 hours agoon
May 6, 2026By
New senior hires from Google and The Collaborative Fund to lead product strategy and venture investing
Fund unveils first investment focus areas to catalyze new ‘Navigation Technology’ market, equipping Americans with cutting-edge tools to achieve economic security, opportunity and empowerment
ST. LOUIS, May 6, 2026 /PRNewswire/ — NextLadder Ventures, a new fund backed by more than $1 billion in capital, today announced its priority investment areas for building a new market for “Navigation Technology” (NavTech) — tools that provide Americans with personalized solutions to navigate life’s challenges and achieve greater economic mobility — and announced its co-founding team, including two new senior hires.
The fund’s active focus areas are based on extensive research identifying the key experiences and high-stakes decision points that have an outsized impact on American families’ economic mobility. Launched investment areas include financial health, career navigation, and benefits and social services access, with further exploration underway around housing, legal aid, justice and re-entry, and mental and physical health.
The organization is also today welcoming two senior leaders: Lauren Loktev is joining NextLadder as Managing Director of Investments and Brigitte Hoyer Gosselink as Managing Director of Product. Loktev was most recently a partner at the Collaborative Fund, where she backed several breakout companies in early child development, education, and sustainability. Gosselink comes to NextLadder from Google, where she led the company’s AI and social impact portfolio. They join a growing team which has deep expertise at the intersection of economic mobility, technology, public policy, and philanthropy.
NextLadder’s Focus Areas for Investment
Today, the fund is kicking off a plan to deploy $1 billion over the next seven years to accelerate the design, development, and deployment of accessible NavTech tools that aim to help families more successfully navigate the major life experiences that determine whether they get ahead or fall behind. As NextLadder’s inaugural frontier AI lab partner, Anthropic is supporting the build-out of the organization’s AI-native capabilities and is offering technical assistance to NextLadder’s portfolio organizations.
As an increasing proportion of Americans across income levels find themselves overextended and overwhelmed, NavTech tools are designed to help individuals and families understand their options, connect to information and resources, and take action to recover from a setback or take advantage of an opportunity and reclaim their economic futures.
“Life is getting harder, and too many Americans are stuck facing some of the most complex and consequential moments of their lives without much support,” said Ryan Rippel, CEO of NextLadder Ventures. “Every day, millions in this country face fork-in-the-road decisions that have major implications on whether they climb up the economic ladder or fall farther behind. AI has understandably intensified many Americans’ anxieties about their jobs and their security in the economy. But these technologies are now also making it possible to deliver highly personalized, affordable tools to meet the needs of tens of millions of Americans in a way that has never been practically achievable or financially viable before. With NavTech tools, built for the reality of families’ everyday experiences, we can empower Americans to overcome setbacks, navigate life’s toughest financial decisions, and build more secure futures.”
NavTech tools, built with the needs of individuals, families, and trusted community partners at the center of their design, have the potential to ease burdens most acutely faced by 90 million Americans who live in households that have difficulty in paying for usual home expenses, and turbocharge the capacity of the 1.6 million community workers in non-profit or local, state, and federal government roles who serve them. This growing category of digital technologies includes tools that help families access opportunities such as personalized financial advice and legal aid, get connected with available resources and programs, and manage unexpected hurdles like losing a job or facing an eviction – while freeing social workers and service providers to spend more time on people and less time on red tape and paperwork.
The fund’s active investment areas include:
Financial Health: Developing highly personalized, AI-powered financial health tools that can provide tailored, sustained counsel to help users build savings and protect and recover from financial shocks;
Career Navigation: Building tools to support career navigation, manage and support career transitions, and help workers, case managers, and employers identify pathways to living wage work — all designed to help people successfully find the right jobs for them.
Benefits & Social Services Access: Helping eligible Americans seamlessly identify and enroll in all the benefits and social services available to them, particularly those that support career navigation and transitions, help them navigate critical life moments, and achieve stability toward economic opportunity.
NextLadder is exploring additional focus areas, including housing, legal aid, justice and re-entry, caregiving, and mental and physical health. More on the organization’s vision of these focus areas is available HERE.
In addition to backing direct NavTech solutions, NextLadder is investing in the developers, partners, and standards required to build a durable, self-sustaining market. Across all focus areas, the fund is prioritizing efforts to ensure NavTech tools are reliable, protect users’ privacy, and are trusted by the families who depend on them.
NextLadder’s Co-Founder Leadership Team
NextLadder’s five co-founders will be CEO Ryan Rippel, Chief Strategy and Operations Officer Rhett Dornbach-Bender, Chief of Staff Callie Schwartz, and the two new senior hires: Managing Director of Investments Lauren Loktev and Managing Director of Product Brigitte Hoyer Gosselink, rounding out the fund’s expertise in investing, technology, and impact.
“We’re thrilled to welcome Lauren and Brigitte to the NextLadder team,” said Rippel. “Brigitte has spent her career proving that when applied purposefully, AI and technology can deliver meaningful benefits for communities, and she’ll set the bar for what NavTech tools can deliver for American families today and in the years to come. And with her deep experience backing mission-driven founders, Lauren is the perfect leader to build our venture practice from the ground up and accelerate the growth of the NavTech field. With this team in place, we’re positioned to make NavTech tools easier to build, fund, and access so they reach the people who need them most.”
Loktev brings 15 years of venture capital experience investing at the intersection of for-profit and for-good. Most recently at Collaborative Fund, she backed several companies to significant scale and launched Collab+Sesame, a first-of-its-kind thematic seed fund in partnership with Sesame Workshop focused on early childhood education. At NextLadder, she will build and lead the fund’s venture practice, sourcing and scaling investments in the founders building the next generation of NavTech tools.
“We have a once in a generation opportunity to help steer AI solutions toward those who need them most,” said Loktev. “Many amazing, accomplished founders see this too, and they are on a mission to build scalable, transformative businesses in the critical verticals that help people navigate life-changing moments. I couldn’t be more excited to join NextLadder and to support the most inspiring leaders building this market from the ground up. Thanks to our unique, long-term mandate, we can be creative and flexible in investing across stage and check size to partner with the entrepreneurs and leaders we believe will change the world.”
Prior to her role at NextLadder, Gosselink spent over a decade at Google in several roles including Director of AI and Social Impact, directing more than $500 million in funding for organizations applying AI to address challenges including crisis response, education, and economic opportunity. At NextLadder, she will lead AI and product strategy across the fund’s portfolio, backing solutions and setting market-wide standards for how NavTech tools are designed, evaluated, and improved over time.
“If we collectively harness the AI transformation strategically and purposefully, we can transform the way Americans are empowered to access greater economic mobility,” said Gosselink. “We believe that people-centered products, combined with shifts in the market and the services available to families, can fundamentally reshape how millions of Americans navigate critical moments and achieve prosperity on their own terms.”
To request interviews from the NextLadder Ventures leadership team, contact media@nextladder.com.
About NextLadder Ventures
NextLadder Ventures is a time-bound venture with one goal: empower millions of Americans to reach their potential by 2040. Backed by over $1 billion in capital, the organization invests in breakthrough technologies that remove barriers to economic success and put people in control of their futures. NextLadder Ventures is trailblazing a new market for tech-enabled Navigation Technology tools that help people access the resources they need to navigate pivotal moments — offering flexible, risk-tolerant capital to entrepreneurs building these transformative tools today, while creating a pipeline of tech, talent, and capital for the long run.
SOURCE NextLadder Ventures

Bitcoin market dominance moves above 61%: Will altcoins follow?

US Senator says crypto market structure vote could happen by August
Crypto-backed Republican candidate wins Indiana congressional primary
Send Rakhi to UK swiftly with UK Gifts Portal

Whiteboard Series with NEAR | Ep: 45 Joel Thorstensson from ceramic.network

New Gooseneck Omni Antennas Offer Enhanced Signals in a Durable Package

Why You Should Build on #NEAR – Co-founder Illia Polosukhin at CV Labs
Whiteboard Series with NEAR | Ep: 45 Joel Thorstensson from ceramic.network

NEAR End of Year Town Hall 2021: The Open Web World, MetaBUILD 2 Hackathon and 2021 recap
Trending
-
Coin Market5 days ago
Bitcoin rally extends, yet BTC options price only 25% chance of $84K in May
-
Coin Market5 days ago
CLARITY Act stablecoin yield rules finalised: ‘Go time’ for crypto bill
-

 Technology5 days ago
2026 Brockton High School Film Festival
-
 Technology5 days ago
First Online Conversations Are Changing in 2026, According to New Secretmeet Research
-

 Technology4 days ago
POVADDO AND PROLEGIS ANNOUNCE STRATEGIC PARTNERSHIP TO EXPAND ACCESS TO PUBLIC POLICY PROFESSIONALS FOR OPINION RESEARCH
-

 Technology4 days ago
POVADDO AND PROLEGIS ANNOUNCE STRATEGIC PARTNERSHIP TO EXPAND ACCESS TO PUBLIC POLICY PROFESSIONALS FOR OPINION RESEARCH
-
 Technology5 days ago
/C O R R E C T I O N — Applied Intuition, Inc./
-
Coin Market4 days ago
Riot posts $167M in Q1 revenue as data center arm pulls in $33M in first quarter