Technology
Gamehaus Holdings Inc. Announces Unaudited Financial Results for the Third Quarter of Fiscal 2026 Ended March 31, 2026
Published
5 months agoon
By
SHANGHAI, June 8, 2026 /PRNewswire/ — Gamehaus Holdings Inc. (“Gamehaus” or the “Company”) (Nasdaq: GMHS), a technology-driven mobile game publisher, today announced its unaudited financial results for the third quarter of fiscal year 2026 ended March 31, 2026.
Third Quarter of Fiscal Year 2026 Financial Highlights
Total revenue was US$26.2 million, representing a 9.1% decrease from US$28.8 million in the third quarter of fiscal year 2025. In-app purchases contributed US$23.4 million, while advertising revenue reached US$2.8 million.Total operating costs and expenses were US$25.7 million, representing a 10.1% reduction from US$28.5 million in the third quarter of fiscal year 2025.Net income was US$0.5 million, representing a 16.4% increase from US$0.4 million in the third quarter of fiscal year 2025.
Third Quarter of Fiscal Year 2026 Operating Highlights
in thousands, except percentages
For the Three Months Ended
March 31,
2026
2025
Average MAUs[1]
3,107
3,782
Average DAUs[2]
506
674
ARPDAU[3]
0.550
0.485
Average DPUs[4]
12
15
Average Daily Payer Conversion Rate[5]
2.4
%
2.2
%
Average 7D Retention Rate[6]
8.5
%
9.9
%
[1] Average Monthly Active Users, or Average MAUs, is defined as the number of individual users who play a game during a particular month.
[2] Average Daily Active Users, or Average DAUs, is defined as the number of individual users who play a game on a particular day.
[3] Average Revenue Per Daily Active User, or ARPDAU, is calculated by dividing revenue generated during a specific period by the Average DAU for that period, then further dividing by the number of days in the period.
[4] Average Daily Paying Users, or Average DPUs, is defined as the number of individuals who made a purchase in a game during a particular day.
[5] Average Daily Payer Conversion Rate is calculated by dividing Average DPUs for a specific period by the Average DAUs for that period.
[6] Average Day Seven Retention Rate is calculated by dividing the number of new users who continue using the app on the seventh day after installation for a specific period by the total number of new users for that period.
Mr. Feng Xie, founder and chairman of Gamehaus, commented: “Our third quarter results reflect the durability of the operating model we have built. Total revenue of $26.2 million exceeded the upper end of our guidance range, while our cumulative net income for the first nine months of fiscal 2026 grew approximately 40% year over year. These outcomes underscore the durable impact of the disciplined adjustments we have made across our cost structure, user acquisition strategy, and product portfolio over the past several quarters. Importantly, our Direct-to-Consumer (DTC) penetration reached approximately 13.9% company-wide and 36.7% on our flagship title, with further margin benefit expected as we target 15% to 20% penetration by fiscal year-end. As we deepen the integration of AI across every layer of our publishing stack, we are also steadily advancing toward our longer-term goal of evolving Gamehaus into an AI-driven, integrated platform for content generation and distribution, a strategic positioning which we believe will define the next phase of competitive advantage in our industry. We will remain focused on disciplined execution and on building long-term value for our players, partners, and shareholders.”
Third Quarter of Fiscal Year 2026 Unaudited Financial Results
Revenue
Total revenue was US$26.2 million in the third quarter of fiscal year 2026, decreasing 9.1% from US$28.8 million in the third quarter of fiscal year 2025. The decline primarily reflects the Company’s strategic adjustments in marketing spend as it has been prioritizing investment in the expansion of game pipeline and the preparation of upcoming titles for commercial launch. This structured rebalancing of resources is designed to build a broader, more diversified product portfolio that supports durable revenue growth over time.
Advertising costs decreased by 17.2% in the third quarter of fiscal year 2026 compared to the third quarter of fiscal year 2025, contributing to lower traffic volumes and new player acquisition, which weighed on top-line performance. In-app purchase revenue decreased 9.9% to US$23.4 million in the third quarter of fiscal year 2026 from US$26.0 million in the third quarter of fiscal year 2025, while advertising revenue was US$2.8 million in the third quarter of fiscal year 2026, compared to US$2.9 million in the third quarter of fiscal year 2025. The impact of lower user volumes was partially mitigated by improvements in per-user monetization, supported by ongoing content optimization and targeted live-ops initiatives that deepened engagement and spending across the Company’s active player base.
The Company continues to advance a growing pipeline of titles across the Puzzle and RPG genres, with several projects progressing through development and testing. Dedicated marketing resources have been earmarked for these upcoming releases, and the Company plans to scale promotional efforts as titles reach commercial readiness.
Operating Costs and Expenses
Total operating costs and expenses were US$25.7 million in the third quarter of fiscal year 2026, representing a 10.1% reduction from US$28.5 million in the third quarter of fiscal year 2025.
Cost of revenue decreased by 12.7% to US$12.0 million in the third quarter of fiscal year 2026, from US$13.8 million in the third quarter of fiscal year 2025. The decline was primarily driven by lower platform commission costs, as well as adjustments to developer profit-sharing arrangements as certain titles progress through their lifecycle.Research and development expenses increased 24.1% to US$1.6 million in the third quarter of fiscal year 2026, from US$1.3 million in the third quarter of fiscal year 2025. The increase reflects the Company’s expanded investment in its product pipeline, including ongoing collaboration with external development partners across multiple titles currently in active development and testing.Selling and marketing expenses decreased by 15.5% to US$10.3 million in the third quarter of fiscal year 2026, from US$12.2 million in the third quarter of fiscal year 2025. The decrease was largely attributable to a US$2.0 million reduction in advertising spend on player acquisition and retention, as the Company maintained a structured approach to reduce marketing investment amid uneven ad performance across major platforms, including Apple App Store and Google Play, through which the Company distributes games to game players or users, while continuing to optimize spend efficiency on mature titles.General and administrative expenses were US$1.8 million in the third quarter of fiscal year 2026, representing an increase of 33.1% from US$1.4 million in the third quarter of fiscal year 2025. The increase was primarily due to higher personnel costs associated with the continued build-out of the Company’s public company infrastructure, including corporate governance, financial reporting, and investor relations functions, as well as selective hiring to strengthen management capacity and key operational roles in support of the Company’s expanding business.
Operating Income
Operating income was US$0.5 million in the third quarter of fiscal year 2026, compared to US$0.3 million in the third quarter of fiscal year 2025. Operating margin was 2.1% in the third quarter of fiscal year 2026, compared to 1.0% in the third quarter of fiscal year 2025.
Other Income, Net
Other income, net, which mainly included the Company’s non-operating income and expenses, interest income and expenses, investment income (loss), and other income and expenses, was US$0.02 million in the third quarter of fiscal year 2026, compared to US$0.13 million in the third quarter of fiscal year 2025.
Net Income
Net income was US$0.5 million for the third quarter of fiscal year 2026, compared to US$0.4 million in the third quarter of fiscal year 2025. Net income attributable to Gamehaus Holdings Inc.’s shareholders per ordinary share was US$0.01 for the third quarter of fiscal year 2026, which remained stable compared to the third quarter of fiscal year 2025.
Cash and Cash Equivalents
Cash and cash equivalents were US$18.3 million as of March 31, 2026, compared to US$15.2 million as of June 30, 2025, which the Company believes is sufficient to meet its current liquidity and working capital needs for the next 12 months.
Business Outlook
For the fourth quarter of fiscal year 2026 ending June 30, 2026, the Company expects its total revenue to be in the range of approximately US$23 million to US$26 million. This forecast reflects the Company’s current and preliminary view of its expected financial performance, business situation and market condition, which is subject to change.
Recent Development
Share Repurchase Plan Update
In August 2025, the board of directors of the Company approved a share repurchase plan, pursuant to which the aggregate value of Class A ordinary shares authorized for repurchase under the plan through August 28, 2026 shall not exceed US$5 million. Repurchases may be made from time to time through open market transactions at prevailing market prices, in privately negotiated transactions, in block trades, and/or through other legally permissible means, including through the use of trading plans, intended to qualify under Rule 10b-18 under the Securities Exchange Act of 1934, as amended, in accordance with applicable securities laws and other restrictions and subject to market conditions and in accordance with applicable federal securities laws. The timing and actual amount of repurchases will be determined at the discretion of the Company’s management, based on factors including share price, trading volume, market conditions, business outlook, and capital allocation priorities.
As of March 31, 2026, the Company had repurchased approximately 392,000 of its Class A ordinary shares for approximately US$482,000.
Conference Call Information
The management team of Gamehaus will host a conference call at 08:00 A.M. Eastern Time on Monday, June 8, 2026 (08:00 P.M. Beijing/Hong Kong time on the same day) to discuss the financial results. In advance of the conference call, all participants must use the following link to complete the online registration process. Upon registering, each participant will receive access details for this conference including a conference passcode, a unique PIN number (personal access code), dial-in numbers, and an e-mail with detailed instructions to join the conference call.
Participant Online Registration: https://dpregister.com/sreg/10209253/10404aa4efc
A live and archived webcast of the conference call will be available on the Company’s Investor Relations website at https://ir.gamehaus.com/.
About Gamehaus
Gamehaus Holdings Inc. is a technology-driven global mobile game publisher dedicated to bridging creative studios and players worldwide. With a portfolio spanning mid-core and casual games, Gamehaus delivers full-stack publishing support across market insights, user growth, live-ops, data analytics and monetization optimization. With a vision to be the go-to partner for creative teams, the company specializes in combining global publishing reach with AI- and data-powered solutions to help partners build lasting success. For more information, please visit https://ir.gamehaus.com.
Forward-Looking Statements
Certain statements in this announcement are forward-looking statements, including, but not limited to, the Company’s business plan and outlook. These forward-looking statements involve known and unknown risks and uncertainties and are based on the Company’s current expectations and projections about future events that may affect its financial condition, results of operations, business strategy and financial needs. Investors can find many (but not all) of these statements by the use of words such as “approximates,” “believes,” “hopes,” “expects,” “anticipates,” “estimates,” “projects,” “intends,” “plans,” “will,” “would,” “should,” “could,” “may”, or other similar expressions in this press release. The Company undertakes no obligation to update or revise publicly any forward-looking statements to reflect subsequent occurring events or circumstances, or changes in its expectations, except as may be required by law. Although the Company believes that the expectations expressed in these forward-looking statements are reasonable, it cannot assure you that such expectations will turn out to be correct, and the Company cautions investors that actual results may differ materially from the anticipated results due to various risks and uncertainties, including but not limited to those described under the “Risk Factors” section in the Company’s annual report on Form 20-F filed with the U.S. Securities and Exchange Commission.
Investor Relations Contact
Gamehaus Holdings Inc.
Investor Relations Team
Email: IR@Gamehaus.com
The Blueshirt Group
Mr. Jack Wang
Email: Gamehaus@TheBlueshirtGroup.co
GAMEHAUS HOLDINGS INC. AND ITS SUBSIDIARIES
UNAUDITED CONDENSED CONSOLIDATED BALANCE SHEETS
(Amount in USD dollars, except for number of shares or otherwise noted)
As of
March 31,
2026
June 30,
2025
(Unaudited)
(Audited)
ASSETS
CURRENT ASSETS:
Cash and cash equivalents
$
18,229,255
$
15,234,745
Short-term investments
2,121,337
1,345,154
Accounts receivable
8,752,988
10,423,418
Advanced to suppliers
12,006,339
9,442,382
Prepaid expenses and other current assets
3,585,603
3,128,788
TOTAL CURRENT ASSETS
44,695,522
39,574,487
NON-CURRENT ASSETS:
Plant and equipment, net
143,883
124,503
Intangible assets, net
4,422,956
5,001,523
Right-of-use assets, net
1,893,358
512,647
Equity investments
1,976,938
1,995,021
TOTAL NON-CURRENT ASSETS
8,437,135
7,633,694
TOTAL ASSETS
$
53,132,657
$
47,208,181
LIABILITIES
CURRENT LIABILITIES:
Accounts payable
$
11,906,828
$
10,752,234
Contract liabilities
1,535,651
1,871,120
Accrued expenses and other current liabilities
607,328
903,252
Lease liabilities
217,471
463,064
Taxes payable
16,836
51,599
TOTAL CURRENT LIABILITIES
14,284,114
14,041,269
NON-CURRENT LIABILITY:
Lease liabilities
1,642,169
58,517
TOTAL NON-CURRENT LIABILITY
1,642,169
58,517
TOTAL LIABILITIES
$
15,926,283
$
14,099,786
SHAREHOLDERS’ EQUITY:
Class A ordinary shares (par value of $0.0001 per share;
900,000,000 shares authorized, 49,520,156 and 37,971,245 shares
issued and outstanding as of March 31, 2026 and June 30, 2025,
respectively)
4,952
3,797
Class B ordinary shares (par value of $0.0001 per share;
100,000,000 shares authorized, 7,799,057 and 15,598,113 shares
issued and outstanding as of March 31, 2026 and June 30, 2025,
respectively)
780
1,560
Additional paid-in capital
10,953,826
10,954,201
Treasury stock
(481,549)
–
Retained earnings
26,967,976
23,543,001
Accumulated other comprehensive income (loss)
69,351
(1,276,222)
TOTAL GAMEHAUS HOLDING INC’S SHAREHOLDERS’
EQUITY
37,515,336
33,226,337
Non-controlling interests
(308,962)
(117,942)
TOTAL SHAREHOLDERS’ EQUITY
37,206,374
33,108,395
TOTAL LIABILITIES AND SHAREHOLDERS’ EQUITY
$
53,132,657
$
47,208,181
GAMEHAUS HOLDINGS INC. AND ITS SUBSIDIARIES
UNAUDITED CONDENSED CONSOLIDATED STATEMENTS OF OPERATIONS
AND COMPREHENSIVE INCOME
(Amount in USD dollars, except for number of shares or otherwise noted)
For the
Three Months Ended
March 31,
For the
Nine Months Ended
March 31,
2026
2025
2026
2025
(Unaudited)
(Unaudited)
(Unaudited)
(Unaudited)
REVENUE
$
26,216,845
28,839,765
$
80,243,054
$
87,390,942
OPERATING COST AND EXPENSES
Cost of revenue
(12,018,392)
(13,761,522)
(37,459,806)
(41,358,663)
Research and development expenses
(1,568,430)
(1,264,191)
(4,880,199)
(4,250,977)
Selling and marketing expenses
(10,266,413)
(12,150,916)
(30,828,934)
(36,628,917)
General and administrative expenses
(1,819,796)
(1,367,447)
(4,652,089)
(3,137,638)
OPERATING INCOME
$
543,814
$
295,689
$
2,422,026
$
2,014,747
OTHER INCOME (EXPENSES):
Investment (loss) income, net
(89,727)
(12,885)
474,496
(7,800)
Interest income
108,477
148,275
444,763
428,060
Other (expenses) income, net
(3,356)
(3,043)
37,483
48,904
Total other income, net
15,394
132,347
956,742
469,164
INCOME BEFORE INCOME TAXES
559,208
428,036
3,378,768
2,483,911
INCOME TAXES EXPENSES
(108,799)
(41,007)
(145,314)
(169,171)
NET INCOME
450,409
387,029
3,233,454
2,314,740
Less: net loss attributable to non-controlling interests
(64,961)
(32,702)
(191,521)
(62,407)
NET INCOME ATTRIBUTABLE TO
GAMEHAUS HOLDINGS INC’S
SHAREHOLDERS
515,370
419,731
3,424,975
2,377,147
OTHER COMPREHENSIVE INCOME
Net income
450,409
387,029
3,233,454
2,314,740
Foreign currency translation adjustment, net of tax
1,667,338
(361,187)
1,346,071
181,529
TOTAL COMPREHENSIVE INCOME
$
2,117,747
$
25,842
$
4,579,525
$
2,496,269
Less: total comprehensive loss attributable to non-
controlling interests
(117,750)
(31,197)
(191,020)
(62,469)
TOTAL COMPREHENSIVE INCOME
ATTRIBUTABLE TO GAMEHAUS
HOLDINGS INC’S SHAREHOLDERS
2,235,497
57,039
4,770,545
2,558,738
BASIC AND DILUTED EARNINGS PER
SHARE:
Net income attributable to Gamehaus Holdings Inc’s
shareholders per share
Basic and diluted
$
0.01
$
0.01
$
0.06
$
0.04
Weighted average shares outstanding used in
calculating basic and diluted income per share
Basic and diluted
$
53,185,982
$
52,646,954
$
53,355,019
$
53,569,377
View original content:https://www.prnewswire.com/news-releases/gamehaus-holdings-inc-announces-unaudited-financial-results-for-the-third-quarter-of-fiscal-2026-ended-march-31-2026-302793775.html
SOURCE Gamehaus Holdings Inc.
You may like
Technology
SK hynix Announces 3Q26 Financial Results
Published
55 minutes agoon
October 28, 2026By
Reports revenues of 104.6155 trillion won, operating profit of 83.3338 trillion won, net profit of 39.7756 trillion won; Quarterly sales surpass 100 trillion won for the first timeSales of HBM4 and high-value-added server products expanded; HBM4 expected to be the mainstream product from the fourth quarterLong-term agreements secured for more than 50% of 2027~2028 production capacity; A structure that reflects market conditions and ensures stable profitabilityMost of the gains from the Kioxia investment to be shared with shareholders, with approximately 100 trillion won in shareholder returns to be executed this year
SEOUL, South Korea, Oct. 27, 2026 /PRNewswire/ — SK hynix Inc. (or “the company”, www.skhynix.com) announced today that it has recorded 104.6155 trillion won in revenues, 83.3338 trillion won in operating profit (with an operating margin of 80%), and 39.7756 trillion won in net profit (with a net margin of 38%) in the third quarter.
Record quarterly results in both revenue and operating profit and revenue surpasses 100 trillion won for the first time
In a market environment in which prices of key products have risen on the back of growing demand for AI memory, the company once again posted all-time-high quarterly results in both revenue and operating profit, underpinned by the competitiveness of its high-value-added products. In particular, revenue exceeded 100 trillion won for the first time in the company’s history. Revenue and operating profit increased by 32% and 38%, from the previous quarter, respectively.
– Q2 2026: Revenue of 79.3187 trillion won, Operating Profit of 60.5426 trillion won
By product, DRAM results were driven by a significant increase in sales of server DDR5 while HBM4 shipments began in earnest. In NAND, sales of 321-layer TLC eSSD expanded, and high-value-added products for data centers continued to grow across the board.
The company’s financial structure has also become significantly concrete. At the end of the third quarter, cash and cash equivalents stood at 114.5 trillion won, up 26.5 trillion won from the end of the previous quarter, while borrowings decreased by 2.8 trillion won to 15.8 trillion won. As a result, net cash increased to 98.7 trillion won.
Memory supply shortage to persist through 2030
SK hynix analyzed that a virtuous cycle has taken hold in which AI-driven productivity gains and new revenue generation in areas such as software development, customer service, and search lead to greater AI adoption, which in turn drives increased investment in infrastructure. It also projected that, as the drivers of AI investment move beyond the early stage, when a small number of companies accounted for most of it, and broaden to include general enterprises and nation-level initiatives, the global AI data center infrastructure market will continue to grow steadily.
The company likewise expects the memory market to sustain its growth, led in the short term by enterprise and personal AI and, over the mid-to-long term, by physical AI such as autonomous driving and robotics.
The company assessed that supply, on the other hand, is not keeping pace with the growth of the market. Given technical difficulty of leading-edge processes and the long lead time required to build new production facilities, it expects the structure in which demand exceeds supply to persist through 2030.
Expanding production capacity and strengthening product competitiveness to achieve a further step up in growth next year
Building on these favorable conditions, the company plans to accelerate the expansion of production capacity and the strengthening of product competitiveness in order to sustain the current growth momentum, and to scale up revenue and profit one step further next year.
First, the company plans to rapidly increase the portion of its 10nm-class 6th generation (1c) process technology and expand sales of DDR5 and LPDDR5 SOCAMM for AI servers, thereby further strengthening its DRAM portfolio centered on high-value-added products.
To respond to surging HBM demand, the company will ramp up M15X to maximum capacity by the end of the year to increase HBM4 production. Accordingly, the company expects HBM4 to surpass HBM3E in both shipment volume and revenue in the fourth quarter and to establish itself as a mainstream product.
In NAND, the company will raise the ratio of its 321-layer process to more than half of its domestic production capacity in the fourth quarter, and thereby increase the supply of high-performance, high-capacity eSSD. Over the mid-to-long term, the company intends to develop NAND into a core solution that enhances the throughput and economic efficiency of AI services, based on HBF and system optimization technologies.
Long-term agreements secured for more than 50% of 2027~2028 production capacity and the company to drastically expand investment next year
To improve mid-to-long term demand visibility and solidify its growth foundation, SK hynix is expanding long-term agreements (LTAs) with customers. The company has currently signed LTAs with 14 major customers, including leading global cloud service providers (CSPs), and is also proactively discussing with a number of customers the possibility of extending the contract terms, which are typically five years.
The LTA volume secured to date corresponds to more than 50% of total production capacity for 2027 and 2028. In particular, by introducing a mechanism that reflects market conditions within a price range agreed upon with customers, the company has established a structure that secures stable profitability while allowing flexible responses to market changes.
Backed by the demand visibility, the company is also moving to expand its production capabilities. Next year, with the Yongin Phase 1 entering full-scale operation and domestic and overseas infrastructure investment gaining momentum, investment is expected to increase significantly. The company nevertheless plans to adjust the scale and timing of its investment flexibly, after carefully weighing customer demand, product competitiveness, profitability and investment efficiency.
Most of the gains from the Kioxia investment to be shared with shareholders, with approximately 100 trillion won in shareholder returns to be executed this year
As previously indicated in August, SK hynix announced its additional shareholder return plan. For fiscal year 2026, the company will pursue shareholder returns totaling approximately 100 trillion won, comprising cash dividends of 30 trillion won or more and share repurchases and cancellations of 60 trillion won or more in total, including the 40 trillion won announced in August. Through this, the company intends to fulfill its commitment to return 50% or more of free cash flow (FCF). Of this, the 40 trillion won share repurchase announced in August was completed last week, and the shares will be cancelled shortly.
The company also set out its principles: the dividend amount will be determined on the basis of operating results; if significant investment gains arise, they will be returned additionally through special dividends; and share repurchases will continue every quarter.
At today’s meeting, the Board of Directors resolved on a third-quarter cash dividend of 14 trillion won and a share repurchase of 20 trillion won. Of the shares to be repurchased, 10 trillion won, earmarked for shareholder returns, will be cancelled in full, while the remaining approximately 10 trillion won will be used for employee compensation and is not included in the shareholder return total.
The third-quarter dividend is 20,000 won per share, consisting of a 10,000-won dividend reflecting improved earnings and a 10,000 won special dividend that shares the gains from the Kioxia investment. The company has decided to return to shareholders most of the gains realized from its Kioxia investment this year.
SK hynix emphasized that it will deliver stable results based on robust memory demand growth and technological competitiveness and the company will consistently share financial achievements with our shareholders.
3Q26 Financial Results (K-IFRS)
*Unit: Billion KRW
3Q26
QoQ
YoY
2Q26
Change
3Q25
Change
Revenues
104,615.5
79,318.7
32 %
24,448.9
328 %
Operating Profit
83,333.8
60,542.6
38 %
11,383.4
632 %
Operating Margin
80 %
76 %
3%p
47 %
33%p
Net Income
39,775.6
93,922.6
-58 %
12,597.5
216 %
* Financial information of the earnings is based on K-IFRS
* Please note that the financial results discussed herein are preliminary and speak only as of October 28, 2026. Readers should not assume that this information remains operative at a later time.
* Percentage changes are calculated on the basis of unrounded figures.
Disclaimer
This material has been prepared by the Company for informational purposes only, and the information contained herein has not undergone any separate, independent verification process. No representations or warranties are made regarding the fairness, accuracy, or completeness of the information contained in this material, and such information should not be relied upon. Neither the Company nor its employees bear any civil, criminal, or administrative liability for any damages arising from this material or from its use.
Review of the FY2026 Q3 financial results has not been finalized. Figures in this earnings release are subject to changes during the independent auditing process.
All financial information contained in this document is based on consolidated K-IFRS.
This material contains forward-looking statements, which involve risks and uncertainties. These statements are generally identified words such as “may,” “will,” “intend,” “should,” “believe,” “expect,” “anticipate,” “project,” “estimate” and similar expressions, or the negative of such expressions. Forward-looking statements are not guarantees of future performance and are subject to inherent risks, uncertainties, and other factors that could cause actual results to differ materially from those expressed or implied. Readers are cautioned not to place undue reliance on any of these forward-looking statements. These forward-looking statements speak only as of the date hereof. SK hynix undertakes no obligation to update any of these forward-looking statements to reflect events or circumstances after the date of this news release or to reflect actual outcomes, unless required by law.
This material does not constitute a solicitation for the acquisition or purchase of securities, and no part of this material should serve as the basis for any contract, agreement, or investment decision, nor should it be relied upon in connection therewith.
About SK hynix Inc.
SK hynix Inc., headquartered in Korea, is the world’s top tier semiconductor supplier offering Dynamic Random Access Memory chips (“DRAM”) and flash memory chips (“NAND flash”) for a wide range of distinguished customers globally. The Company’s shares are traded on the Korea Exchange, and the Global Depository shares are listed on the Luxembourg Stock Exchange. Further information about SK hynix is available at www.skhynix.com, news.skhynix.com.
View original content:https://www.prnewswire.com/news-releases/sk-hynix-announces-3q26-financial-results-302921407.html
SOURCE SK hynix Inc.
Technology
DealLabs Builds Travel AI Data Layer with 280,000 Verified Local Records Across Seven Asian Cities
Published
55 minutes agoon
October 28, 2026By
SEOUL, South Korea, Oct. 28, 2026 /PRNewswire/ — Seoul-based travel data company DealLabs announced that it has built a database of verified local travel information for seven Asian cities: Seoul, Busan, Tokyo, Osaka, Bangkok, Taipei, and Singapore. As of October 13, the database contained more than 280,000 records, each accompanied by its source and verification date. It powers more than 23,000 guide pages and is published in formats AI systems can read directly.
It covers what travelers look for after arriving: subway station exits, timetables, first and last trains, fares, restaurants, tourist attractions, hospitals, closing days for Singapore’s hawker centers, and business hours for Taipei’s night markets. In Osaka alone, the database contains more than 114,000 records, including more than 42,000 medical institutions and pharmacies and more than 30,000 restaurant permits. In Taipei, it contains more than 63,000 records, including 7,200 station-to-station fares.
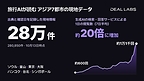
The number of times generative AI search and answer services accessed DealLabs’ data increased from around 600 times per day on a seven-day average in late September to more than 11,000 times per day in mid-October, nearly 20-fold in less than a month.
Travel information changes rapidly. On the same day, public event listings and organizers’ own notices gave different end dates for three of 25 pop-up stores in Seoul, up to 10 days apart. Business hours, closing days, last train times, and fares are among the areas where AI travel answers are most frequently inaccurate. DealLabs continuously updates this information using official sources.
All seven cities have AI-ready guide files (llms.txt) and data APIs, while Seoul also provides a standard API specification (OpenAPI). The seven cities are run using a single common engine, allowing a new city to be added simply by incorporating that city’s data and sources.
DealLabs is also piloting “Visit Plan Check,” which checks travel AI itineraries against official sources daily.
Young Cho, founder and CEO of DealLabs, said, “When travelers ask AI a question, what matters is whether the answer is accurate for that city today. We will establish a standard for local data that travel AI can rely on.”
DealLabs plans to expand its coverage to 10 cities by the end of 2026 and to 30 cities, including New York and Paris, by 2028.
For more information, please visit https://deallabs.net.
View original content to download multimedia:https://www.prnewswire.com/apac/news-releases/deallabs-builds-travel-ai-data-layer-with-280-000-verified-local-records-across-seven-asian-cities-302920425.html
SOURCE DEALLABS
Technology
Teijin Selects Kharon to Strengthen Export Controls Compliance Across Global Operations
Published
55 minutes agoon
October 28, 2026By
Kharon ClearView will support Teijin teams in Japan, the United States, and Europe as they navigate Japanese and U.S. export controls requirements.
DENVER, Oct. 28, 2026 /PRNewswire/ — Kharon, a data and technology company that provides risk intelligence solutions to help organizations manage regulatory and business risk, announced that Teijin Limited has selected Kharon ClearView to support its export controls compliance program.
Headquartered in Japan, Teijin operates a global materials business that includes carbon fiber and other advanced materials used in aerospace and industrial applications. Its international operations require compliance teams to navigate export control requirements across multiple jurisdictions, including Japan and the United States.
“As a global company, we need an export controls approach that can support our teams across markets,” said Hitoshi Onodera, General Manager of the Quality Assurance and Security Export Control Department and Manager of the Security Export Control Group at Teijin. “We selected Kharon because of the depth of its risk intelligence, ease of use, and its ability to give our teams greater visibility into the entities and relationships that matter to our reviews. ClearView will help us bring that context consistently into our due diligence processes across our operations.”
Teijin will deploy ClearView across its operations globally. ClearView enables compliance teams to investigate complex entity relationships, including ownership and commercial connections to parties subject to export controls and other trade restrictions.
“Advanced materials companies operate in an increasingly complex export controls environment, where understanding the parties behind a transaction can be just as important as screening the names directly involved,” said Ethan Woolley, Global Director of Strategy at Kharon. “Teijin’s decision to deploy ClearView across its operations reflects the importance of having that level of insight. We are pleased to support its teams as they strengthen their approach to export controls compliance.”
About Teijin
Teijin Limited is a Japan-based global technology company providing products and solutions across advanced materials, healthcare, and other technology-driven fields. Founded in 1918, Teijin’s businesses include high-performance materials such as aramid fibers, carbon fibers, and composites, serving applications across mobility, infrastructure, industry, and other markets. The Teijin Group comprises 126 companies and approximately 15,700 employees worldwide.
For more information, visit https://www.teijin.co.jp/.
About Kharon
Kharon’s intelligence supports compliance, trade, risk, and national security programs at organizations around the world, including seven of the 10 largest U.S. banks, six of the 10 largest EU banks, and over 35 Fortune 100 companies. Kharon’s data can also be directly integrated with AI applications and agentic operations through Kharon’s API, MCP, and agent gateway infrastructure, enabling organizations to embed Kharon’s sourced, structured insights into automated workflows alongside their teams.
Visit kharon.com and follow Kharon on LinkedIn to stay connected.
Media contact
Kharon
media@kharon.com
View original content to download multimedia:https://www.prnewswire.com/apac/news-releases/teijin-selects-kharon-to-strengthen-export-controls-compliance-across-global-operations-302921369.html
SOURCE Kharon
SK hynix Announces 3Q26 Financial Results
DealLabs Builds Travel AI Data Layer with 280,000 Verified Local Records Across Seven Asian Cities
Teijin Selects Kharon to Strengthen Export Controls Compliance Across Global Operations
Send Rakhi to UK swiftly with UK Gifts Portal
Whiteboard Series with NEAR | Ep: 45 Joel Thorstensson from ceramic.network
Nullmax and Renesas Forge Strategic Partnership to Deliver Competitive ADAS Solutions for the Global Market
Why You Should Build on #NEAR – Co-founder Illia Polosukhin at CV Labs
Whiteboard Series with NEAR | Ep: 45 Joel Thorstensson from ceramic.network
NEAR End of Year Town Hall 2021: The Open Web World, MetaBUILD 2 Hackathon and 2021 recap
Trending
-
Technology4 days agoMiami Startup BOB Raises $5.5M To Build An AI-Powered Banking Platform
-
Coin Market5 days agoBitcoin ETFs bleed $635M as October slides back into the red
-
Coin Market5 days agoCysic dangles a 10% bounty, hacker pours loot into Tornado Cash
-
Coin Market5 days agoEthereum delays Glamsterdam Hoodi testnet launch over security risks
-
Coin Market5 days agoMalaysia, Thailand join Singapore’s cross-border stablecoin push
-
Technology4 days agoKin Becomes First U.S. Home Insurer to Enable WebMCP for AI Shopping
-
Technology4 days agoEnigmata Joins Finovifi Marketplace to Support AI Data Protection and Privacy-Preserving Analytics
-
Coin Market4 days agoWells Fargo and five others object to OKX-ICE tokenized stock listings: Report