Achieved first commercial revenues in Q4 FY2026, supporting the transition from a pre-revenue research company to an integrated, high-performance battery solutions providerFulfilled recurring contract manufacturing orders from Fortune 500 automotive customers and added 8 additional customers for battery foundry servicesDrone battery cell and pack deliveries underway for testing and field validation with Korean defense drone companies
TORONTO, June 29, 2026 /CNW/ – NEO Battery Materials Ltd. (“NEO” or the “Company”) (TSXV: NBM) (OTC: NBMFF), a low-cost, silicon-enhanced battery manufacturer enabling high-performance capabilities for drones, robotics, and physical AI, is pleased to announce its financial and operational results for the fiscal year ended February 28, 2026. All amounts are in Canadian dollars unless otherwise specified.
FY2026 Financial and Operational Highlights
First Commercial Revenues: Achieved first-ever commercial revenues of $267,722 in Q4 FY2026, signalling the successful transition from R&D to a vertically integrated, high-performance battery solutions provider.Early-Stage Operating Performance: Recorded a gross loss of $769,304, representing the Company’s scale-up phase and ordinary early-stage nature of commercial production activities, with plant utilization below the threshold to fully absorb fixed costs.Balance Sheet Strength: Concluded FY2026 with $5,496,557 in cash, bolstered by a $7,000,000 non-brokered private placement to accelerate production expansion in Q4 2026.Manufacturing Foundation: Secured long-term lease for the Gimje Battery Manufacturing Factory (Nov 2025) for MWh-scale electrode production and closed the acquisition of a 3.2-acre expansion site (Feb 2026) to house mass-volume cell assembly line for drone and robotics applications.Commercial Validation: Recurring contract manufacturing purchase orders from Fortune 500 automotive original equipment manufacturers (OEMs), with official vendor status that validates manufacturing and quality standards.Technology Milestone: Demonstrated a 98% increase in surveillance drone flight time versus mass-produced Chinese commercial benchmarks in live field testing (see press release dated February 18, 2026).Strategic Leadership: Appointed 4-Star General (Ret.) Chang-Jun Ko, past Acting Chief of Staff of the Republic of Korea Army, to the Board of Directors (Feb 2026) to spearhead defense-sector integration in South Korea and allied Asia-Pacific governments.
Key Business Updates – FY2026 & Subsequent Events
During Q4 of FY2026, NEO successfully transitioned from a research-focused developer to an integrated, high-performance battery solutions provider by launching its Battery Foundry and Drone & Robotics Battery segments. Key business updates include:
Battery Foundry: Customer Addition & Production Expansion
The Gimje Factory serves as NEO’s primary production hub for silicon-graphite anodes and LFP/NMC cathodes. Following the first purchase orders in December 2025, the Company has primarily received and fulfilled recurring contract manufacturing orders from the two anchor automotive OEM customers. Including a European Fortune Global 500 automotive OEM, a U.S.-based battery manufacturer, and Korean battery value chain companies, 8 additional customers have been secured for battery foundry services in which both electrode and cell products were manufactured and shipped.
Due to new and material regulations such as the U.S. FY26 National Defense Authorization Act (NDAA) to exclude the use of batteries manufactured by Foreign Entities of Concern (FEOC), the Company has experienced elevated demand from U.S.-based battery companies to contract manufacture high-energy and power cells via NEO’s Battery Foundry in South Korea. To accommodate higher volume requests for drone and defense applications towards the second half of calendar year 2026 and 2027, 250 MWh of pouch cell assembly capacity will be initially installed in the newly acquired 3.2-acre expansion site, equating to an annual capacity of over 5 to 6 million cells based on full ramp-up and continuous manufacturing. The Company intends to install a tabless cylindrical cell assembly line or additional pouch assembly capacity, depending on demand and downstream requirements.
Drone & Robotics Program: Product Shipment & Custom-Engineering Service
In addition to Battery Foundry services, the Company is derisking its revenue model by actively developing and manufacturing its proprietary drone and robotics battery cell products. Technology milestones from enhanced energy density and quality and non-Chinese, non-FEOC production have translated into increased leads and engagement primarily for defense drone applications. Furthermore, for the Korea Defense Integration Strategy, a strong pipeline has been established through partnerships with the Korea Institute for Defense Industry (KOIDI), multiple ROK Army divisions, and a strategic partnership with Zio Robot Co. for AI-driven logistics robotics (see press release dated February 24, 2026).
The Company has initiated deliveries of drone battery cells and packs to Korean defense drone OEMs for testing and field validation. Due to various geographic interests in the Company’s non-FEOC products, including Ukraine, the U.S., Japan, India, Singapore, Taiwan, and the Baltics, UN certification is being obtained for export clearance and international deployment. With battery development expertise and flexibility in foundry-driven manufacturing, the Company is further custom-engineering drone battery products to meet the specifications and needs of different end-use systems and applications.
For expedited battlefield integration, the Company intends to establish a go-to-market presence in Estonia to serve the Baltic and Ukrainian defense drone markets. Estonia’s proximity to Ukraine and its position within the Baltic defense ecosystem provide direct access to drone OEMs and end-users with non-Chinese-manufactured energy storage products. Through this regional integration, the Company aims to localize product battlefield qualification, customer engagement, and delivery to Eastern European customers.
Throughout the year, the Company has entered into multi-year purchase orders and Joint Development Agreements (JDAs), certain of which remain subject to successful development and validation and the execution of definitive agreements, including agreements with an Asian mission-flight control manufacturer ($4.5M), a North American UAS specialist, and a South Korean robotics firm (KRW 2.5B), including “Project David” (a $3M JDA with a UCAV manufacturer).
“Fiscal 2026 was a transformative year for NEO as we successfully bridged the gap between R&D and commercial-scale execution,” said Spencer Huh, President and CEO of NEO Battery Materials. “By launching our Battery Foundry and Drone & Robotics Battery segments, we have evolved into a vertically integrated solutions provider, directly addressing the urgent global need for high-performance, non-Chinese battery supply chains – a critical requirement underscored in recent analysis by the Center for European Policy Analysis (CEPA). We will continue to prioritize penetrating the defense ecosystem as our recent successes have stemmed from serving the mission-critical hardware and electronics markets. As we look ahead, our focus remains on scaling our production capacity to fulfill mass-volume orders and convert our pipeline of customer engagements into sustainable, recurring commercial revenue.”
Recent Events
March 19, 2026: Entered into a Memorandum of Understanding (MOU) with the Association of the Republic of Korea Army to strengthen national military power through the integration of high-energy battery technology.
April 1, 2026: Entered into a defense partnership with the Republic of Korea Army’s 12th Infantry Division to integrate high-energy battery solutions into frontline military operations.
April 22, 2026: Partnered with the Capital Mechanized Infantry Division of the ROK Army to develop and deploy high-performance battery technology directly into division’s drone systems.
May 6, 2026: Announced a major defense technology partnership with the Capital Defense Command (CDC), one of the highest-ranking military units responsible for protecting the South Korean Presidential Office and key national infrastructure. Cooperating to supply and deploy high-performance defense batteries within CDC’s drone and robotics units.
May 13, 2026: Entered into a non-binding supply intent letter to deliver 7,584 high-performance drone battery packs (comprising 45,504 cells) to a Korean drone manufacturer supporting ROK Army programs.
June 4, 2026: Launched high-power & energy FPV strike drone battery product, delivering 82 and 103% increase in energy density and flight range versus Chinese incumbents at identical size, dimensions, and current usage. One of the first non-Chinese pouch battery alternatives for FPV strike drones with U.S. NDAA-compliance for procurement eligibility into Department of War and allied governments.
The Company’s audited Consolidated Financial Statements and Management Discussion and Analysis for the year ended February 28, 2026 are available on SEDAR+ at www.sedarplus.com and the Company’s website at www.neobatterymaterials.com.
About NEO Battery Materials Ltd.
NEO Battery Materials is a Canadian-South Korean battery technology company focused on developing and producing silicon-enhanced lithium-ion batteries in drones, robotics, physical AI, electric vehicles, and energy storage systems. With a patent-protected, low-cost silicon manufacturing process, NEO Battery enables longer-running and ultra-fast charging properties and provides end-to-end battery solutions from materials selection, cell architecture, and process optimization. The Company aims to be a globally-leading producer of high-performance lithium-ion batteries and materials, building a secure, robust battery supply chain for Western manufacturers. For more information, please visit the Company’s website at: https://www.neobatterymaterials.com/.
On Behalf of the Board of Directors
Spencer Huh
Director, President, and CEO
This news release includes certain forward-looking statements as well as management’s objectives, strategies, beliefs and intentions. All information contained herein that is not clearly historical in nature may constitute forward-looking information. Generally, such forward-looking information can be identified notably by the use of forward-looking terminology such as “plans”, “expects” or “does not expect”, “is expected”, “budget”, “scheduled”, “estimates”, “forecasts”, “intends”, “anticipates” or “does not anticipate”, or “believes”, or variations of such words and phrases or state that certain actions, events or results “may”, “could”, “would”, “might” or “will be taken”, “occur” or “be achieved”. Forward-looking information is subject to known and unknown risks, uncertainties and other factors that may cause the actual results, level of activity, performance or achievements of the Company to be materially different from those expressed or implied by such forward-looking information, including but not limited to: volatile stock prices; the general global markets and economic conditions; the possibility of write-downs and impairments; the risk associated with the research and development of battery-related technologies; the risk associated with the effectiveness and feasibility of battery material, electrode, and cell technologies that have not yet been tested or proven on commercial scale or under real-world operating conditions; the risks associated with battery-related manufacturing process scale-up, including maintaining consistent material, component, and cell quality, production yields, and process reproducibility at a pilot, semi-commercial, or commercial scale; the risks associated with compatibility of existing battery chemistries, formulations, components, or designs; unforeseen risks associated with entering into and maintaining collaborations, joint ventures, partnerships, or commercial contracts with battery cell manufacturers, original equipment manufacturers, and various companies in the global battery and downstream end-user supply chain; the risks associated with the failure to develop and produce commercially viable battery-related products or that technical goals may not be achieved within expected timelines or budgets under a joint development or collaboration; the risks associated with the Company’s technologies and products not meeting performance requirements or customer specifications; the risks that prototype and pilot-scale products do not advance into commercially produced products or translate into commercial orders; the risk associated with battery components and cell purchase orders and offtake supply that may not be fulfilled in full, on time, or at all as actual revenue realization depends on delivery schedules, achievement of technical milestones, and customer acceptance and validation; the risk associated with losing official vendor registration or status with existing customers; counterparty risk upon delivery of prototype and commercial products; the risks associated with constructing, completing, securing, and financing pilot, semi-commercial, and commercial battery materials, components, and cell manufacturing facilities including the Canadian and South Korean facilities; the risks associated with potential delays or increased costs with site preparation, equipment procurement and installation, and facility commissioning; the risks associated with integrating silicon anode material production, electrode manufacturing, and cell assembly within a single operational cluster or the Company’s business portfolio; the risks associated with supply chain disruptions or cost fluctuations in raw materials, processing chemicals, and additive prices, impacting production costs and commercial viability; the risks associated with uninsurable risks arising during the course of research, development and production; competition faced by the Company in securing experienced personnel, contracts and sales, and financing; access to adequate infrastructure and resources to support battery materials, components, and cell research and development activities; the risks associated with changes in the technology regulatory regime governing the Company; the risks associated with the timely execution of the Company’s strategies and business plans; the risks associated with the lithium-ion battery industry and end-users’ demand and adoption of the Company’s silicon anode technology and battery products; market adoption and integration challenges, including the difficulty of incorporating silicon anodes and silicon battery products within battery manufacturers and OEMs’ systems; the risks associated with the various environmental and political regulations the Company is subject to; risks related to regulatory and permitting delays; the reliance on key personnel; liquidity risks; the risk of litigation; risk management; and other risk factors as identified in the Company’s recent Financial Statements and MD&A and in recent securities filings for the Company which are available on www.sedarplus.ca. Forward-looking information is based on assumptions management believes to be reasonable at the time such statements are made, including but not limited to, continued R&D and commercialization activities, no material adverse change in precursor, raw material, equipment, and relevant cost prices, development and commercialization plans to proceed in accordance with plans and such plans to achieve their stated expected outcomes, receipt of required regulatory approvals, and such other assumptions and factors as set out herein. Although the Company has attempted to identify important factors that could cause actual results to differ materially from those contained in the forward-looking information, there may be other factors that cause results not to be as anticipated, estimated or intended. There can be no assurance that such forward-looking information will prove to be accurate, as actual results and future events could differ materially from those anticipated in such forward-looking information. Such forward-looking information has been provided for the purpose of assisting investors in understanding the Company’s business, operations, research and development, and commercialization plans and may not be appropriate for other purposes. Accordingly, readers should not place undue reliance on forward-looking information. Forward-looking information is made as of the date of this presentation, and the Company does not undertake to update such forward-looking information except in accordance with applicable securities laws.
Neither TSX Venture Exchange nor its Regulation Services Provider (as that term is defined in the policies of the TSX Venture Exchange) accepts responsibility for the adequacy or accuracy of this release.
SOURCE NEO Battery Materials Ltd.


 Technology5 days ago
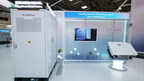
 Technology5 days ago
 Technology5 days ago
 Technology5 days ago
 Coin Market4 days ago
 Coin Market5 days ago
 Technology5 days ago
 Coin Market2 days ago