– Fathom’s Real Estate Agent Network Grew 12% to ~12,224 Agent Licenses; Aiming to Return to 30% Agent Growth in Coming Quarters
CARY, N.C., Aug. 12, 2024 /PRNewswire/ — Fathom Holdings Inc. (Nasdaq: FTHM) (“Fathom” or the “Company”), a national, technology-driven, end-to-end real estate services platform integrating residential brokerage, mortgage, title, and SaaS offerings for brokerages and agents, today reported financial results for the second quarter and the first six months of 2024.
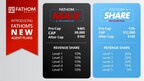
“In the last few months, we have made significant progress toward achieving our goals for this year,” said Fathom Holdings CEO Marco Fregenal. “First, we achieved overall positive Adjusted EBITDA for the quarter, and more importantly, our real estate, mortgage, and title brands achieved positive Adjusted EBITDA. Second, we recently launched what we believe to be the most innovative revenue share program in the industry. Our mission has always been to empower Fathom agents to earn and retain more of their hard-earned money. Our new revenue share plans are a natural extension of this commitment. By offering two revenue share options—either through a split or a flat fee model—we provide agents with the flexibility to choose the best fit for their businesses. These additional income streams ensure our agents have the tools and opportunities to thrive in any market condition. Looking ahead, our focus remains on growth initiatives and exploring additional opportunities to attract high-quality agents, teams, and brokerages. Supported by a compelling value proposition and a robust pipeline of opportunities, our goal is to return to 30% agent growth in the coming quarters.”
Second Quarter 2024 Financial Results
Fathom’s real estate agent network grew 12% to approximately 12,224 agent licenses at June 30, 2024 from approximately 10,930 agent licenses at June 30, 2023.
Fathom completed approximately 10,137 transactions for the second quarter of 2024, a decrease of approximately 8% compared to the second quarter of 2023. Real estate transactions decreased primarily due to the continuation of high mortgage interest rates in the second quarter of 2024. Fathom is addressing this decline by continuing its strategic recruiting efforts, powered by its recently announced new revenue share models and its service commitment to its agents.
Total revenue for the second quarter of 2024 decreased 11% to $89.2 million, compared to $100.1 million in the second quarter of 2023. The decrease in total revenue was due to a 12% decrease in brokerage revenue resulting primarily from fewer transactions and an increase in lease transactions compared to sale transactions. Offsetting the decline in total revenue was an 11% increase in other service revenue, driven by improved performance from Fathom’s mortgage and title businesses, offset by the absence of the Company’s insurance business, which was sold on May 3, 2024.
Segment revenue for the 2024 second quarter, compared with the 2023 second quarter was as follows:
Three months ended
June 30,
($ in millions)
2024
2023
UNAUDITED
Real Estate Brokerage
$ 83.1
$ 94.7
Mortgage
3.7
2.0
Technology
1.1
0.8
Corporate and other services (a)
1.3
2.6
Total revenue
$ 89.2
$ 100.1
(a)
Transactions between segments are eliminated in consolidation. Such amounts are eliminated through the Corporate and other services line.
Our brokerage business gross profit percentage remained relatively constant at 6% for the second quarter of 2024 compared to the second quarter of 2023. Excluding our insurance business, the gross profit percentage in our ancillary businesses dipped slightly to 53% in the second quarter of 2024 from 57% in the second quarter of 2023 primarily related to ramp-up costs associated with expanding our mortgage and title businesses. Our overall gross profit percentage, excluding our insurance business improved to 9% in the second quarter of 2024, up from 8% in the second quarter of 2023.
GAAP net loss for the second quarter of 2024 totaled $1.3 million, or $0.07 per share, an improvement compared with a loss of $4.3 million, or $0.27 per share, for the second quarter of 2023. The significant reduction in net loss was primarily due to the gain generated from the sale of the Company’s insurance business and improved net operating results, partially offset by an increase in non-operating expenses.
Adjusted EBITDA*, a non-GAAP measure, for the second quarter of 2024 totaled $0.2 million, compared to $0.5 million in the second quarter of 2023. The second quarter of 2024 marked the Company’s first positive Adjusted EBITDA* quarter since the second quarter of 2023.
First Six Months of 2024 Financial Results
Real estate transactions declined approximately 11% year-over-year to 17,446 transactions in the first half of 2024. The decline in real estate transactions was primarily due to the continuation of high interest rates in the first half of 2024. Fathom is addressing the decline by continuing its strategic recruiting efforts, powered by its recently announced new revenue share models and its service commitment to its agents.
Total revenue for the first six months of 2024 decreased 11% to $159.7 million, compared to $177.6 million for the first six months of 2023. The decrease in total revenue was due to an 11% decrease in brokerage revenue resulting primarily from fewer transactions and an increase in lease transactions compared to sale transactions. The decline in total revenue was partially offset by a 14% increase in Fathom’s other service revenue, particularly attributable to Fathom’s mortgage business, offset by the absence of approximately two months of revenues from the Company’s insurance business, which was sold on May 3, 2024.
Segment revenue for the 2024 first six months, compared with the 2023 first six months was as follows:
Six months ended
June 30,
($ in millions)
2024
2023
UNAUDITED
Real Estate Brokerage
$ 148.5
$ 167.8
Mortgage
5.9
3.5
Technology
2.2
1.5
Corporate and other services (a)
3.1
4.8
Total revenue
$ 159.7
$ 177.6
(a)
Transactions between segments are eliminated in consolidation. Such amounts are eliminated through the Corporate and other services line.
Gross profit percentages for the first six months of 2024 compared to the same period in 2023 were similar to the quarter-to-date comparisons, excluding the Company’s insurance business, which was sold in May 2024. Fathom’s brokerage gross profit remained relatively constant at 6%, while its ancillary businesses’ gross profit percentage decreased slightly to 52% from 55%. The Company’s overall gross profit percentage improved to 9% from 8%.
GAAP net loss for the first six months of 2024 totaled $7.2 million or $0.37 per share, compared with a loss of $10.0 million, or $0.63 per share, for the first six months of 2023. The significant reduction in net loss was primarily due to the gain generated from the sale of the Company’s insurance business and improved net operating results, partially offset by an increase in non-operating expenses.
Adjusted EBITDA* loss, a non-GAAP measure, was $1.3 million in the first six months of 2024, compared with an Adjusted EBITDA* loss of approximately $0.9 million for the first six months of 2023. The Adjusted EBITDA* loss for the first six months of 2024 was primarily attributable to the lower total contribution from the Company’s brokerage business due to fewer closed transactions, partially offset by growth in the Company’s mortgage business.
*Fathom provides Adjusted EBITDA, a non-GAAP financial measure, because it offers additional information for monitoring the Company’s cash flow performance. A table providing a reconciliation of Adjusted EBITDA to its most comparable GAAP measure, as well as an explanation of, and important disclosures about, this non-GAAP measure, is included in the tables at the end of this press release.
Q2 2024 and Recent Highlights
In August 2024, the Company introduced two innovative agent commission plans, Fathom Max and Fathom Share, complementing its existing plan and showcasing Fathom Realty’s reimagined revenue share program. The strategic initiative is designed to enhance agent recruitment and retention, drive accelerated and sustainable growth, and boost long-term profitability for the Company, while reinforcing Fathom’s commitment to providing flexible, attractive options for real estate professionals.In May 2024, the Company strengthened its financial position by selling its wholly owned subsidiary, Dagley Insurance Agency, for approximately $15.0 million in cash, with $7.8 million received at closing, significantly bolstering its balance sheet.In April 2024, Fathom Realty launched Verus Title Elite, a strategic joint venture partnering with top-producing agents and teams across Texas. The initiative is expected to drive increased revenue and profitability for both Verus Title and Fathom Realty, further strengthening the Company’s market position in the title services sector.
Financial Outlook
In light of the recent introduction of two new revenue share models and their yet-to-be-determined impact on future revenues and Adjusted EBITDA, the Company has elected to withhold guidance for the third quarter ending September 30, 2024. Management plans to reassess and potentially reinstate guidance expectations in the fourth quarter of 2024, allowing time to evaluate the performance of these new models.
Conference Call
Fathom management will hold a conference call at 5:00 p.m. Eastern time (2:00 p.m. Pacific time) today (August 12, 2024) to discuss these financial results.
U.S. dial-in: 1-833-685-0908
International dial-in: 1-412-317-5742
Please call the conference telephone number five minutes prior to the start time. An operator will register your name and organization.
A live audio webcast of the conference call will be available in listen-only mode simultaneously and available via the investor relations section of the Company’s website at www.FathomInc.com.
A telephone replay of the call will be available through August 19, 2024.
U.S. replay dial-in: 1-877-344-7529
International replay dial-in: 1-412-317-0088
Replay ID: 6483169
About Fathom Holdings Inc.
Fathom Holdings Inc. is a national, technology-driven, real estate services platform integrating residential brokerage, mortgage, title, and SaaS offerings to brokerages and agents by leveraging its proprietary cloud-based software, intelliAgent. The Company’s brands include Fathom Realty, Encompass Lending, intelliAgent, LiveBy, Real Results, Verus Title, and Cornerstone. For more information, visit www.FathomInc.com.
Cautionary Note Concerning Forward-Looking Statements
This press release contains “forward-looking statements” that involve risks and uncertainties which we expect will or may occur in the future and may impact our business, financial condition and results of operations. Forward-looking statements are subject to numerous conditions, many of which are beyond the control of the Company, including: risks associated with general economic conditions, including rising interest rates; its ability to generate positive operational cash flow; risks associated with the Company’s ability to continue achieving significant growth; its ability to continue its growth trajectory while achieving profitability over time; risks related to ongoing and future litigation; and other risks as set forth in the Risk Factors section of the Company’s most recent Form 10-K as filed with the SEC and supplemented from time to time in other Company filings made with the SEC. Copies of Fathom’s Form 10-K and other SEC filings are available on the SEC’s website, www.sec.gov. The Company undertakes no obligation to update these statements for revisions or changes after the date of this release, except as required by law.
Investor Contact:
Matt Glover
Gateway Group, Inc.
949-574-3860
FTHM@gateway-grp.com
FATHOM HOLDINGS INC.
CONDENSED CONSOLIDATED STATEMENTS OF OPERATIONS
UNAUDITED
(in thousands, except share data)
Three Months Ended
June 30,
Six Months Ended
June 30,
2024
2023
2024
2023
Revenue
Gross commission income
$ 83,125
$ 94,633
$ 148,510
$ 167,803
Other service revenue
6,082
5,456
11,200
9,827
Total revenue
89,207
100,089
159,710
177,630
Operating expenses
Commission and other agent-related costs
78,045
88,892
139,212
158,064
Operations and support
2,676
1,904
4,785
3,518
Technology and development
1,906
1,875
3,856
3,453
General and administrative
8,904
9,908
18,506
19,219
Marketing
759
927
1,359
1,644
Depreciation and amortization
546
820
1,274
1,515
Total operating expenses
92,836
104,326
168,992
187,413
Gain on sale of business
(2,958)
—
(2,958)
—
Loss from operations
(671)
(4,237)
(6,324)
(9,783)
Other expense (income), net
Interest expense, net
109
79
214
63
Other nonoperating expense
520
4
672
163
Other expense, net
629
83
886
226
Loss before income taxes
(1,300)
(4,320)
(7,210)
(10,009)
Income tax expense (benefit)
(6)
25
11
37
Net loss
$ (1,294)
$ (4,345)
$ (7,221)
$ (10,046)
Net loss per share:
Basic
$ (0.07)
$ (0.27)
$ (0.37)
$ (0.63)
Diluted
$ (0.07)
$ (0.27)
$ (0.37)
$ (0.63)
Weighted average common shares outstanding:
Basic
19,763,055
16,023,981
19,470,764
16,017,560
Diluted
19,763,055
16,023,981
19,470,764
16,017,560
The accompanying notes are an integral part of the condensed consolidated financial statements.
FATHOM HOLDINGS INC.
CONDENSED CONSOLIDATED BALANCE SHEETS
(in thousands, except share data)
June 30,
2024
December 31,
2023
(UNAUDITED)
ASSETS
Current assets:
Cash and cash equivalents
$ 10,439
$ 7,399
Restricted cash
341
141
Accounts receivable
3,919
3,352
Other receivable – current
4,000
—
Mortgage loans held for sale, at fair value
10,371
8,602
Prepaid and other current assets
4,854
3,700
Total current assets
33,924
23,194
Property and equipment, net
2,015
2,340
Lease right of use assets
4,470
4,150
Intangible assets, net
17,419
23,909
Goodwill
19,344
25,607
Other receivable – long-term
3,000
—
Other assets
48
58
Total assets
$ 80,220
$ 79,258
LIABILITIES AND STOCKHOLDERS’ EQUITY
Current liabilities:
Accounts payable
$ 4,866
$ 3,396
Accrued and other current liabilities
2,639
2,681
Warehouse lines of credit
10,085
8,355
Lease liability – current portion
1,199
1,504
Long-term debt – current portion
3,497
416
Total current liabilities
22,286
16,352
Lease liability, net of current portion
4,363
3,824
Long-term debt, net of current portion
91
3,467
Other long-term liabilities
344
381
Total liabilities
27,084
24,024
Commitments and contingencies (Note 17)
Stockholders’ equity:
Common stock (no par value, shares authorized, 100,000,000; shares issued and outstanding,
21,007,879 and 20,671,515 as of June 30, 2024 and December 31, 2023, respectively)
–
–
Additional paid-in capital
131,943
126,820
Accumulated deficit
(78,807)
(71,586)
Total stockholders’ equity
53,136
55,234
Total liabilities and stockholders’ equity
$ 80,220
$ 79,258
The accompanying notes are an integral part of the condensed consolidated financial statements.
FATHOM HOLDINGS INC.
CONDENSED CONSOLIDATED STATEMENTS OF CASH FLOWS
(UNAUDITED)
(in thousands)
Six Months Ended June 30,
2024
2023
CASH FLOWS FROM OPERATING ACTIVITIES:
Net loss
$ (7,221)
$ (10,046)
Adjustments to reconcile net loss to net cash used in operating activities:
Depreciation and amortization
2,799
2,867
Gain on sale of business
(2,958)
—
Non-cash lease expense
920
720
Deferred financing cost amortization
—
21
Gain on sale of mortgages
(3,153)
(1,882)
Stock-based compensation
5,151
6,005
Deferred income taxes
(37)
8
Change in operating assets and liabilities:
Accounts receivable
(658)
(1,252)
Prepaid and other current assets
(1,222)
111
Other assets
10
(6)
Accounts payable
1,642
1,359
Accrued and other current liabilities
308
369
Operating lease liabilities
(1,005)
(800)
Mortgage loans held for sale originations
(131,460)
(85,461)
Proceeds from sale and principal payments on mortgage loans held for sale
132,843
83,250
Net cash used in operating activities
(4,041)
(4,737)
CASH FLOWS FROM INVESTING ACTIVITIES:
Purchase of property and equipment
(12)
(10)
Purchase of intangible assets
(1,193)
(899)
Proceeds from sale of business
7,435
—
Amounts paid for business and asset acquisitions, net of cash acquired
(130)
—
Net cash provided by (used in) investing activities
6,100
(909)
CASH FLOWS FROM FINANCING ACTIVITIES:
Principal payments on debt
(295)
(491)
Borrowings from warehouse lines of credit
127,913
69,920
Repayment on warehouse lines of credit
(126,184)
(66,008)
Deferred acquisition consideration payments
(225)
(284)
Proceeds from note payable, net $200 in loan costs
—
3,300
Payment of offering cost in connection with issuance of common stock in connection with public offering
(28)
—
Net cash provided by financing activities
1,181
6,437
Net increase in cash, cash equivalents, and restricted cash
3,240
791
Cash, cash equivalents, and restricted cash at beginning of period
7,540
8,380
Cash, cash equivalents, and restricted cash at end of period
$ 10,780
$ 9,171
Supplemental disclosure of cash and non-cash transactions:
Cash paid for interest
$ 199
$ 21
Other receivables related to sale of business
$ 7,000
$ —
Right of use assets obtained in exchange for new lease liabilities
$ 1,572
$ 144
Reconciliation of cash and restricted cash:
Cash and cash equivalents
$ 10,439
$ 9,099
Restricted cash
341
78
Total cash, cash equivalents, and restricted cash shown in statement of cash flows
$ 10,780
$ 9,177
The accompanying notes are an integral part of the condensed consolidated financial statements.
RECONCILIATION OF GAAP TO NON-GAAP FINANCIAL MEASURES
(UNAUDITED)
(In thousands)
Three Months Ended
June 30,
Six Months Ended June 30,
2024
2023
2024
2023
Net loss
$ (1,294)
$ (4,345)
$ (7,221)
$ (10,046)
Gain on sale of business
(2,958)
–
(2,958)
–
Stock based compensation
2,499
3,185
5,151
6,005
Depreciation and amortization
1,319
1,510
2,799
2,867
Other expense, net
629
83
886
226
Income tax expense (benefit)
(6)
25
11
37
Adjusted EBITDA
$ 189
$ 458
$ (1,332)
$ (911)
Note about Non-GAAP Financial Measures
To supplement Fathom’s consolidated financial statements, which are prepared and presented in accordance with GAAP, the Company uses Adjusted EBITDA, a non-GAAP financial measure, to understand and evaluate our core operating performance. This non-GAAP financial measure, which may be different than similarly titled measures used by other companies, is presented to enhance investors’ overall understanding of our financial performance and should not be considered a substitute for, or superior to, the financial information prepared and presented in accordance with GAAP.
Fathom defines the non-GAAP financial measure of Adjusted EBITDA as net income (loss), excluding other income and expense, income taxes, depreciation and amortization, share-based compensation expense, and transaction-related cost.
Fathom believes that Adjusted EBITDA provides useful information about the Company’s financial performance, enhances the overall understanding of its past performance and future prospects, and allows for greater transparency with respect to a key metric used by Fathom’s management for financial and operational decision-making. Fathom believes that Adjusted EBITDA helps identify underlying trends in its business that otherwise could be masked by the effect of the expenses that the Company excludes in Adjusted EBITDA. In particular, Fathom believes the exclusion of share-based compensation expense and transaction-related costs associated with the Company’s acquisition activity, provides a useful supplemental measure in evaluating the performance of its operations and provides better transparency into its results of operations. Adjusted EBITDA also excludes other income and expense, net which primarily includes nonrecurring items, such as, minor legal settlement claims, severance costs, professional fees related to investigating potential financing opportunities, if applicable.
Fathom is presenting the non-GAAP measure of Adjusted EBITDA to assist investors in seeing its financial performance through the eyes of management, and because the Company believes this measure provides an additional tool for investors to use in comparing Fathom’s core financial performance over multiple periods with other companies in its industry.
Adjusted EBITDA should not be considered in isolation from, or as a substitute for, financial information prepared in accordance with GAAP. There are a number of limitations related to the use of Adjusted EBITDA compared to net income (loss), the closest comparable GAAP measure. Some of these limitations are that:
Adjusted EBITDA excludes share-based compensation expense related to restricted stock and restricted stock unit awards and stock options, which have been, and will continue to be for the foreseeable future, significant recurring expenses in Fathom’s business and an important part of its compensation strategy;Adjusted EBITDA excludes transaction-related costs primarily consisting of professional fees and any other costs incurred directly related to acquisition activity, which is an ongoing part of Fathom’s growth strategy and therefore likely to occur; andAdjusted EBITDA excludes certain recurring, non-cash charges such as depreciation and amortization of property and equipment and capitalized software, and acquisition related intangible asset costs, however, the assets being depreciated and amortized may have to be replaced in the future.
View original content to download multimedia:https://www.prnewswire.com/news-releases/fathom-holdings-reports-second-quarter-2024-results-302220166.html
SOURCE Fathom Holdings Inc.









 Technology5 days ago
 Technology4 days ago
 Coin Market5 days ago
 Coin Market4 days ago
 Technology4 days ago
 Technology4 days ago
 Technology4 days ago