Connect with us

Technology

Smart Waste Management Market Set to Grow by USD 4.62 Billion from 2025-2029, Driven by Increasing Urbanization and Urban Waste Generation, Report on How AI is Redefining Market Landscape – Technavio

Published

on

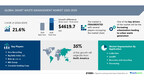
NEW YORK, Feb. 7, 2025 /PRNewswire/ — Report with market evolution powered by AI – The global smart waste management market size is estimated to grow by USD 4.62 billion from 2025-2029, according to Technavio. The market is estimated to grow at a CAGR of  21.6%  during the forecast period. Increasing urbanization leading to urban waste generation is driving market growth, with a trend towards rise in number of strategic partnerships for smart waste management solutions.  However, challenges associated with effective deployment of smart waste management solutions poses a challenge. Key market players include Aco Recycling, Big Belly Solar, LLC., Bine sp. Z o. O., BRE Group, Covanta Holding Corp., Ecube Labs, Enevo Inc., Evreka Yazilim Donanim Danismanlik Egitim Sanayi ve Ticaret A.S., Kantor Waste4Change, Mr. Fill B.V., Nordsense, Pepperl and Fuchs SE, Republic Services Inc., RTS Holding Inc., SENSONEO j. S. A., SUEZ SA, Veolia, Waste Harmonics LLC, Waste Management Inc., and Wellness TechGroup.

Key insights into market evolution with AI-powered analysis. Explore trends, segmentation, and growth drivers- View Free Sample PDF

Smart Waste Management Market Scope

Report Coverage

Details

Base year

2024

Historic period

2019 – 2023

Forecast period

2025-2029

Growth momentum & CAGR

Accelerate at a CAGR of 21.6%

Market growth 2025-2029

USD 4619.7 million

Market structure

Fragmented

YoY growth 2022-2023 (%)

16.1

Regional analysis

North America, Europe, APAC, South America, and
Middle East and Africa

Performing market contribution

North America at 35%

Key countries

US, Germany, China, France, Canada, UK, Japan,
India, Brazil, and UAE

Key companies profiled

Aco Recycling, Big Belly Solar, LLC., Bine sp. Z o.
O., BRE Group, Covanta Holding Corp., Ecube
Labs, Enevo Inc., Evreka Yazilim Donanim
Danismanlik Egitim Sanayi ve Ticaret A.S., Kantor
Waste4Change, Mr. Fill B.V., Nordsense, Pepperl
and Fuchs SE, Republic Services Inc., RTS
Holding Inc., SENSONEO j. S. A., SUEZ SA,
Veolia, Waste Harmonics LLC, Waste Management
Inc., and Wellness TechGroup

Market Driver

The Smart Waste Management Market is experiencing significant growth due to urbanization and smart city initiatives. Key players in the market include Covanta Holding Corporation, Suez Environmental Services, Veolia Environmental Services, Bigbelly Inc, Waste Management, Inc, Sensoneo, Enevo Oy, and others. Trends in the market include the use of advanced technology and innovative strategies for efficient waste collection and disposal. Concerned authorities are focusing on environmental sustainability and stricter environmental regulations. Operational costs are a market restraint, but the use of sensors in waste collection services, route optimization, and real-time monitoring help reduce expenses. Historical data analysis of fill patterns, driver routes, and schedules also contributes to efficiency. Companies are investing in IoT-based systems, such as smart bins and disposal tags, for residential buildings, commercial spaces, and public places. The market drivers are the interest of companies in renewable benefits, recycling of plastic and e-waste, and the municipal and industrial sectors’ need for sustainable waste management. Smart Collection, Smart Disposal, and Solid Waste segments are expected to dominate the market. The European Commission and the Government of Canada are also promoting smart waste management through environmental awareness and regulations. The waste management sector includes collecting, transportation, processing, and disposal of solid municipal waste, urban waste collection, waste material services, and more. The use of cameras, mobile computers, RFID, GPS, IoT sensors, and waste segregation technologies is increasing. The chemical manufacturing industry generates a large volume of waste, and companies are focusing on reducing carbon emissions through clean energy solutions and reusing resources like methane and CO2 gas. Innovative strategies include the use of sensors in waste collection vehicles for real-time tracking and optimization, and the implementation of cloud-based technologies for data analytics. The market is expected to grow despite higher operational costs due to the benefits of smart waste management for public health, environmental regulations, and the reduction of greenhouse gas emissions. 

Vendors in the smart waste management market are forming strategic partnerships with various entities, including government authorities and other vendors. These collaborations enable market expansion and revenue sharing. These partnerships offer real-time information tracking for end-users, enabling data-driven decision-making and real-time monitoring of trash levels. The rise in strategic alliances is boosting the implementation of smart waste management solutions, leading to the deployment of efficient systems worldwide. These solutions will be compatible with advanced technologies and components integrated into trash bins, providing real-time waste collection information. This trend will fuel the growth of the global smart waste management market throughout the forecast period. 

Request Sample of our comprehensive report now to stay ahead in the AI-driven market evolution!

 Market Challenges

The Smart Waste Management market is growing due to urbanization and smart city initiatives, but faces challenges such as operational costs and environmental regulations. Trash collectors deal with waste or garbage production, while concerned authorities focus on public health and environmental sustainability. Recycling and disposal are key areas of innovation, with companies like Covanta Holding Corporation, Suez Environmental Services, and Veolia Environmental Services leading the way. Advance technology and sensors play a major role, with IoT-based systems and route optimization providing efficiency gains. E-waste management is a significant market driver, with key players offering reprocessing waste services. However, higher operational costs can be a market restraint. Companies are investing in capital for smart waste management solutions for residential buildings, commercial spaces, and public places using sensor-based containers, vacuum containers, and disposal tags. Solid municipal waste and urban waste collection are major segments, with the European Commission and governments pushing for strict environmental regulations. The waste management sector is also exploring clean energy solutions and renewable resources to reduce carbon emissions.Smart waste management involves the collection, disposal, and recycling of trash. Private companies and municipalities use trucks to collect waste from sensors-equipped bins, which send signals to the trucks’ readers. Ineffective sensor deployment can lead to incorrect information, such as overfilled bins being reported as full or underfilled bins being overlooked. This can result in inefficient waste collection and recycling processes. To optimize these systems, it’s crucial to ensure accurate sensor deployment and regular maintenance. Smart waste management solutions aim to reduce operational costs, minimize environmental impact, and enhance overall efficiency.

Discover how AI is revolutionizing market trends- Get your access now!

Segment Overview 

This smart waste management market report extensively covers market segmentation by  

ApplicationCollectionLandfillRecovery And RecyclingProcessingTypeSolid WasteSpecial WasteE-wasteGeographyNorth AmericaEuropeAPACSouth AmericaMiddle East And Africa

1.1 Collection-  The collection segment of the global smart waste management market holds the largest share due to the traditional method of waste management facing challenges such as uneven management of domestic, industrial, and environmental wastes, leading to pollution and health hazards. Smart waste management systems address these issues by automating waste management through smart technology, minimizing human intervention, and reducing time and effort. These solutions enable efficient waste disposal by optimizing truck routes and analyzing trash levels in bins. With the increasing production of solid waste in municipalities, amounting to 2.01 billion tons per year, and projected to reach 3.40 billion tons by 2050, smart waste management is crucial for managing waste effectively. By connecting garbage collection and disposal infrastructure and devices across cities and communities, smart waste management plays a significant role in making cities more efficient and sustainable. Companies, hotels, and enterprises are partnering with smart waste management solution providers to integrate these solutions for managing and collecting waste.

Download a Sample of our comprehensive report today to discover how AI-driven innovations are reshaping competitive dynamics

Research Analysis

Smart Waste Management refers to the implementation of technology and data analytics in waste collection and disposal processes to optimize resources, reduce costs, and improve efficiency. In residential buildings, commercial spaces, and public places, sensor-based containers and vacuum systems are used to monitor the volume of waste and trigger automatic collection. IoT-based waste bins with sensors, cameras, mobile computers, RFID, and GPS enable intelligent monitoring, route optimization, and waste segregation. Solid municipal waste is collected using sensor technologies and disposed of through waste processing facilities. Disposal tags help track waste disposal and ensure compliance with regulations. Smart city initiatives are driving the adoption of these technologies to create sustainable waste management systems. The integration of IoT sensors, cameras, and mobile computers enables real-time monitoring and analysis of trash production, leading to more effective and efficient waste management services.

Market Research Overview

The Smart Waste Management market is a growing sector driven by urbanization, smart city initiatives, and concerned authorities’ increasing focus on environmental sustainability and public health. The market is characterized by advance technology and innovative strategies, including sensor-based waste collection and IoT-based systems. Operational costs are a significant concern, with the use of sensors, route optimization, and real-time monitoring helping to improve efficiency and reduce expenses. Environmental regulations and the interest of companies in renewable benefits are also key market drivers. Key market insights reveal that solid municipal waste, e-waste, and commercial waste segments are the largest contributors to the market. Historical data analysis of fill patterns, driver routes, and schedules helps optimize waste collection services, while remote monitoring and fuel prices impact operational costs. Sustainable waste management, data analytics, and government initiatives are also significant factors influencing the market. The market is expected to grow significantly due to the increasing volume of waste, the need for efficient waste management, and the availability of capital investments. Companies are investing in smart solutions such as sensor-based containers, vacuum containers, disposal tags, and fleet trucks to reduce carbon emissions and improve waste management sector efficiency. The use of sensors, RFID, GPS, and IoT sensors in waste segregation and waste processing is also gaining popularity. The European Commission and the Government of Canada are leading the way in implementing strict environmental regulations and promoting sustainable waste management practices. The market also includes the management of bio-medical waste, methane emissions from landfills, and the recycling of plastic and e-waste. The waste management industry is evolving to include water management, traffic management, energy management, and fleet management, with the use of short-range and wide-area IoT devices and real-time tracking. The market is expected to face market restraints due to higher operational costs and the need for capital investments. The market is expected to grow significantly in the coming years due to the increasing focus on environmental sustainability, the availability of renewable energy resources, and the need for efficient waste management solutions.

Table of Contents:

1 Executive Summary
2 Market Landscape
3 Market Sizing
4 Historic Market Size
5 Five Forces Analysis
6 Market Segmentation

ApplicationCollectionLandfillRecovery And RecyclingProcessingTypeSolid WasteSpecial WasteE-wasteGeographyNorth AmericaEuropeAPACSouth AmericaMiddle East And Africa

7 Customer Landscape
8 Geographic Landscape
9 Drivers, Challenges, and Trends
10 Company Landscape
11 Company Analysis
12 Appendix

About Technavio

Technavio is a leading global technology research and advisory company. Their research and analysis focuses on emerging market trends and provides actionable insights to help businesses identify market opportunities and develop effective strategies to optimize their market positions.

With over 500 specialized analysts, Technavio’s report library consists of more than 17,000 reports and counting, covering 800 technologies, spanning across 50 countries. Their client base consists of enterprises of all sizes, including more than 100 Fortune 500 companies. This growing client base relies on Technavio’s comprehensive coverage, extensive research, and actionable market insights to identify opportunities in existing and potential markets and assess their competitive positions within changing market scenarios.

Contacts

Technavio Research
Jesse Maida
Media & Marketing Executive
US: +1 844 364 1100
UK: +44 203 893 3200
Email: media@technavio.com
Website: www.technavio.com/

View original content to download multimedia:https://www.prnewswire.com/news-releases/smart-waste-management-market-set-to-grow-by-usd-4-62-billion-from-2025-2029–driven-by-increasing-urbanization-and-urban-waste-generation-report-on-how-ai-is-redefining-market-landscape—technavio-302370843.html

SOURCE Technavio

Continue Reading
Click to comment

Leave a Reply

Your email address will not be published. Required fields are marked *

Technology

Reach Showcases Full-Stack Product Portfolio for AI Vehicle Intelligent Evolution at Auto China 2026

Published

on

By

BEIJING, April 30, 2026 /PRNewswire/ — At Auto China 2026, Reach officially unveiled its full-stack product portfolio designed to accelerate the intelligent evolution of AI vehicles. Industry leaders and experts, along with executives and representatives from Honda, Toyota, FAW, Geely, GAC, Dongfeng Voyah, FAW Jiefang, BMW, Volkswagen CARIAD, Chery, Nissan, Mazda, Hitachi Astemo, Bosch, UAES, ZTE Microelectronics and other global OEMs and industry partners, visited the booth for in-depth discussions on the future of AI-powered mobility and intelligent vehicle evolution.

At the show, Reach demonstrated how AI vehicles are moving from “responding to commands” to “understanding intent and proactively serving users.” Human-vehicle interaction is evolving from isolated smart functions to integrated intelligent experiences, creating a new vision for future mobility.

Supporting this transformation is Reach’s full-stack portfolio covering five key areas: AI Vehicle Neural Foundation, Emotional Cognition, Intelligent Driving Brain, Vehicle-Cloud Computational Brain, and Energy Heart.

At the core is NeuSAR OS, the digital foundation for AI vehicles. Backed by over 10 million production deployments, it provides secure, reliable, and scalable support for AI applications, enabling unified management of vehicle-wide capabilities, cross-domain resources, and AI Agents while improving development efficiency by 30%–50%.

Cloud OS introduces a vehicle-cloud collaborative computing architecture that allows flexible scheduling between onboard small models and cloud-based large models, reducing hardware dependency and optimizing computing costs.

For intelligent driving, Reach’s full-stack AI solution and fifth-generation architecture NeuAUTO support faster mass production across passenger and commercial vehicles through unified software architecture and end-to-end AI models.

Reach AI Data-driven EV power system enables proactive battery health management and energy optimization. It also introduced AI-powered automated testing systems to improve testing efficiency and coverage.

Reach also launched its lifecycle-wide AI Agent solution, built on a full-domain data platform and intelligent systems for planning, after-sales, and operations, it supports product planning, price forecasting, safety monitoring, and customer operations across the full vehicle lifecycle.

As AI vehicles evolve toward full-system intelligence, system-level capability building and ecosystem collaboration are becoming the key to competitiveness. Reach is collaborating with global OEMs, Tier 1 suppliers, and semiconductor partners to accelerate large-scale industrial deployment.

Looking ahead, Reach continues advancing its full-stack portfolio through stronger innovation and deeper ecosystem collaboration, enabling vehicles evolve into true intelligent agents and delivering smarter, safer, and more trusted mobility experiences worldwide.

View original content to download multimedia:https://www.prnewswire.com/apac/news-releases/reach-showcases-full-stack-product-portfolio-for-ai-vehicle-intelligent-evolution-at-auto-china-2026-302759688.html

SOURCE Reach

Continue Reading

Technology

Hydreight Reports Record Fiscal 2025 Results as VSDHOne Drives Rapid Growth and Platform Scale

Published

on

By

Achieves profitability, scales to 11,000+ platform licenses, and strengthens balance sheet with $15.7M in cash 

VANCOUVER, BC and LAS VEGAS, April 30, 2026 /PRNewswire/ – Hydreight Technologies Inc. (“Hydreight” or the “Company”) (TSXV: NURS) (OTCQB: HYDTF) (FSE: SO6), a U.S.-focused digital health infrastructure platform, is pleased to report its audited financial results for the year ended December 31, 2025. All figures are in Canadian dollars unless otherwise stated. All references to Non-GAAP Financial Measures1 2 are as reported in the Company’s amended and restated Management Discussion and Analysis dated April 30, 2026 (“MD&A”).

Revenue reached $35.4M in 2025, with $43.6M in Adjusted Revenue1 (non-GAAP) and $2.5M in Adjusted EBITDA2 (non-GAAP), reflecting strong growth and improving operating leverage.

The Company achieved net income of $1.69M and continued to scale its platform, driven by accelerating adoption of VSDHOne and expanding transaction volumes across its national healthcare network.

FULL YEAR 2025 HIGHLIGHTS

All comparisons below are to the year ended December 31, 2024, unless otherwise noted.

Revenue: $35.4M vs. $16.04M (+121% YoY)Adjusted Revenue:(1) $43.56M vs. $22.32M (+95% YoY)Adjusted EBITDA:(2) $2.5M vs. $136K (+1,765% YoY)Rising Operating Leverage: OPEX as a % of revenue fell from 38% to 22%2025 Year-end Cash Position: $15.65M vs. $1.19M (strong balance sheet improvement)Positive Adjusted EBITDA2 across the year, reflecting improving operating leverageOver 11,000 licenses signed across the VSDHOne platform, which the Company believes demonstrates strong demand and accelerating adoption

4th QUARTER 2025 HIGHLIGHTS

All comparisons below are to the quarter ended December 31, 2024, unless otherwise noted

Revenue: $14.95M vs. $4.04M (+270% YoY)Adjusted Revenue:(1) $16.85M vs. $5.74M (+193% YoY)Adjusted EBITDA:(2) $1.58M vs. ($0.1M)Rising Operating Leverage: OPEX as a % of revenue fell to 15% in Q4 2025, versus 34% in Q4 2024

The Company believes the following Non-GAAP financial measures provide meaningful insight to its shareholders in understanding the Company’s performance and may assist in the evaluation of the Company’s business relative to that of its peers.

Notes:

(1) “Adjusted Revenue” is a non-GAAP financial measure, and the figures reflect gross economic activity processed through the Company’s platform and should not be considered revenue recognized under IFRS. See “Non-GAAP Financial Measures” section below for definition.

(2) “Adjusted EBITDA” is a non-GAAP financial measure and reflects EBITDA plus additions for atypical and non-recurring charges. See “Non-GAAP Financial Measures” section below for definition.

The following table is included to provide a reconciliation of the Company’s non-GAAP financial measures to the most directly comparable IFRS measures and to enhance the comparability and transparency of the Company’s financial performance for investors.

    Three months ended December 31,

        Twelve months ended December 31,

2025

2024

%
change

2025

2024

%
change

Adjusted Revenue

$                   16,853,102

$     5,742,523

193 %

$               43,563,753

$            22,321,265

95 %

  Deduct – deferred business partner contract
revenue

(313,878)

208,436

425,945

(45,317)

  Deduct – business partner payouts on app
service gross revenue

2,218,121

1,493,509

7,752,770

6,321,866

GAAP Revenue

$                   14,948,859

$     4,040,578

270 %

$               35,385,038

$            16,044,716

121 %

Adjusted Gross Margin

$                     2,924,341

$     1,580,387

85 %

$                 9,429,151

$              5,650,936

67 %

  Deduct – deferred business partner contract
revenue

(313,878)

208,436

425,945

(45,317)

GAAP Gross Margin

$                     3,238,219

$     1,371,951

136 %

$                 9,003,206

$              5,696,253

58 %

Adjusted EBITDA

$                     1,577,760

$         (83,191)

$                 2,542,895

$                 136,334

1765 %

  Deduct – amortization and depreciation

127,982

62,853

452,772

181,136

  Deduct – share-based payments

8,843

87,889

82,385

614,877

  Deduct – interest and accretion

452,209

586,354

  Deduct – sales tax provision, net cash paid

252,603

(254,510)

252,603

(254,510)

  Deduct – impairment charge

54,814

54,814

  Deduct – income tax expense

(119,249)

(119,249)

  Deduct – deferred tax recovery

699,586

699,586

GAAP Net Income (Loss)

$                     1,261,646

$          20,577

6031 %

$                 1,694,304

$                (405,169)

518 %

Shane Madden, CEO of Hydreight, commented:

“2025 was a defining year for Hydreight. We transitioned from a growing platform into a scaled healthcare infrastructure business, with strong revenue growth and sustained profitability.

The acceleration we saw in the second half of the year was driven largely by the rollout of VSDHOne, which is now becoming a meaningful contributor to both revenue and long-term scalability.

As we move into 2026, our focus is on expanding our partner network, increasing transaction volume across the platform, and continuing to grow our compliant healthcare infrastructures in the United States.”

BUSINESS PERFORMANCE & DRIVERS

VSDHOne – Core Growth Engine

The Company’s VSDHOne platform, launched in 2025, was a primary driver of growth, contributing to:

Rapid onboarding of new partnersExpansion of direct-to-consumer healthcare brandsIncreased transaction volume across telehealth and pharmacy services

Revenue growth in 2025 was primarily driven by VSDHOne-related activity, combined with continued organic growth across existing partners.

The platform ramped significantly through the second half of the year, with Q4 alone contributing $14.9M in revenue, representing approximately 270% growth compared to the same period in 2024. This acceleration reflects strong demand from partners seeking compliant, turnkey solutions and demonstrates the Company’s ability to scale transaction volume efficiently across its infrastructure.

OPERATING METRICS & VOLUME GROWTH

Operational performance across the Company’s core verticals continued to strengthen throughout 2025.

The Company’s first two verticals continued their historical growth in 2025, supported by alignment with broader market trends and the introduction of direct-to-consumer products and services through Hydreight’s proprietary platform structure.

Completed Services revenue in Q4 2025 for the first vertical increased by approximately 44% compared to the same period in 2024Completed Services revenue for the first vertical in 2025 increased by approximately 17% compared to 2024New nurse sign-ups increased by approximately 45% in 2025 compared to 2024

These metrics reflect continued growth in the Company’s core service offerings, expansion of its provider network, and increasing utilization across the platform.

PLATFORM SCALE & NETWORK EFFECTS

Hydreight continues to expand its position as a leading healthcare infrastructure platform:

11,000+ licenses signed across VSDHOneNational footprint across all 50 U.S. statesNetwork of healthcare providers, pharmacies, and partners

The Company believes that this scale reflects growing demand from businesses seeking compliant, turnkey solutions to enter and expand within the U.S. healthcare market.

MULTI-VERTICAL REVENUE MODEL

Hydreight generates revenue across three primary streams:

Business partner subscription contractsTelehealth consultation and platform commissionsPharmacy sales

Growth was supported by:

Expansion of product offerings (GLP-1s, peptides, NAD, TRT, and more)Increased partner utilizationBroader adoption across wellness verticals

PROFITABILITY & OPERATING LEVERAGE

Hydreight achieved strong improvements in Adjusted EBITDA, a non-GAAP measure:

Adjusted EBITDA: $2.5M in 2025 vs. $0.14M in 2024 (+1,765% YoY)Net income (loss): $1.69M in 2025 vs. $(0.41)M in 2024

Performance strengthened meaningfully in the fourth quarter, reflecting the scaling of the platform in the second half of the year.

Q4 Adjusted EBITDA: $1.58M vs. ($0.10M) in Q4 2024

This reflects:

Platform scalabilityRevenue growth outpacing cost increasesImproved operational efficiency

This improvement reflects the operating leverage inherent in the Company’s platform model and was not solely a function of higher revenue. As transaction volumes scaled across VSDHOne, incremental revenue flowed through at higher margins, supported by a largely fixed regulatory, pharmacy, and technology infrastructure. As a result, revenue growth outpaced cost growth, driving improved profitability and demonstrating the scalability of the Company’s platform.

¹ See “Non-GAAP Financial Measures and Reconciliation”.

BALANCE SHEET & LIQUIDITY

Cash: $15.65M (vs. $1.2M in 2024)Working Capital: ~$15.7M (vs. deficiency of $2.5M in 2024)Strong capital position to support ongoing operations

The Company also completed a $15M financing in January 2026, subsequent to year‑end, further strengthening its ability to scale operations and pursue strategic initiatives.

Including the $15M financing completed in January 2026, the Company has access to over $30.7M in capital to support growth initiatives.

Please see SEDAR+ for the Company’s consolidated audited financial statements and MD&A for the year ended December 31, 2025.

STRATEGIC INITIATIVES & MILESTONES

Hydreight continues to expand its platform through strategic initiatives and partnerships.

During 2025, the Company:

Strengthened its vertically integrated healthcare infrastructureExpanded its national pharmacy networkInvested in next-generation platform capabilities (VSDHOne 2.0)Established strategic relationships to enhance product innovation and distribution

In 2026, Hydreight further expanded its strategic initiatives through an investment in Insu Therapeutics, a company focused on developing innovative delivery mechanisms for peptide-based therapies. This aligns with Hydreight’s long-term strategy of supporting next-generation treatments across its platform.

OUTLOOK

Hydreight is entering 2026 with strong momentum, supported by:

Continued onboarding of new partnersIncreasing transaction volumes across VSDHOneRecent capital deployment initiativesExpansion into new healthcare verticals

As of the end of Q1 2026, VSDHOne has surpassed 12,000 licenses sold, reflecting continued momentum in platform adoption.

Management remains focused on scaling the platform while maintaining disciplined growth and operational efficiency.

“We look forward to discussing these results in more detail on our upcoming earnings call.” -Shane Madden

ANNUAL FILINGS

The Company’s audited annual financial statements for the year ended December 31, 2025, and the associated MD&A, including a full discussion of non-GAAP financial measures and their reconciliation to IFRS measures, have been filed on SEDAR+ at www.sedarplus.ca and are available on the Company’s issuer profile. Readers are encouraged to review the complete financial statements and MD&A in conjunction with this press release. The Company refiled its MD&A to correct a typographical error in the calculation of Adjusted EBITDA. No other changes have been made.

UPCOMING EARNINGS CALL

Hydreight Technologies will host a live earnings call to discuss its Q4 and full-year 2025 financial results, provide a business update, and outline the Company’s strategic priorities heading into 2026.

Date & Time: Friday, May 1, 2026 at 9:00am – 10:00pm EST

Registration Link: https://hydreight.zoom.us/webinar/register/WN_vP-U6hAiRf2Ejg8muQcocQ

The call will include a formal presentation followed by a live Q&A session. Investors are encouraged to attend to gain deeper insight into Hydreight’s growth strategy and platform expansion.

Clarification on Engagement of GRA Enterprises

Further to the Company’s news release early last year dated February 27, 2025, the Company wishes to clarify that its prior 3-month engagement of GRA Enterprises LLC (doing business as National Inflation Association) (“GRA”) was not renewed and as such was terminated effective May 27, 2025.

Under the engagement, the Company paid GRA an aggregate fee of USD $30,000 in cash pursuant to the GRA Engagement. The fee was paid from general working capital at the commencement of the engagement. No securities, stock options, or other equity-based compensation were issued or granted in connection with the engagement.

The engagement was conducted at arm’s length and has been fully concluded, with no ongoing obligations or amounts payable by the Company.  To the Company’s knowledge, neither GRA nor its principal, Gerard Adams, holds any direct or indirect interest in the Company or its securities, nor any right to acquire such an interest.

On behalf of the Board of Directors

Shane Madden
Director and Chief Executive Officer
Hydreight Technologies Inc.

Hydreight Technologies Inc Ranked Number 56 Fastest-Growing Company in North America on the 2024 Deloitte Technology Fast 500™

Hydreight Technologies Recognized as a Top 50 TSX Venture Exchange Company

About Hydreight Technologies Inc.
Hydreight Technologies Inc is building one of the largest mobile clinic networks in the United States. Its proprietary, fully integrated platform has hosted a network of over 3000 nurses, over 300 doctors and a pharmacy network through its Doctor networks across 50 states. The platform includes a built-in, easy-to-use suite of fully integrated tools for accounting, documentation, sales, inventory, booking, and managing patient data, which enables licensed healthcare professionals to provide services directly to patients at home, office or hotel. Hydreight is bridging the gap between provider compliance and patient convenience, empowering nurses, med spa technicians, and other licensed healthcare professionals. The Hydreight platform allows healthcare professionals to deliver services independently, on their own terms, or to add mobile services to existing location-based operations. Hydreight has a 503B pharmacy network servicing all 50 states and is closely affiliated with a U.S. certified e-script and telemedicine provider network.

About VSDHOne – Direct to Consumer Platform
Developed in partnership with Victory Square Technologies (CSE: VST) (OTC: VSQTF) (FWB: 6F6), Hydreight Technologies launched the VSDHOne platform. VSDHOne simplifies the entry challenges for companies and medi-spa businesses to enter the online healthcare space compliantly. This platform is expected to help businesses launch direct-to-consumer healthcare brand in a matter of days in all 50 states. Compliant offerings include: GLP-1s, peptides, personalized healthcare treatments, sermorelin, testosterone replacement therapy (“TRT”), hair loss, skincare, sexual health and more. Hydreight invested in technology, legal and infrastructure to launch this platform. The VSDHOne platform offers a complete, and modular end-to-end solution for businesses looking to launch direct-to-consumer healthcare brands. From compliance and telemedicine technology to nationwide doctor and pharmacy networks, VSDHOne provides all the tools needed for a seamless entry into the online healthcare space. The platform is designed to significantly reduce the time and costs associated with launching such services, making it possible for businesses to go live in days instead of months.

Neither TSXV nor its Regulation Services Provider (as that term is defined in policies of the TSXV) accepts responsibility for the adequacy or accuracy of this release.

Use of Non-GAAP Financial Measures:
The Company uses certain non-GAAP financial measures to assess its operating performance, and this press release contains non-GAAP financial measures, including “Adjusted Revenue” and “Adjusted EBITDA”. These measures are not recognized under International Financial Reporting Standards (“IFRS”) and do not have standardized meanings prescribed by IFRS or GAAP.

The Company defines Adjusted Revenue as gross cash income before adjustment for the deferred portion of business partner contract revenue and gross receipts from Hydreight App service sales. The Company defines Adjusted Gross Margin as GAAP gross margin plus inventory impairment plus the deferred portion of business partner contract revenue. The Company defines Adjusted EBITDA as net income (loss) before interest, taxes, depreciation and amortization and before (i) transaction, restructuring, and integration costs (ii) share-based payments expense, (iii) gains/losses that are not reflective of ongoing operating performance including inventory impairment and (iv) sales tax provision, net of actual cash payments to state tax authorities. 

Adjusted Revenue reflects the gross economic activity processed through the Company’s platform during the applicable period and may differ materially from revenue recognized under IFRS, which is based on revenue recognition and deferral requirements. Adjusted Revenue is not a measure of financial performance or profitability and should not be considered a substitute for revenue determined in accordance with IFRS.  As used, Adjusted Revenue accelerates cash receipts relative to IFRS revenue recognition. Adjusted EBITDA should not be considered in isolation or as a substitute for net income (loss) prepared in accordance with IFRS.

The Company believes that these non‑GAAP measures provide information useful to investors in understanding historical operating trends and the scale of the Company’s platform relative to its peers but does not intend for such measures to represent future performance. This data is furnished to provide additional information and does not have any standardized meaning prescribed by IFRS. Accordingly, it should not be considered in isolation or as a substitute for measures of performance prepared in accordance with IFRS and is not necessarily indicative of other metrics presented in accordance with IFRS.

Cautionary Note Regarding Forward-Looking Information
This press release contains statements which constitute “forward-looking information” within the meaning of applicable securities laws, including statements regarding the plans, intentions, beliefs and current expectations of the Company with respect to future business activities and operating performance. Forward-looking information is often identified by the words “may”, “would”, “could”, “should”, “will”, “intend”, “plan”, “anticipate”, “believe”, “estimate”, “expect” or similar expressions and includes information regarding expectations for the Company’s 2026 strategic outlook, growth, platform scaling initiatives, and anticipated expansion of VSDHOne and other platform offerings.

Forward‑looking information is based on management’s expectations, estimates and assumptions as of the date hereof, including assumptions regarding: continued partner adoption, stable regulatory regimes applicable to telehealth and pharmacy operations in the United States, availability of capital, and general economic conditions.

Investors are cautioned that forward-looking information is not based on historical facts but instead reflects the Company’s management’s expectations, estimates or projections concerning future results or events based on the opinions, assumptions and estimates of management considered reasonable at the date the statements are made. Although the Company believes that the expectations reflected in such forward-looking information are reasonable, such information involves risks and uncertainties, and undue reliance should not be placed on such information, as unknown or unpredictable factors could have material adverse effects on future results, performance or achievements of the Company.

Among the key factors that could cause actual results to differ materially from those projected in the forward-looking information are the following: the ability to obtain requisite regulatory and other approvals with respect to the business operated by the Company and/or the potential impact of the listing of the Company’s shares on the TSXV on relationships, including with regulatory bodies, employees, suppliers, customers and competitors; changes in general economic, business and political conditions, including changes in the financial markets; changes in applicable laws; compliance with extensive government regulation; and the diversion of management time as a result of being a publicly listed entity. This forward-looking information may be affected by risks and uncertainties in the business of the Company and market conditions.

Should one or more of these risks or uncertainties materialize, or should assumptions underlying the forward-looking information prove incorrect, actual results may vary materially from those described herein as intended, planned, anticipated, believed, estimated or expected. Although the Company has attempted to identify important risks, uncertainties and factors which could cause actual results to differ materially, there may be others that cause results not to be as anticipated, estimated or intended. The Company does not intend, and does not assume any obligation, to update this forward-looking information except as otherwise required by applicable law.

View original content to download multimedia:https://www.prnewswire.com/news-releases/hydreight-reports-record-fiscal-2025-results-as-vsdhone-drives-rapid-growth-and-platform-scale-302759724.html

SOURCE Hydreight Technologies Inc.

Continue Reading

Technology

Scaled Commercial Breakthrough: OMODA & JAECOO AiMOGA Robotics Secures 1,000 Robot Orders, Boosting Smart City Deployment Step by Step

Published

on

By

KUALA LUMPUR, Malaysia and WUHU, China, May 1, 2026 /PRNewswire/ — In response to steady advancement of smart city construction and the actual demand for efficient, low-cost urban public service equipment, OMODA & JAECOO officially launched the full-scale commercial layout of AiMOGA Robotics at the 2026 Chery International Business Summit in Wuhu. Centering on the theme “Driven by Scenarios, United for Growth”, the event witnessed a key industrial breakthrough: AiMOGA Intelligent Police Robots secured 1,000 intentional signing orders and completed an official concentrated delivery of 100 units, laying a solid foundation for orderly large-scale promotion and practical scenario operation in urban roads, traffic hubs and daily public governance links.

Jointly developed by OMODA & JAECOO and the professional AiMOGA technical team, the robotic product lineup covers humanoid robots, quadruped robots and core intelligent patrol robots. Drawing on the brand’s mature intelligent vehicle underlying technologies in perception, planning and control, the equipment retains high operational stability. It can well adapt to daily road conditions and climatic environments, independently completing core practical tasks such as real-time traffic guidance, illegal parking identification and fixed-route auxiliary patrols, effectively assisting local frontline staff and optimizing urban refined management efficiency.

Chery Group pointed out that intelligent vehicles and robots share core technological homology, and the batch signing and delivery officially means AiMOGA enters the stage of large-scale standardized commercialization. The products have been iteratively optimized in more than 100 real scenarios across 50 countries including Malaysia, with reliable performance that meets local application standards. Relying on supporting facilities such as university talent cooperation projects, 31 innovation laboratories and a special robot leasing platform launched at the conference, OMODA & JAECOO will steadily improve local supporting service capabilities. The brand will rely on its global channel advantages to accelerate the localized landing of embodied intelligent equipment, pragmatically empower the steady development of smart urban governance industry, and jointly build a complete regional intelligent service ecology with local partners.

View original content to download multimedia:https://www.prnewswire.com/apac/news-releases/scaled-commercial-breakthrough-omoda–jaecoo-aimoga-robotics-secures-1-000-robot-orders-boosting-smart-city-deployment-step-by-step-302758705.html

SOURCE OMODA & JAECOO

Continue Reading

Trending