
Technology
EPAM Reports Results for Fourth Quarter and Full Year 2024
Published
1 year agoon
By
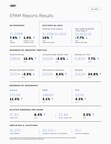
Fourth Quarter 2024
Revenues of $1.248 billion, up 7.9% year-over-yearGAAP Income from Operations was 10.9% of revenues and Non-GAAP Income from Operations was 16.7% of revenuesGAAP Diluted EPS of $1.80, an increase of 8.4%, and Non-GAAP Diluted EPS of $2.84, an increase of 3.3% on a year-over-year basis
Full Year 2024
Revenues of $4.728 billion, up 0.8% year-over-yearGAAP Income from Operations was 11.5% of revenues and Non-GAAP Income from Operations was 16.5% of revenuesGAAP Diluted EPS of $7.84, an increase of 11.0%, and Non-GAAP Diluted EPS of $10.86, an increase of 2.5% on a year-over-year basis
NEWTOWN, Pa., Feb. 20, 2025 /PRNewswire/ — EPAM Systems, Inc. (NYSE: EPAM), a leading digital transformation services and product engineering company, today announced results for its fourth quarter and full year ended December 31, 2024.
“After navigating a dynamic year, we are pleased to report a strong fourth quarter. We continued to build sequential momentum, and saw a return to year-over-year organic growth, while we simultaneously accelerated our global strategy with the acquisitions of NEORIS and First Derivative,” said Arkadiy Dobkin, CEO & President, EPAM. “As we look ahead, we believe 2025 will be a year of transition, as clients balance their cost focus with the need to accelerate their transformational and GenAI journeys. We see a strong need to continue to invest in our talent, advanced technological and consulting capabilities, and the integration of recent acquisitions to best position ourselves to capture market share once demand returns to more normalized levels.”
Fourth Quarter 2024 Highlights
Revenues increased to $1.248 billion, a year-over-year increase of $91.1 million, or 7.9%. On an organic constant currency basis, revenues grew 1.0% compared to the fourth quarter of 2023;GAAP income from operations was $136.5 million, an increase of $14.0 million, or 11.4%, compared to $122.5 million in the fourth quarter of 2023;Non-GAAP income from operations was $208.2 million, an increase of $7.8 million, or 3.9%, compared to $200.4 million in the fourth quarter of 2023;Diluted earnings per share (“EPS”) on a GAAP basis was $1.80, an increase of $0.14, or 8.4%, compared to $1.66 in the fourth quarter of 2023;Non-GAAP diluted EPS was $2.84, an increase of $0.09, or 3.3%, compared to $2.75 in the fourth quarter of 2023;Completed the acquisition of NEORIS creating a competitive offering for clients across Latin America and in Spanish- and Portuguese-speaking countries, while broadening EPAM’s global and nearshore delivery capabilities across Latin America and Europe; andCompleted the acquisition of First Derivative strengthening EPAM’s financial services consulting and delivery capabilities in North America, Europe and APAC and expanding our client portfolio in financial services.
Full Year 2024 Highlights
Revenues increased to $4.728 billion, a year-over-year increase of $37.4 million, or 0.8%. On an organic constant currency basis, revenues declined 1.7% year-over-year;We recorded a benefit of $68.8 million for research & development government incentives in Poland. Specifically, $23.5 million of the benefit related to activities performed during 2023 and $45.3 million of the benefit related to activities performed during the full year of 2024. This benefit was included as a reduction to our Cost of revenues. The impact of this benefit on net income was partially offset as the incentives drove a higher effective tax rate for both GAAP and non-GAAP results. We expect the incentive will be recurring with benefits recognized continuing in the future;GAAP income from operations was $544.6 million, an increase of $43.3 million, or 8.6%, compared to $501.2 million in 2023. GAAP income from operations benefited from the recognition of $68.8 million of incentives related to research and development activities performed in Poland and was negatively impacted by $31.3 million of costs incurred in connection with the Company’s Cost Optimization Programs;Non-GAAP income from operations was $779.2 million, an increase of $14.1 million, or 1.8%, compared to $765.1 million in 2023. Non-GAAP income from operations benefited from the recognition of $45.3 million of incentives related to research and development activities performed in Poland in 2024;Diluted EPS on a GAAP basis was $7.84, an increase of $0.78, or 11.0%, compared to $7.06 in 2023. EPS on a GAAP basis was positively impacted by the recognition of the Polish incentives, which increased income from operations. However, this benefit was partially offset by an increase to the effective tax rate; andNon-GAAP diluted EPS was $10.86, an increase of $0.27, or 2.5%, compared to $10.59 in 2023. EPS on a non-GAAP basis was positively impacted by the recognition of the Polish incentives for activities performed during the full year of 2024, which increased income from operations. However, this benefit was partially offset by an increase to the effective tax rate.
Cash Flow and Other Metrics
Cash provided by operating activities was $130.3 million in the fourth quarter of 2024, a decrease from $171.4 million in the fourth quarter of 2023; and was $559.2 million in 2024, a decrease from $562.6 million in 2023;The Company repurchased 53 thousand shares of its common stock for $13.0 million during the fourth quarter of 2024 under its share repurchase program. During the year ended December 31, 2024, the Company repurchased 1,854 thousand shares of its common stock for $398.0 million under its share repurchase programs. As of December 31, 2024, the Company had $437.0 million remaining under its share repurchase authorization;Cash, cash equivalents and restricted cash totaled $1.290 billion as of December 31, 2024, a decrease of $752.7 million, or 36.8%, from $2.043 billion as of December 31, 2023 largely the result of payments for the acquisitions of NEORIS and First Derivative; andTotal headcount was approximately 61,200 as of December 31, 2024. Included in this number were approximately 55,100 delivery professionals, an increase of 16.3% from December 31, 2023.
2025 Outlook – Full Year and First Quarter
Full Year
EPAM expects the following for the full year:
The Company expects the year-over-year revenue growth rate to be in the range of 10.0% to 14.0% for 2025. The Company expects the year-over-year revenue growth rate on an organic constant currency basis to be in the range of 1.0% to 5.0%;For the full year, EPAM expects GAAP income from operations to be in the range of 9.0% to 10.0% of revenues and non-GAAP income from operations to be in the range of 14.5% to 15.5% of revenues;The Company expects its GAAP effective tax rate and its non-GAAP effective tax rate to both be approximately 24.0%; andEPAM expects GAAP diluted EPS will be in the range of $6.78 to $7.08 for the year, and non-GAAP diluted EPS will be in the range of $10.45 to $10.75 for the year. The Company expects weighted average diluted shares outstanding for the year of 58.1 million.
First Quarter
EPAM expects the following for the first quarter:
The Company expects revenues will be in the range of $1.275 billion to $1.290 billion for the first quarter reflecting a year-over-year increase of 10.0% at the midpoint of the range. The Company expects year-over-year revenue growth on an organic constant currency basis to be approximately flat at the midpoint of the range;For the first quarter, EPAM expects GAAP income from operations to be in the range of 6.5% to 7.5% of revenues and non-GAAP income from operations to be in the range of 12.5% to 13.5% of revenues;The Company expects its GAAP effective tax rate to be approximately 19% and its non-GAAP effective tax rate to be approximately 24%; andEPAM expects GAAP diluted EPS will be in the range of $1.27 to $1.37 for the quarter, and non-GAAP diluted EPS will be in the range of $2.22 to $2.32 for the quarter. The Company expects weighted average diluted shares outstanding for the quarter of 57.7 million.
Conference Call Information
EPAM will host a conference call to discuss results on Thursday, February 20, 2025 at 8:00 a.m. EST. The conference call will be available live on the EPAM website at https://investors.epam.com. Please visit the website at least 15 minutes prior to the call to register for the event. For those who cannot access the live webcast, a replay will be available in the Investor Relations section of the website.
About EPAM Systems
Since 1993, EPAM Systems, Inc. (NYSE: EPAM) has used its software engineering expertise to become a leading global provider of digital engineering, cloud and AI-enabled transformation services, and a leading business and experience consulting partner for global enterprises and ambitious startups. We address our clients’ transformation challenges by focusing EPAM Continuum’s integrated strategy, experience and technology consulting with our 30+ years of engineering execution to speed our clients’ time to market and drive greater value from their innovations and digital investments.
We leverage AI and GenAI to deliver transformative solutions that accelerate our clients’ digital innovation and enhance their competitive edge. Through platforms like EPAM AI/RUN™ and initiatives like DIALX Lab, we integrate advanced AI technologies into tailored business strategies, driving significant industry impact and fostering continuous innovation.
We deliver globally but engage locally with our expert teams of consultants, architects, designers and engineers, making the future real for our clients, our partners, and our people around the world. We believe the right solutions are the ones that improve people’s lives and fuel competitive advantage for our clients across diverse industries. Our thinking comes to life in the experiences, products and platforms we design and bring to market.
Added to the S&P 500 and the Forbes Global 2000 in 2021 and recognized by Glassdoor and Newsweek as Most Loved Workplace, our multidisciplinary teams serve customers across six continents. We are proud to be among the top 15 companies in Information Technology Services in the Fortune 1000 and to be recognized as a leader in the IDC MarketScapes for Worldwide Experience Build Services, Worldwide Experience Design Services and Worldwide Software Engineering Services.
Learn more at www.epam.com follow us on LinkedIn.
Non-GAAP Financial Measures
EPAM supplements results reported in accordance with United States generally accepted accounting principles, referred to as GAAP, with non-GAAP financial measures. Management believes these measures help illustrate underlying trends in EPAM’s business and uses the measures to establish budgets and operational goals, communicate internally and externally, for managing EPAM’s business and evaluating its performance. Management also believes these measures help investors compare EPAM’s operating performance with its results in prior periods. EPAM anticipates that it will continue to report both GAAP and certain non-GAAP financial measures in its financial results, including non-GAAP results that exclude stock-based compensation expenses, acquisition-related costs including amortization of acquired intangible assets, impairment of assets, expenses associated with EPAM’s humanitarian commitment to its professionals in Ukraine, unbilled business continuity resources resulting from Russia’s invasion of Ukraine, costs associated with the geographic repositioning of EPAM employees based outside of Ukraine impacted by the war and geopolitical instability in the region, employee separation costs incurred in connection with restructuring programs including the Company’s exit from Russia, certain other one-time charges and benefits, changes in fair value of contingent consideration, foreign exchange gains and losses, excess tax benefits related to stock-based compensation, and the related effect on income taxes of the pre-tax adjustments. Management also compares revenues on an “organic constant currency basis,” which is a non-GAAP financial measure. This measure excludes the effect of acquisitions by removing revenues from an acquired company in the twelve months after completing an acquisition, the decision to exit from Russia by removing revenues from clients located in Russia in both the current period and prior period of comparison, and foreign currency exchange rate fluctuations by translating current period revenues into U.S. dollars at the weighted average exchange rates of the prior period of comparison. Because EPAM’s reported non-GAAP financial measures are not calculated in accordance with GAAP, these measures are not comparable to GAAP and may not be comparable to similarly described non-GAAP measures reported by other companies within EPAM’s industry. Consequently, EPAM’s non-GAAP financial measures should not be evaluated in isolation or supplant comparable GAAP measures, but rather, should be considered together with the information in EPAM’s consolidated financial statements, which are prepared in accordance with GAAP.
Forward-Looking Statements
This press release includes estimates and statements which may constitute forward-looking statements made pursuant to the safe harbor provisions of the Private Securities Litigation Reform Act of 1995, the accuracy of which are necessarily subject to risks, uncertainties, and assumptions as to future events that may not prove to be accurate. Our estimates and forward-looking statements are mainly based on our current expectations and estimates of future events and trends, which affect or may affect our business and operations. These statements may include words such as “may,” “will,” “should,” “believe,” “expect,” “anticipate,” “intend,” “plan,” “estimate” or similar expressions. Those future events and trends may relate to, among other things, developments relating to the war in Ukraine and escalation of the war in the surrounding region, political and civil unrest or military action in the geographies where we conduct business and operate, difficult conditions in global capital markets, foreign exchange markets and the broader economy, and the effect that these events may have on customer demand and our revenues, operations, access to capital, and profitability. Other factors that could cause actual results to differ materially from those expressed or implied include general economic conditions, the risk factors discussed in the Company’s most recent Annual Report on Form 10-K and the factors discussed in the Company’s Quarterly Reports on Form 10-Q, particularly under the headings “Management’s Discussion and Analysis of Financial Condition and Results of Operations” and “Risk Factors” and other filings with the Securities and Exchange Commission. Although we believe that these estimates and forward-looking statements are based upon reasonable assumptions, they are subject to several risks and uncertainties and are made based on information currently available to us. EPAM undertakes no obligation to update or revise any forward-looking statements, whether as a result of new information, future events, or otherwise, except as may be required under applicable securities law.
EPAM SYSTEMS, INC. AND SUBSIDIARIES
CONSOLIDATED STATEMENTS OF INCOME
(Unaudited)
(In thousands, except per share data)
Three Months Ended
December 31,
Year Ended December 31,
2024
2023
2024
2023
Revenues
$ 1,248,351
$ 1,157,257
$ 4,727,940
$ 4,690,540
Operating expenses:
Cost of revenues (exclusive of depreciation and amortization)
868,314
797,633
3,277,497
3,256,514
Selling, general and administrative expenses
216,969
213,972
816,300
815,065
Depreciation and amortization expense
26,556
23,158
89,559
91,800
Loss on sale of business
—
—
—
25,922
Income from operations
136,512
122,494
544,584
501,239
Interest and other income, net
6,451
13,962
46,876
51,124
Foreign exchange loss
(5,632)
(9,053)
(7,048)
(15,778)
Income before provision for income taxes
137,331
127,403
584,412
536,585
Provision for income taxes
34,032
29,849
129,879
119,502
Net income
$ 103,299
$ 97,554
$ 454,533
$ 417,083
Net income per share:
Basic
$ 1.82
$ 1.69
$ 7.93
$ 7.21
Diluted
$ 1.80
$ 1.66
$ 7.84
$ 7.06
Shares used in calculation of net income per share:
Basic
56,818
57,767
57,288
57,829
Diluted
57,435
58,913
57,983
59,085
EPAM SYSTEMS, INC. AND SUBSIDIARIES
CONSOLIDATED BALANCE SHEETS
(Unaudited)
(In thousands, except par value)
As of
December 31,
2024
As of
December 31,
2023
Assets
Current assets
Cash and cash equivalents
$ 1,286,267
$ 2,036,235
Trade receivables and contract assets, net of allowance of $5,612 and $11,864, respectively
1,002,175
897,032
Short-term investments
1,690
60,739
Prepaid and other current assets
136,116
97,355
Total current assets
2,426,248
3,091,361
Property and equipment, net
207,667
235,053
Operating lease right-of-use assets, net
128,244
134,898
Intangible assets, net
436,418
71,118
Goodwill
1,181,575
562,459
Deferred tax assets
269,799
197,901
Other noncurrent assets
100,522
59,575
Total assets
$ 4,750,473
$ 4,352,365
Liabilities
Current liabilities
Accounts payable
$ 44,702
$ 31,992
Accrued compensation and benefits expenses
484,952
412,747
Accrued expenses and other current liabilities
201,356
124,823
Income taxes payable, current
50,395
38,812
Operating lease liabilities, current
39,634
36,558
Total current liabilities
821,039
644,932
Long-term debt
25,194
26,126
Operating lease liabilities, noncurrent
98,426
109,261
Deferred tax liabilities, noncurrent
92,362
8,744
Other noncurrent liabilities
82,301
91,832
Total liabilities
1,119,322
880,895
Commitments and contingencies
Equity
Stockholders’ equity
Common stock, $0.001 par value; 160,000 authorized; 56,869 shares issued and outstanding at December 31, 2024, and 57,787 shares issued and outstanding at December 31, 2023
57
58
Additional paid-in capital
1,190,222
1,008,766
Retained earnings
2,555,796
2,501,107
Accumulated other comprehensive loss
(116,864)
(39,040)
Total EPAM Systems, Inc. stockholders’ equity
3,629,211
3,470,891
Noncontrolling interest in consolidated subsidiaries
1,940
579
Total equity
3,631,151
3,471,470
Total liabilities and equity
$ 4,750,473
$ 4,352,365
EPAM SYSTEMS, INC. AND SUBSIDIARIES
Reconciliations of Non-GAAP Financial Measures to Comparable GAAP Financial Measures
(Unaudited)
(In thousands, except percent and per share amounts)
Reconciliation of revenue growth as reported on a GAAP basis to revenue growth/(decline) on an organic constant currency basis is presented in the table below:
Three Months Ended
December 31, 2024
Year Ended
December 31, 2024
Revenue growth as reported
7.9 %
0.8 %
Foreign exchange rates impact
0.4 %
(0.1) %
Inorganic revenue growth
(7.3) %
(2.7) %
Impact of exit from Russia
— %
0.3 %
Revenue growth/(decline) on an organic constant currency basis
1.0 %
(1.7) %
Reconciliation of various income statement amounts from GAAP to non-GAAP for the three months and years ended December 31, 2024 and 2023:
Three Months Ended December 31, 2024
Year Ended December 31, 2024
GAAP
Adjustments
Non-GAAP
GAAP
Adjustments
Non-GAAP
Cost of revenues (exclusive of depreciation and amortization)(1)
$ 868,314
$ (22,040)
$ 846,274
$ 3,277,497
$ (59,821)
$ 3,217,676
Selling, general and administrative expenses(2)
$ 216,969
$ (37,637)
$ 179,332
$ 816,300
$ (145,329)
$ 670,971
Income from operations(3)
$ 136,512
$ 71,675
$ 208,187
$ 544,584
$ 234,625
$ 779,209
Operating margin
10.9 %
5.8 %
16.7 %
11.5 %
5.0 %
16.5 %
Net income(4)
$ 103,299
$ 60,066
$ 163,365
$ 454,533
$ 175,430
$ 629,963
Diluted earnings per share
$ 1.80
$ 2.84
$ 7.84
$ 10.86
Three Months Ended December 31, 2023
Year Ended December 31, 2023
GAAP
Adjustments
Non-GAAP
GAAP
Adjustments
Non-GAAP
Cost of revenues (exclusive of depreciation and amortization)(1)
$ 797,633
$ (22,183)
$ 775,450
$ 3,256,514
$ (89,464)
$ 3,167,050
Selling, general and administrative expenses(2)
$ 213,972
$ (49,747)
$ 164,225
$ 815,065
$ (125,768)
$ 689,297
Income from operations(3)
$ 122,494
$ 77,939
$ 200,433
$ 501,239
$ 263,871
$ 765,110
Operating margin
10.6 %
6.7 %
17.3 %
10.7 %
5.6 %
16.3 %
Net income(4)
$ 97,554
$ 64,211
$ 161,765
$ 417,083
$ 208,555
$ 625,638
Diluted earnings per share
$ 1.66
$ 2.75
$ 7.06
$ 10.59
Items (1) through (4) above are detailed in the following table with the specific cross-reference noted in the appropriate item.
Three Months Ended
December 31,
Year Ended
December 31,
2024
2023
2024
2023
Stock-based compensation expenses
$ 22,074
$ 19,228
$ 80,944
$ 68,797
Poland R&D incentives(a)
(556)
—
(23,473)
—
Humanitarian support in Ukraine(b)
522
2,955
2,350
11,252
Unbilled business continuity resources(c)
—
—
—
9,415
Total adjustments to GAAP cost of revenues(1)
22,040
22,183
59,821
89,464
Stock-based compensation expenses
22,624
18,966
86,353
78,933
Cost Optimization charges(d)
4,837
27,936
31,270
35,052
Other acquisition-related expenses
7,031
275
15,808
2,723
Humanitarian support in Ukraine(b)
3,127
836
10,821
6,145
Geographic repositioning(e)
(4)
916
849
1,793
One-time charges
22
818
228
1,122
Total adjustments to GAAP selling, general and administrative expenses(2)
37,637
49,747
145,329
125,768
Amortization of purchased intangible assets
11,998
6,009
29,475
22,717
Loss on sale of business(f)
—
—
—
25,922
Total adjustments to GAAP income from operations(3)
71,675
77,939
234,625
263,871
Foreign exchange loss
5,632
9,053
7,048
15,778
Change in fair value of contingent consideration included in Interest and other income, net
1,673
1,000
5,700
2,818
One-time benefits/(charges) included in Interest and other income, net
(1,331)
700
(3,143)
700
Provision for income taxes:
Tax effect on non-GAAP adjustments
(15,640)
(19,755)
(44,522)
(53,815)
Excess tax benefits related to stock-based compensation
(1,943)
(4,726)
(22,448)
(19,829)
Net discrete benefit from tax planning(g)
—
—
(1,830)
(968)
Total adjustments to GAAP net income(4)
$ 60,066
$ 64,211
$ 175,430
$ 208,555
(a)
We have excluded from non-GAAP results the portion of the benefit from Poland R&D incentives related to qualifying activities performed in 2023 as it represents a nonrecurring one-time benefit.
(b)
Humanitarian support in Ukraine includes expenses related to EPAM’s $100 million humanitarian commitment in response to Russia’s invasion of Ukraine to support EPAM professionals and their families in and displaced from Ukraine. These expenses are incremental to those expenses incurred prior to the crisis, clearly separable from normal operations, and not expected to recur once the crisis has subsided and operations return to normal.
(c)
Given the uncertainty in the region introduced by Russia’s invasion of Ukraine, EPAM has assigned delivery professionals in locations outside of the region to ensure the continuity of delivery for customers who have substantial delivery exposure to Ukraine or other delivery concerns resulting from the invasion. These employees are not billed to clients and operate largely in a standby or backup capacity. These expenses are incremental to those expenses incurred prior to the crisis, clearly separable from normal operations, and not expected to recur once the crisis has subsided and operations return to normal.
(d)
Cost Optimization charges include severance, facilities and contract termination charges incurred in connection with the programs initiated in the third quarter of 2023 and second quarter of 2024. Consistent with the Company’s historical non-GAAP policy, costs incurred in connection with formal restructuring initiatives have been excluded from non-GAAP results as these are one-time and unusual in nature.
(e)
Geographic repositioning includes expenses associated with the relocation to other countries of employees based outside of Ukraine impacted by the war and geopolitical instability in the region, and includes the cost of accommodations, travel and food. These expenses are incremental to those expenses incurred prior to the crisis, clearly separable from normal operations, and not expected to recur once the crisis has subsided and operations return to normal.
(f)
On July 26, 2023, the Company completed the sale of its remaining operations in Russia and recorded a loss on sale of approximately $25.9 million during the year ended December 31, 2023, including the recognition of the accumulated currency translation loss related to this foreign entity that was previously included in Accumulated other comprehensive loss in the financial statements. The Company excluded this loss from non-GAAP results as it is one-time and unusual in nature.
(g)
One-time benefit related to the implementation of tax planning to disregard certain foreign subsidiaries as separate entities for U.S. income tax purposes. Consistent with the Company’s historical non-GAAP policy, the benefit related to the implementation of tax planning has been excluded from non-GAAP results as it is one-time and unusual in nature.
EPAM SYSTEMS, INC. AND SUBSIDIARIES
Reconciliations of Guidance Non-GAAP Financial Measures to Comparable GAAP Financial Measures
(Unaudited)
The below guidance constitutes forward-looking statements within the meaning of the federal securities laws and is based on a number of assumptions that are subject to change and many of which are outside the control of the Company. Actual results may differ materially from the Company’s expectations depending on factors discussed in the Company’s filings with the Securities and Exchange Commission.
Reconciliation of expected revenue growth on a GAAP basis to expected revenue growth on an organic constant currency basis is presented in the table below:
First Quarter 2025
Full Year 2025
(at midpoint of
range)
Revenue growth
10.0 %
10.0% to 14.0%
Foreign exchange rates impact
1.4 %
0.9 %
Inorganic revenue growth
(11.4) %
(9.9) %
Revenue growth on an organic constant currency basis
— %
1.0% to 5.0%
Reconciliation of expected GAAP to non-GAAP income from operations as a percentage of revenues is presented in the table below:
First Quarter 2025
Full Year 2025
GAAP income from operations as a percentage of revenues
6.5% to 7.5%
9.0% to 10.0%
Stock-based compensation expenses
3.9 %
3.7 %
Included in cost of revenues (exclusive of depreciation and amortization)
1.9 %
1.8 %
Included in selling, general and administrative expenses
2.0 %
1.9 %
Humanitarian support in Ukraine(b)
0.2 %
0.3 %
Cost Optimization charges(d)
0.5 %
0.2 %
Amortization of acquired intangible assets
1.4 %
1.3 %
Non-GAAP income from operations as a percentage of revenues(h)
12.5% to 13.5%
14.5% to 15.5%
(h) EPAM has not included the impact of potential future One-time charges including asset impairments, unusual gains and losses, expenses incurred in connection with future cost optimization actions, and Other acquisition-related expenses because the Company is unable to predict these amounts with reasonable certainty.
Reconciliation of expected GAAP to non-GAAP effective tax rate is presented in the table below:
First Quarter 2025
Full Year 2025
GAAP effective tax rate (approximately)
19 %
24 %
Excess tax benefits related to stock-based compensation
7.5 %
2.6 %
Tax effect on non-GAAP adjustments
(2.5) %
(2.6) %
Non-GAAP effective tax rate (approximately)
24 %
24 %
Reconciliation of expected GAAP to non-GAAP diluted earnings per share is presented in the table below:
First Quarter 2025
Full Year 2025
GAAP diluted earnings per share
$1.27 to $1.37
$6.78 to $7.08
Stock-based compensation expenses
0.87
3.33
Included in cost of revenues (exclusive of depreciation and amortization)
0.42
1.61
Included in selling, general and administrative expenses
0.45
1.72
Humanitarian support in Ukraine(b)
0.07
0.25
Cost Optimization charges(d)
0.10
0.12
Amortization of acquired intangible assets
0.31
1.17
Foreign exchange loss
0.02
0.07
Provision for income taxes:
Tax effect on non-GAAP adjustments
(0.29)
(1.04)
Excess tax benefits related to stock-based compensation
(0.13)
(0.23)
Non-GAAP diluted earnings per share(h)
$2.22 to $2.32
$10.45 to $10.75
View original content to download multimedia:https://www.prnewswire.com/news-releases/epam-reports-results-for-fourth-quarter-and-full-year-2024-302381106.html
SOURCE EPAM Systems, Inc.

You may like
Technology
Escalade Announces Second Quarter 2026 Results Conference Call Date
Published
55 minutes agoon
July 23, 2026By
EVANSVILLE, Ind., July 23, 2026 /PRNewswire/ — Escalade, Inc. (NASDAQ: ESCA, or the “Company”), a leading manufacturer and distributor of sporting goods and indoor/outdoor recreational equipment, today announced that it will issue its second quarter 2026 results before the market opens on Thursday, July 30, 2026. A conference call will be held that day at 11:00 a.m. ET to review the Company’s financial results and conduct a question-and-answer session.
A webcast of the conference call will be available in the Investor Relations section of Escalade’s website at www.escaladeinc.com. To listen to a live broadcast, go to the site at least 15 minutes prior to the scheduled start time in order to register, download, and install any necessary audio software.
To participate in the live teleconference:
Domestic Live:
833-890-3250
International Live:
412-206-6441
To listen to a replay of the teleconference, which subsequently will be available through August 13, 2026:
Domestic Replay:
844-512-2921
International Replay:
412-317-6671
Conference ID:
10209663
ABOUT ESCALADE
Founded in 1922, and headquartered in Evansville, Indiana, Escalade designs, manufactures, and sells sporting goods, safety, fitness, and indoor/outdoor recreation equipment. Our mission is to connect family and friends, create lasting memories, and play life to the fullest. Leaders in our respective categories, Escalade’s distinct and acclaimed brands include Goalrilla™ in-ground basketball hoops; STIGA® tennis tables and accessories; Bear® Archery and archery equipment; Brunswick Billiards® tables and accessories; Accudart® darting; ONIX® pickleball; Lifeline® fitness products; and RAVE Sports® water recreation products. Escalade’s products are available online and through leading retailers nationwide. For more information about Escalade’s diverse and prominent brand portfolio, history, financials, and governance, please visit www.escaladeinc.com.
INVESTOR RELATIONS CONTACT
Wesley Smith
Vice President, Financial Reporting & Investor Relations
812-467-1334
View original content to download multimedia:https://www.prnewswire.com/news-releases/escalade-announces-second-quarter-2026-results-conference-call-date-302833660.html
SOURCE Escalade, Incorporated
Technology
Analog Devices to Report Third Quarter Fiscal Year 2026 Financial Results on Wednesday, August 19, 2026
Published
55 minutes agoon
July 23, 2026By
WILMINGTON, Mass., July 23, 2026 /PRNewswire/ — Analog Devices, Inc. (Nasdaq: ADI) today announced it will release financial results for the third quarter fiscal year 2026 at 7:00 a.m. Eastern time on Wednesday, August 19, 2026. Following the press release, the Company will host a conference call at 10:00 a.m. Eastern time, the same day. Vincent Roche, Chief Executive Officer and Chair, Richard Puccio, Executive Vice President and Chief Financial Officer, and Jeff Ambrosi, Head of Investor Relations, Senior Director, will discuss ADI’s results and business outlook.
The press release, live conference call and subsequent archived copies can be accessed on Analog Devices’ Investor Relations website at investor.analog.com. To participate in the live conference call, please pre-register at: register-conf.media.server.com. Upon registering, you will be emailed a dial-in number and unique PIN.
About Analog Devices, Inc.
Analog Devices, Inc. (NASDAQ: ADI) is a global semiconductor leader that bridges the physical and digital worlds to enable breakthroughs at the Intelligent Edge. ADI combines analog, digital, AI, and software technologies into solutions that combat climate change, reliably connect humans and the world, and help drive advancements in automation and robotics, mobility, healthcare, energy and data centers. With revenue of more than $11 billion in FY25, ADI ensures today’s innovators stay Ahead of What’s Possible. Learn more at www.analog.com and on LinkedIn and X.
Jeff Ambrosi
Head of Investor Relations, Senior Director
Analog Devices, Inc.
781-461-3282
invesor.relations@analog.com
View original content to download multimedia:https://www.prnewswire.com/news-releases/analog-devices-to-report-third-quarter-fiscal-year-2026-financial-results-on-wednesday-august-19-2026-302832572.html
SOURCE Analog Devices, Inc.
Technology
Scholastic Reports Fourth Quarter and Fiscal 2026 Results
Published
55 minutes agoon
July 23, 2026By
Fiscal 2026 Operating Income of $15.2 Million; Adjusted EBITDA of $151.5 Million, Up 4%, in Line With Guidance
Returned Over $285 Million to Shareholders During Fiscal Year
Fiscal 2027 Outlook Targets Return to Revenue Growth and Higher Adjusted EBITDA on Comparable Basis
NEW YORK, July 23, 2026 /PRNewswire/ — Scholastic Corporation (NASDAQ: SCHL), the global children’s publishing, education and media company, today reported financial results for the Company’s fiscal fourth quarter and full year ended May 31, 2026.
Peter Warwick, President and Chief Executive Officer, said, “Fiscal 2026 demonstrated the earnings power of a more focused Scholastic, as the Company made substantial progress in a multi-year transformation of its governance, organization, strategy and balance sheet. Adjusted EBITDA rose, in line with guidance, positioning the Company for growth in fiscal 2027.”
Fiscal 2026 revenue decreased 3%, and operating income was $15.2 million, compared with $15.8 million in fiscal 2025. Adjusted operating income, excluding one-time items, increased to $47.1 million from $35.8 million in the prior year period. Adjusted EBITDA was $151.5 million, up 4%, and increased 15% on a comparable basis, reflecting the full-year impact of additional lease expense and the loss of rental income from the sale-leaseback transactions in both periods. In the fourth quarter, Adjusted EBITDA increased $1.0 million on that same comparable basis, driven by continued strong execution in Book Fairs, Entertainment’s return to growth and disciplined cost management across the Company, even as revenue was affected by expected comparisons against an exceptional prior-year quarter in Trade and continued funding volatility in Education.
Mr. Warwick continued, “Today, our company is more clearly organized around the advantages that make Scholastic distinctive: a trusted brand, beloved IP, proprietary school-based channels and deep relationships with educators and families built over more than a century. Scholastic remains uniquely positioned to connect books, schools, homes and screens in ways that deepen kids’ engagement with stories and bring more children back to reading at a scale and depth that others cannot easily replicate.
“During the fourth quarter, we continued to see the impact of this strategy across the business. Book Fairs deepened our reach with schools and families, Trade Publishing remained anchored by enduring children’s franchises, and Entertainment expanded discovery and engagement with Scholastic IP across platforms. In Education, while funding volatility and a challenging supplemental curriculum market continued to pressure results, we made progress repositioning the business around a more focused strategy, improved execution and lower cost structure, with trends improving throughout the year.
“Fiscal 2026 was also an important year of capital deployment and shareholder value creation. Following the sale-leaseback transactions, we returned significant capital to shareholders through share repurchases, a modified Dutch auction tender offer and dividends, and established a long-term leverage framework that supports both disciplined investment and continued capital returns. Together, these actions completed major elements of our financial transformation and provide Scholastic with greater financial flexibility to enhance shareholder returns.
“As we enter fiscal 2027, Scholastic is strongly positioned to translate its durable advantages into profitable, sustained growth. Our outlook reflects expected revenue growth and higher Adjusted EBITDA on a comparable basis, reflecting the full-year impact of the sale-leaseback transactions in both periods. We remain focused on continued execution of our plan, disciplined cost management and targeted investment in the areas where Scholastic has the greatest opportunity to drive long-term growth, deepen our impact with children, families and educators, and create sustained value for shareholders.”
Outlook
In fiscal 2027, the Company expects revenue growth of approximately 2% to 4% and Adjusted EBITDA of approximately $135 million to $145 million. The Adjusted EBITDA range represents growth compared with fiscal 2026 Adjusted EBITDA on a comparable basis, reflecting the full-year impact of the sale-leaseback transactions in both periods.
This outlook reflects expected growth in Children’s Books, Entertainment and International, improved performance in Education, disciplined cost management and targeted investment in long-term growth opportunities.
The Company also expects Free Cash Flow (a non-GAAP financial measure, explained in the accompanying tables) of approximately $35 million to $40 million.
Fiscal 2026 Q4 Review
In $ millions (except per share data)
Fourth Quarter
Change
Fiscal 2026
Fiscal 2025
$
%
Revenues
$
476.1
$
508.3
$
(32.2)
(6) %
Operating income (loss)
$
51.4
$
53.5
$
(2.1)
(4) %
Earnings (loss) before taxes
$
14.5
$
48.9
$
(34.4)
(70) %
Diluted earnings (loss) per share
$
0.45
$
0.59
$
(0.14)
(24) %
Operating income (loss), ex. one-time items* (1)
$
58.3
$
63.4
$
(5.1)
(8) %
Diluted earnings (loss) per share, ex. one-time items*
$
2.19
$
0.87
$
1.32
152 %
Adjusted EBITDA* (1)
$
84.7
$
91.2
$
(6.5)
(7) %
Pro forma Adjusted operating income* (2)
$
58.3
$
59.5
$
(1.2)
(2) %
Pro forma Adjusted EBITDA* (2)
$
84.7
$
83.7
$
1.0
1 %
* Please refer to the non-GAAP financial tables attached
(1)
Fiscal 2026 fourth-quarter Operating income excluding one-time items and Adjusted EBITDA include
net costs of $4.2 and $7.8, respectively, related to the sale-leaseback transactions completed in
December 2025.
(2)
Pro forma Adjusted operating income and Pro forma Adjusted EBITDA reflect the full-period impact of
the sale-leaseback transactions in each period presented. The Company refers to these measures in
this release as results “on a comparable basis.” See Table 7 for the reconciliation to Adjusted operating
income and Adjusted EBITDA.
Revenues decreased 6% to $476.1 million, as continued growth in Book Fairs and higher Entertainment revenues were more than offset by lower Trade and International revenues due to more challenging comparisons with the prior-year publishing schedule and lower revenues in Education.
Operating Income decreased 4% to $51.4 million in the quarter compared to $53.5 million a year ago, including $6.9 million and $9.9 million in one-time charges in each period, respectively. Excluding one-time charges in both periods, adjusted operating income decreased $5.1 million to $58.3 million. On a comparable basis, reflecting the full-period impact of the sale-leaseback in both periods, adjusted operating income decreased $1.2 million from $59.5 million. Adjusted EBITDA (a non-GAAP measure of operations explained in the accompanying tables) was $84.7 million, compared to $91.2 million in the prior-year period. On the same comparable basis, Adjusted EBITDA increased $1.0 million from $83.7 million in the prior year period, primarily reflecting improved profitability in Children’s Book Publishing and Distribution and Entertainment, partly offset by lower results in Education and International.
Quarterly Results
Children’s Book Publishing and Distribution
In the fiscal fourth quarter, the Children’s Book Publishing and Distribution segment’s revenues decreased 4% to $276.3 million.
In School Reading Events, Book Fairs revenues were $186.6 million, up 5% from the prior year period, reflecting higher fair count. Book Clubs revenues were $12.2 million, a decline of 7% from the prior year period, primarily reflecting lower participation throughout the year.
Consolidated Trade revenues decreased 20% from the prior year period to $77.5 million, reflecting a challenging comparison with the prior-year publishing schedule, which included the release of Sunrise on the Reaping, the fifth book in Suzanne Collins’ global bestselling The Hunger Games® series.
Segment operating income was $60.3 million, compared to $57.6 million a year ago, which included one-time charges of $0.6 million. Excluding one-time charges, adjusted operating income increased $2.1 million, primarily driven by higher revenues and improved profitability in Book Fairs, partly offset by lower Trade results.
Education
Education revenues decreased 13% to $109.2 million, primarily reflecting continued pressure on school and district spending for supplemental curriculum materials. Segment operating income was $27.0 million, which included one-time charges of $0.9 million, compared to $30.7 million in the prior year period, which included one-time charges of $0.6 million. Excluding one-time charges, adjusted operating income decreased by $3.4 million, as a result of lower revenues, partly offset by benefits from the segment’s improved cost structure. While fourth-quarter revenues remained below the prior year, the rate of decline improved in the second half of fiscal 2026 compared to the first half of the year, as the segment advanced its product, marketing and sales strategies following its repositioning.
Entertainment
Segment revenues increased 42% to $21.0 million, reflecting higher production services revenues. Segment operating income was $0.4 million, which included one-time charges of $0.4 million, compared to an operating loss of $3.0 million in the prior year period, which included one-time charges of $0.9 million. Excluding one-time charges, adjusted segment operating income improved $2.9 million to $0.8 million, primarily reflecting higher revenues.
International
International revenues decreased 13% to $69.6 million, excluding favorable foreign currency exchange of $3.1 million, primarily reflecting lower Trade revenues against a more challenging comparison with the prior-year publishing schedule. Segment operating income was $2.9 million, which included one-time charges of $0.2 million, compared to $3.7 million in the prior year period, which included one-time charges of $2.4 million. Excluding one-time charges, adjusted operating income decreased by $3.0 million to $3.1 million primarily reflecting lower revenues, partly offset by cost management.
Overhead
Overhead costs were $39.2 million, which included one-time charges of $5.4 million, compared to $35.5 million in the prior year period, which included one-time charges of $5.4 million. Excluding one-time charges, adjusted overhead costs increased $3.7 million to $33.8 million. On a comparable basis, reflecting the pro forma impact of the sale-leaseback transactions in both periods, adjusted overhead costs were approximately in line with the prior-year period.
Fiscal 2026 Full Year Review
In $ millions (except per share data)
Full Year
Change
Fiscal 2026
Fiscal 2025
$
%
Revenues
$
1,581.9
$
1,625.5
$
(43.6)
(3) %
Operating income (loss)
$
15.2
$
15.8
$
(0.6)
(4) %
Earnings (loss) before taxes
$
85.2
$
(1.3)
$
86.5
NM
Diluted earnings (loss) per share
$
2.34
$
(0.07)
$
2.41
NM
Operating income (loss), ex. one-time items* (1)
$
47.1
$
35.8
$
11.3
32 %
Diluted earnings (loss) per share, ex. one-time items*
$
1.87
$
0.48
$
1.39
NM
Adjusted EBITDA* (1)
$
151.5
$
145.4
$
6.1
4 %
Pro forma Adjusted operating income* (2)
$
35.3
$
19.9
$
15.4
77 %
Pro forma Adjusted EBITDA* (2)
$
132.4
$
115.3
$
17.1
15 %
* Please refer to the non-GAAP financial tables attached
(1)
Fiscal 2026 full-year Operating income excluding one-time items and Adjusted EBITDA include net costs
of $7.2 and $14.5, respectively, related to the sale-leaseback transactions completed in December 2025.
(2)
Pro forma Adjusted operating income and Pro forma Adjusted EBITDA reflect the full-period impact of
the sale-leaseback transactions in each period presented. The Company refers to these measures in
this release as results “on a comparable basis.” See Table 7 for the reconciliation to Adjusted operating
income and Adjusted EBITDA.
Revenues decreased 3% to $1,581.9 million, primarily reflecting lower revenues in Education and lower Consolidated Trade revenues against a more challenging comparison with the prior-year publishing schedule, partly offset by strong performance in Book Fairs and higher Entertainment revenues.
Operating Income decreased 4% to $15.2 million, compared to $15.8 million a year ago, including $31.9 million and $20.0 million in one-time charges in each period, respectively. Excluding one-time charges in both periods, adjusted operating income increased $11.3 million to $47.1 million. On a comparable basis, reflecting the full-year impact of the sale-leaseback transactions in both periods, adjusted operating income increased $15.4 million to $35.3 million, compared to $19.9 million in the prior year. Adjusted EBITDA increased $6.1 million, or 4%, to $151.5 million, in-line with the Company’s guidance. On the same comparable basis, Adjusted EBITDA increased 15%, or $17.1 million, to $132.4 million from $115.3 million. The improvement on a comparable basis primarily reflected strong performance in Children’s Book Publishing and Distribution and International, as well as lower adjusted overhead costs, which more than offset the impact of lower sales in Education.
Capital Position and Liquidity
In $ millions
Full Year
Change
Fiscal 2026
Fiscal 2025
$
%
Net cash provided by operating activities
$
50.9
$
124.2
$
(73.3)
(59) %
Net proceeds from sale and lease transactions (1)
452.4
—
452.4
NM
Additions to property, plant and equipment and
prepublication expenditures
(66.3)
(76.7)
10.4
14 %
Net borrowings (repayments) of film related obligations
(1.0)
(18.3)
17.3
95 %
Free cash flow (use)*
$
436.0
$
29.2
$
406.8
NM
Net cash (debt)*
$
48.9
$
(136.6)
$
185.5
136 %
NM – Not Meaningful
* Please refer to the non-GAAP financial tables attached
(1) Excludes tax impact from sale-leaseback transactions.
Net cash provided by operating activities was $50.9 million, compared to $124.2 million in the prior year period, primarily reflecting higher tax payments associated with the sale-leaseback transactions, as well as higher severance-related payments as part of cost savings initiatives. Free cash flow was $436.0 million in fiscal 2026, compared to $29.2 million in the prior year period, primarily reflecting over $400 million in net proceeds from the Company’s sale-leaseback transactions.
The Company ended fiscal 2026 with net cash of $48.9 million compared to a net debt position of $136.6 million at the end of fiscal 2025, primarily reflecting the net proceeds from the sale-leaseback transactions, partly offset by significant capital returns to shareholders.
In fiscal 2026, the Company returned approximately $288.6 million to shareholders through share repurchases and dividends. This included the repurchase of 7,336,966 shares of common stock for $268.6 million, including shares purchased through the Company’s modified Dutch auction tender offer and open-market repurchases, and $20.0 million of dividends, including $4.6 million in the fourth quarter.
At May 31, 2026, $183.0 million remained authorized for future repurchases under the Company’s stock repurchase program. The Company expects to continue purchasing shares, from time to time as conditions allow, on the open market or in negotiated private transactions.
Additional Information
To supplement our financial statements presented in accordance with GAAP, we include certain non-GAAP calculations and presentations including, as noted above, “Adjusted EBITDA, “Adjusted Operating Income”, and “Free Cash Flow”. Please refer to the non-GAAP financial tables attached to this press release for supporting details on the impact of one-time items on operating income, net income and diluted EPS, and the use of non-GAAP financial measures included in this release. This information should be considered as supplemental in nature and not as a substitute for the related financial information prepared in accordance with GAAP.
Conference Call
The Company will hold a conference call to discuss its results at 4:30 p.m. ET today, July 23, 2026. Peter Warwick, Scholastic President and Chief Executive Officer, and Haji Glover, the Company’s Chief Financial Officer, Executive Vice President, will moderate the call.
A live webcast of the call can be accessed at https://edge.media-server.com/mmc/p/n2mcunuo. To access the conference call by phone, please go to https://register-conf.media-server.com/register/BIe4453c04814b4def819b83eaf92a8731, which will provide dial-in details. To avoid delays, participants are encouraged to dial into the conference call five minutes ahead of the scheduled start time. Shortly following the call, an archived webcast and accompanying slides from the conference call will be posted at investor.scholastic.com.
About Scholastic
For more than 100 years, Scholastic Corporation (NASDAQ: SCHL) has been meeting children where they are – at school, at home and in their communities – by creating quality content and experiences, all beginning with literacy. Scholastic delivers stories, characters, and learning moments that empower all kids to become lifelong readers and learners through bestselling children’s books, literacy- and knowledge-building resources for schools including classroom magazines, and award-winning, entertaining children’s media. As the world’s largest publisher and distributor of children’s books through school-based book clubs and book fairs, classroom libraries, school and public libraries, retail, and online, and with a global reach into more than 135 countries, Scholastic encourages the personal and intellectual growth of all children, while nurturing a lifelong relationship with reading, themselves, and the world around them. Learn more at www.scholastic.com.
Forward-Looking Statements
This news release contains certain forward-looking statements relating to future periods. Such forward-looking statements are subject to various risks and uncertainties, including the conditions of the children’s book and educational materials markets generally and acceptance of the Company’s products within those markets, and other risks and factors identified from time to time in the Company’s filings with the Securities and Exchange Commission. Actual results could differ materially from those currently anticipated.
SCHL: Financial
Table 1
Scholastic Corporation
Consolidated Statements of Operations
(Unaudited)
(In $ Millions, except shares and per share data)
Three months ended
Twelve months ended
05/31/26
05/31/25
05/31/26
05/31/25
Revenues
$
476.1
$
508.3
$
1,581.9
$
1,625.5
Operating costs and expenses:
Cost of goods sold
190.4
207.3
689.8
718.8
Selling, general and administrative expenses
219.7
227.8
807.2
822.3
Depreciation and amortization
13.1
17.2
58.8
65.7
Asset impairments and write downs
1.5
2.5
10.9
2.9
Total operating costs and expenses
424.7
454.8
1,566.7
1,609.7
Operating income (loss)
51.4
53.5
15.2
15.8
Interest income (expense), net
(0.9)
(4.3)
(11.2)
(16.0)
Other components of net periodic benefit (cost)
(0.3)
(0.3)
(1.3)
(1.1)
Loss on sale of investments
(17.2)
—
(17.2)
—
Gain (loss) on sale and leaseback transactions
(18.5)
—
99.7
—
Earnings (loss) before income taxes
14.5
48.9
85.2
(1.3)
Provision (benefit) for income taxes
5.1
33.5
28.5
0.6
Net income (loss)
$
9.4
$
15.4
$
56.7
$
(1.9)
Basic and diluted earnings (loss) per share of Class A and
Common Stock (1)
Basic
$
0.46
$
0.59
$
2.39
$
(0.07)
Diluted
$
0.45
$
0.59
$
2.34
$
(0.07)
Basic weighted average shares outstanding
20,343
26,113
23,698
27,631
Diluted weighted average shares outstanding
20,992
26,209
24,222
27,907
(1)
Earnings (loss) per share are calculated on non-rounded net income (loss) and shares outstanding.
Recalculating earnings per share based on numbers rounded to millions may not yield the results as
presented.
Table 2
Scholastic Corporation
Segment Results, Excluding One-Time Items
(Unaudited)
(In $ Millions)
Three months ended
Change
Twelve months ended
Change
05/31/26
05/31/25
$
%
05/31/26
05/31/25
$
%
Children’s Book Publishing
and Distribution
Revenues
Book Clubs
$
12.2
$
13.1
$
(0.9)
(7) %
$
57.1
$
64.2
$
(7.1)
(11) %
Book Fairs
186.6
177.8
8.8
5 %
576.0
548.3
27.7
5 %
School Reading Events
198.8
190.9
7.9
4 %
633.1
612.5
20.6
3 %
Consolidated Trade
77.5
97.3
(19.8)
(20) %
331.1
351.4
(20.3)
(6) %
Total Revenues
276.3
288.2
(11.9)
(4) %
964.2
963.9
0.3
0 %
Operating income (loss) ex.
one-time items *
60.3
58.2
2.1
4 %
143.7
131.3
12.4
9 %
Adjusted operating margin *
21.8 %
20.2 %
14.9 %
13.6 %
Education
Revenues
109.2
125.7
(16.5)
(13) %
267.6
309.8
(42.2)
(14) %
Operating income (loss) ex.
one-time items *
27.9
31.3
(3.4)
(11) %
0.2
6.9
(6.7)
(97) %
Adjusted operating margin *
25.5 %
24.9 %
0.1 %
2.2 %
Entertainment
Revenues
21.0
14.8
6.2
42 %
65.7
61.0
4.7
8 %
Operating income (loss) ex.
one-time items *
0.8
(2.1)
2.9
138 %
(9.3)
(7.2)
(2.1)
(29) %
Adjusted operating margin *
3.8 %
NM
NM
NM
International
Revenues
69.6
76.8
(7.2)
(9) %
277.2
279.6
(2.4)
(1) %
Operating income (loss) ex.
one-time items *
3.1
6.1
(3.0)
(49) %
7.1
2.9
4.2
145 %
Adjusted operating margin *
4.5 %
7.9 %
2.6 %
1.0 %
Overhead
Revenues
—
2.8
(2.8)
(100) %
7.2
11.2
(4.0)
(36) %
Operating income (loss) ex.
one-time items *
(33.8)
(30.1)
(3.7)
(12) %
(94.6)
(98.1)
3.5
4 %
Operating income (loss) ex.
one-time items *
$
58.3
63.4
(5.1)
(8) %
$
47.1
35.8
11.3
32 %
Adjusted operating margin *
12.2 %
12.5 %
3.0 %
2.2 %
NM – Not meaningful
* Please refer to Table 4 for one-time items and a reconciliation of the non-GAAP financials.
Table 3
Scholastic Corporation
Supplemental Information
(Unaudited)
(In $ Millions)
Selected Balance Sheet Items
05/31/26
05/31/25
Cash and cash equivalents
$
134.9
$
124.0
Accounts receivable, net
236.4
273.4
Inventories, net
265.0
250.2
Accounts payable
144.2
157.3
Deferred revenue
179.2
178.8
Accrued royalties
50.3
69.1
Film related obligations
17.1
18.3
Lines of credit and long-term debt
80.5
256.2
Net cash (debt) (1)
48.9
(136.6)
Total stockholders’ equity
750.8
946.5
Selected Cash Flow Items
Three months ended
Twelve months ended
05/31/26
05/31/25
05/31/26
05/31/25
Net cash provided by (used in) operating activities
$
90.0
$
106.9
$
50.9
$
124.2
Net proceeds from sale and lease transactions (3)
—
—
452.4
—
Property, plant and equipment additions
(15.0)
(12.3)
(48.4)
(52.2)
Prepublication expenditures
(4.9)
(8.7)
(17.9)
(24.5)
Net borrowings (repayments) of film related obligations
(0.1)
0.3
(1.0)
(18.3)
Free cash flow (use) (2)
$
70.0
$
86.2
$
436.0
$
29.2
(1)
Net cash (debt) is defined by the Company as cash and cash equivalents less production cash of $5.5
and $4.4 as of May 31, 2026 and May 31, 2025, respectively, net of lines of credit and short-term and
long-term-debt. Film related obligations are not included. The Company utilizes this non-GAAP financial
measure, and believes it is useful to investors, as an indicator of the Company’s effective leverage and
financing needs.
(2)
Free cash flow (use) is defined by the Company as net cash provided by or used in operating activities
(which includes royalty advances) and cash acquired through acquisitions and from the sale of assets,
reduced by spending on property, plant and equipment and prepublication costs and adjusted for net
cash flows from film related obligations. The Company believes that this non-GAAP financial measure
is useful to investors as an indicator of cash flow available for debt repayment and other investing
activities, such as acquisitions. The Company utilizes free cash flow as a further indicator of operating
performance and for planning investing activities.
(3)
Excludes tax impact from sale-leaseback transactions.
Table 4
Scholastic Corporation
Supplemental Results – Excluding One-Time Items
(Unaudited)
(In $ Millions, except per share data)
Three months ended
05/31/2026
05/31/2025
Reported
One-time
items
Excluding
One-time
items
Reported
One-time
items
Excluding
One-time
items
Diluted earnings (loss) per share (1)
$
0.45
$
1.79
$
2.19
$
0.59
$
0.29
$
0.87
Net income (loss) (2)
$
9.4
$
36.5
$
45.9
$
15.4
$
7.5
$
22.9
Earnings (loss) before income taxes (3)
$
14.5
$
42.6
$
57.1
$
48.9
$
9.9
$
58.8
Children’s Book Publishing and
Distribution (4)
$
60.3
$
—
$
60.3
$
57.6
$
0.6
$
58.2
Education (5)
27.0
0.9
27.9
30.7
0.6
31.3
Entertainment(6)
0.4
0.4
0.8
(3.0)
0.9
(2.1)
International (7)
2.9
0.2
3.1
3.7
2.4
6.1
Overhead (8)
(39.2)
5.4
(33.8)
(35.5)
5.4
(30.1)
Operating income (loss)
$
51.4
$
6.9
$
58.3
$
53.5
$
9.9
$
63.4
Twelve months ended
05/31/2026
05/31/2025
Reported
One-time
items
Excluding
One-time
items
Reported
One-time
items
Excluding
One-time
items
Diluted earnings (loss) per share (1)
$
2.34
$
(0.47)
$
1.87
$
(0.07)
$
0.55
$
0.48
Net income (loss) (2)
$
56.7
$
(11.3)
$
45.4
$
(1.9)
$
15.2
$
13.3
Earnings (loss) before income taxes (3)
$
85.2
$
(50.6)
$
34.6
$
(1.3)
$
20.0
$
18.7
Children’s Book Publishing and
Distribution (4)
$
142.9
$
0.8
$
143.7
$
130.7
$
0.6
$
131.3
Education (5)
(4.1)
4.3
0.2
6.3
0.6
6.9
Entertainment(6)
(16.1)
6.8
(9.3)
(12.1)
4.9
(7.2)
International (7)
6.4
0.7
7.1
(1.0)
3.9
2.9
Overhead (8)
(113.9)
19.3
(94.6)
(108.1)
10.0
(98.1)
Operating income (loss)
$
15.2
$
31.9
$
47.1
$
15.8
$
20.0
$
35.8
(1)
Earnings (loss) per share are calculated on non-rounded net income (loss) and shares outstanding. Recalculating
earnings per share based on rounded numbers may not yield the results as presented.
(2)
In the three and twelve months ended May 31, 2026, the Company recognized a benefit of $6.1 and a provision of
$39.3, respectively, for income taxes in respect to one-time pretax items. In the three and twelve months ended May
31, 2025, the Company recognized a benefit of $2.4 and $4.8, respectively, for income taxes in respect to one-time
pretax items.
(3)
In the three and twelve months ended May 31, 2026, the Company recognized a pretax loss of $17.2 related to the
sale of its 26.2% equity interest in a U.K.-based children’s book publishing business. In the three months ended May
31, 2026, the Company recognized an adjustment of $18.5 million to the pretax gain related to the sale-leaseback
transactions. In the twelve months ended May 31, 2026, the Company recognized a pretax gain of $99.7 related to
sale-leaseback transactions involving its facilities in New York City and Jefferson City, Missouri.
(4)
In the twelve months ended May 31, 2026, the Company recognized a pretax asset impairment charge of $0.8 related
to a certain product. In the three and twelve months ended May 31, 2025, the Company recognized a pretax asset
impairment charge of $0.6 related to a digital product.
(5)
In the three and twelve months ended May 31, 2026, the Company recognized pretax asset impairment charges of
$0.9 and $4.3, respectively, related to certain education and digital products. In the three and twelve months ended May
31, 2025, the Company recognized a pretax asset impairment charge of $0.6 related to certain digital products.
(6)
In the three and twelve months ended May 31, 2026, the Company recognized other pretax expenses of $0.4 and $1.4,
respectively. In the twelve months ended May 31, 2026, the Company recognized pretax severance of $0.2 and a pretax
asset impairment charge of $5.2 primarily related to certain film and television programs in development. In the three
and twelve months ended May 31, 2025, the Company recognized pretax severance of $0.3 and $1.4, respectively,
related to cost-savings initiatives, pretax costs of $0.4 and $3.0, respectively, related to the acquisition of 9 Story Media
Group and pretax asset impairment charges of $0.2 and $0.5, respectively, related to the early exit of certain leased
office space in Canada and Ireland.
(7)
In the three and twelve months ended May 31, 2026, the Company recognized pretax severance of $0.2 and $0.7,
respectively, related to cost-savings initiatives. In the three and twelve months ended May 31, 2025, the Company
recognized pretax severance of $1.3 and $2.8, respectively, related to cost-savings initiatives and a pretax asset
impairment charge of $1.1 related to the reorganization in China.
(8)
In the three and twelve months ended May 31, 2026, the Company recognized pretax severance of $3.7 and $15.5,
respectively, related to cost-savings initiatives, and other pretax expenses of $1.7 and $3.8, respectively. In the three
and twelve months ended May 31, 2025, the Company recognized pretax severance of $3.4 and $7.6, respectively,
related to cost-savings initiatives, other pretax expenses of $1.9 and $2.3, respectively, and an asset impairment
charge of $0.1 related to the early exit of an office lease.
Table 5
Scholastic Corporation
Consolidated Statements of Operations – Supplemental
Adjusted EBITDA
(Unaudited)
(In $ Millions)
Three months ended
05/31/26
05/31/25
Earnings (loss) before income taxes as reported
$
14.5
$
48.9
One-time items before income taxes
42.6
9.9
Earnings (loss) before income taxes excluding one-time items
57.1
58.8
Interest (income) expense (1)
0.9
4.5
Depreciation and amortization
26.7
27.9
Adjusted EBITDA (2)
$
84.7
$
91.2
Twelve months ended
05/31/26
05/31/25
Earnings (loss) before income taxes as reported
$
85.2
$
(1.3)
One-time items before income taxes
(50.6)
20.0
Earnings (loss) before income taxes excluding one-time items
34.6
18.7
Interest (income) expense (1)
11.6
16.4
Depreciation and amortization
105.3
110.3
Adjusted EBITDA (2)
$
151.5
$
145.4
(1)
Amounts include production loan interest amortized into cost of goods sold.
(2)
Adjusted EBITDA is defined by the Company as earnings (loss), excluding one-time items,
before interest, taxes, depreciation and amortization. The Company believes that Adjusted
EBITDA is a meaningful measure of operating profitability and useful for measuring returns
on capital investments over time as it is not distorted by unusual gains, losses, or other
items.
Table 6
Scholastic Corporation
Consolidated Statements of Operations – Supplemental
Adjusted EBITDA by Segment
(Unaudited)
(In $ Millions)
Three months ended
05/31/26
CBPD (1)
EDUC (1)
ENT (1)
INTL (1)
OVH (1)(4)
Total
Earnings (loss) before income taxes as reported
$
60.1
$
27.0
$
(0.0)
$
(14.8)
$
(57.8)
$
14.5
One-time items before income taxes
—
0.9
0.4
17.4
23.9
42.6
Earnings (loss) before income taxes excluding
one-time items
60.1
27.9
0.4
2.6
(33.9)
57.1
Interest (income) expense (2)
0.2
0.0
0.5
0.0
0.2
0.9
Depreciation and amortization (3)
8.3
6.0
8.0
2.2
2.2
26.7
Adjusted EBITDA (4)
$
68.6
$
33.9
$
8.9
$
4.8
$
(31.5)
$
84.7
Three months ended
05/31/25
CBPD (1)
EDUC (1)
ENT (1)
INTL (1)
OVH (1)
Total
Earnings (loss) before income taxes as reported
$
57.5
$
30.7
$
(2.9)
$
2.9
$
(39.3)
$
48.9
One-time items before income taxes
0.6
0.6
0.9
2.4
5.4
9.9
Earnings (loss) before income taxes excluding
one-time items
58.1
31.3
(2.0)
5.3
(33.9)
58.8
Interest (income) expense (2)
0.1
0.0
0.7
0.1
3.6
4.5
Depreciation and amortization (3)
8.0
6.2
5.0
2.0
6.7
27.9
Adjusted EBITDA
$
66.2
$
37.5
$
3.7
$
7.4
$
(23.6)
$
91.2
Twelve months ended
05/31/26
CBPD (1)
EDUC (1)
ENT (1)
INTL (1)
OVH (1)(4)
Total
Earnings (loss) before income taxes as reported
$
142.5
$
(4.1)
$
(17.9)
$
(12.9)
$
(22.4)
$
85.2
One-time items before income taxes
0.8
4.3
6.8
17.9
(80.4)
(50.6)
Earnings (loss) before income taxes excluding
one-time items
143.3
0.2
(11.1)
5.0
(102.8)
34.6
Interest (income) expense (2)
0.4
0.0
2.2
0.1
8.9
11.6
Depreciation and amortization (3)
31.2
24.9
24.4
8.1
16.7
105.3
Adjusted EBITDA (4)
$
174.9
$
25.1
$
15.5
$
13.2
$
(77.2)
$
151.5
Twelve months ended
05/31/25
CBPD (1)
EDUC (1)
ENT (1)
INTL (1)
OVH (1)
Total
Earnings (loss) before income taxes as reported
$
130.5
$
6.3
$
(14.3)
$
(3.1)
$
(120.7)
$
(1.3)
One-time items before income taxes
0.6
0.6
4.9
3.9
10.0
20.0
Earnings (loss) before income taxes excluding
one-time items
131.1
6.9
(9.4)
0.8
(110.7)
18.7
Interest (income) expense (2)
0.2
0.0
3.2
0.1
12.9
16.4
Depreciation and amortization (3)
31.1
24.8
21.5
7.9
25.0
110.3
Adjusted EBITDA
$
162.4
$
31.7
$
15.3
$
8.8
$
(72.8)
$
145.4
(1)
The Company’s segments are defined as the following: CBPD – Children’s Book Publishing and Distribution
segment; EDUC – Education segment; ENT – Entertainment segment; INTL – International segment; OVH –
unallocated overhead.
(2)
Amounts include production loan interest amortized into cost of goods sold.
(3)
Depreciation and amortization in the Children’s Book Publishing and Distribution, Education and International
segments includes amounts allocated from overhead.
(4)
Adjusted EBITDA for unallocated overhead and total includes the net cost impact of the sale-leaseback
transactions of $7.8 and $14.5 for the three and twelve months ended May 31, 2026, respectively.
Table 7
Scholastic Corporation
Pro Forma Supplemental Information
(Unaudited)
(In $ Millions)
Three months ended
Change
05/31/26
05/31/25
$
%
Adjusted unallocated overhead
$
(33.8)
$
(30.1)
$
(3.7)
(12) %
Incremental full-year impact of sale-leaseback transactions
—
(3.9)
3.9
Pro forma Adjusted unallocated overhead (1)
$
(33.8)
$
(34.0)
$
0.2
1 %
Adjusted operating income
$
58.3
$
63.4
$
(5.1)
(8) %
Incremental full-year impact of sale-leaseback transactions
—
(3.9)
3.9
Pro forma Adjusted operating income (1) (2)
$
58.3
$
59.5
$
(1.2)
(2) %
Adjusted EBITDA
$
84.7
$
91.2
$
(6.5)
(7) %
Incremental full-year impact of sale-leaseback transactions
—
(7.5)
7.5
Pro forma Adjusted EBITDA (1) (2)
$
84.7
$
83.7
$
1.0
1 %
Twelve months ended
Change
05/31/26
05/31/25
$
%
Adjusted unallocated overhead
$
(94.6)
$
(98.1)
$
3.5
4 %
Incremental full-year impact of sale-leaseback transactions
(11.8)
(15.9)
4.1
Pro forma Adjusted unallocated overhead (1)
$
(106.4)
$
(114.0)
$
7.6
7 %
Adjusted operating income
$
47.1
$
35.8
$
11.3
32 %
Incremental full-year impact of sale-leaseback transactions
(11.8)
(15.9)
4.1
Pro forma Adjusted operating income (1) (2)
$
35.3
$
19.9
$
15.4
77 %
Adjusted EBITDA
$
151.5
$
145.4
$
6.1
4 %
Incremental full-year impact of sale-leaseback transactions
(19.1)
(30.1)
11.0
Pro forma Adjusted EBITDA (1) (2)
$
132.4
$
115.3
$
17.1
15 %
(1)
Pro forma Adjusted unallocated overhead, Pro forma Adjusted operating income and Pro forma Adjusted
EBITDA reflect the net impacts of the sale-leaseback transactions as if the transactions had occurred on
June 1, 2024, the beginning of fiscal 2025. Fiscal 2026 reported results include the actual impact beginning
upon completion of the transactions in December 2025. The incremental adjustments shown above reflect
the additional impact for the portion of fiscal 2026 prior to completion of the transactions. Fiscal 2025
reported results include no impact from the transactions.
(2)
For fiscal 2026, the full-year pro forma cost impact was $19.0 on Adjusted operating income, consisting of
$7.2 recognized in reported fiscal 2026 results and $11.8 of incremental adjustments. For fiscal 2026, the
full-year pro forma cost impact on Adjusted EBITDA was $33.6, consisting of $14.5 recognized in reported
fiscal 2026 results and $19.1 of incremental adjustments. For fiscal 2025, the full-year pro forma cost
impacts were $15.9 on Adjusted operating income and $30.1 on Adjusted EBITDA.
View original content to download multimedia:https://www.prnewswire.com/news-releases/scholastic-reports-fourth-quarter-and-fiscal-2026-results-302833617.html
SOURCE Scholastic Corporation

Escalade Announces Second Quarter 2026 Results Conference Call Date
Analog Devices to Report Third Quarter Fiscal Year 2026 Financial Results on Wednesday, August 19, 2026
Scholastic Reports Fourth Quarter and Fiscal 2026 Results
Send Rakhi to UK swiftly with UK Gifts Portal

Whiteboard Series with NEAR | Ep: 45 Joel Thorstensson from ceramic.network

New Gooseneck Omni Antennas Offer Enhanced Signals in a Durable Package

Why You Should Build on #NEAR – Co-founder Illia Polosukhin at CV Labs
Whiteboard Series with NEAR | Ep: 45 Joel Thorstensson from ceramic.network

NEAR End of Year Town Hall 2021: The Open Web World, MetaBUILD 2 Hackathon and 2021 recap
Trending
-

 Technology5 days ago
Emdoor Launches “Ailyn” AI Hub at WAIC 2026: Unifying Intelligence Across Every Device
-

 Technology5 days ago
Penetron Strengthens Global Research Collaboration at ICSHM 2026
-

 Coin Market4 days ago
Saylor turns up heat with ‘110 reasons’ why BIP-110 is a bad idea
-

 Coin Market4 days ago
Will the US get CLARITY this week? Bitcoin’s new $80K target: Hodler’s Digest, July 19
-

 Technology4 days ago
“Every Day CO₂ Challenge”: More Than a Game, A New Way of Learning
-
Technology4 days ago
China-Europe Youth Exchange Campaign: When Fashion Meets Football — A Green Pitch Appointment for Cross-Cultural Dialogue
-

 Technology4 days ago
Powering ASEAN’s Manufacturing Transformation: IME 2026 Connects Technology, Industry and Opportunity
-

 Technology4 days ago
BOC Group Releases ADONIS 19.0 LTS to Bring Smarter Support into Everyday BPM Work