
Technology
STAGWELL INC. (NASDAQ: STGW) REPORTS RESULTS FOR THE THREE AND TWELVE MONTHS ENDED DECEMBER 31, 2024
Published
1 year agoon
By
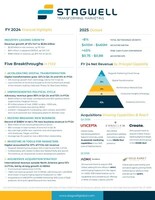
Q4 YoY Revenue Growth of 20%, With 22% Growth in Digital Transformation
Q4 YoY Net Revenue Growth of 14%, Organic Net Revenue Growth of 10%, Digital Transformation Net Revenue Growth of 15%
Q4 Net Income Attributable to Stagwell Inc. Common Shareholders of $3 million
Q4 Adjusted EBITDA of $123 million; Adjusted EBITDA Margin of 20%
Q4 EPS of $0.03; Adjusted EPS of $0.24
Eighth Consecutive Quarter of Record LTM Net New Business
Net New Business of $102 million in Q4; LTM Net New Business of $382 million
Introduce Guidance for 2025 of Total Net Revenue Growth of ~8%; Adjusted EBITDA of $410 million to $460 million; Free Cash Flow Conversion in excess of 45%
Stagwell To Host Investor Day on April 2nd 2025
NEW YORK, Feb. 27, 2025 /PRNewswire/ — (NASDAQ: STGW) – Stagwell Inc. (“Stagwell”) today announced financial results for the quarter and year ended December 31, 2024.
FOURTH QUARTER RESULTS:
Q4 Revenue of $789 million, an increase of 20% versus the prior year period; Full Year Revenue of $2.8 billion, an increase of 12% versus the prior yearQ4 Net Revenue of $630 million, an increase of 14% versus the prior year period; Full Year Net Revenue of $2.3 billion, an increase of 7% versus the prior yearQ4 Organic Net Revenue increased 10% versus the prior year period; Full Year Organic Net Revenue increased 5% versus the prior yearQ4 Net Income attributable to Stagwell Inc. Common Shareholders of $3 million versus $1 million in the prior year period; Full Year Net Income attributable to Stagwell Inc. Common Shareholders of $2 million versus $0.1 million in the prior yearQ4 Adjusted EBITDA of $123 million, an increase of 30% versus the prior year period; Full Year Adjusted EBITDA of $411 million, an increase of 14% versus the prior yearQ4 Adjusted EBITDA Margin of 20% on net revenue; Full Year Adjusted EBITDA Margin of 18% on net revenueQ4 Earnings Per Share Attributable to Stagwell Inc. Common Shareholders of $0.03 versus $0.00 in the prior year period; Full Year Earnings Per Share Attributable to Stagwell Inc. Common Shareholders of $0.02 versus $0.00 in the prior yearQ4 Adjusted Earnings Per Share attributable to Stagwell Inc. Common Shareholders of $0.24 versus $0.12 in the prior year period; Full Year Adjusted Earnings Per Share attributable to Stagwell Inc. Common Shareholders of $0.77 versus $0.57 in the prior yearNet new business of $102 million in the fourth quarter, last twelve-month net new business of $382 million
See “Non-GAAP Financial Measures” below for explanations and reconciliations of the Company’s non-GAAP financial measures.
Mark Penn, Chairman and CEO of Stagwell, said, “2024 was a breakthrough year for Stagwell and has fueled a strong start to 2025. We re-established ourselves as the fastest growing business in the industry, accelerated rapidly in Digital Transformation, took advantage of an unprecedented U.S. election cycle, and made strategic investments to expand our capabilities and geographical reach. I’m looking forward to a strong 2025.”
Frank Lanuto, Chief Financial Officer, commented: “Stagwell posted strong results in the fourth quarter with double-digit revenue growth in 4 of our 5 principal capabilities. We delivered fourth quarter revenue of $789 million. Simultaneously, we grew our adjusted EBITDA to $123 million, representing a 20% margin on net revenue, an improvement of approximately 230 bps over the prior year period, as we lowered our comp to revenue ratio to 57.5%, a company record. These results give us confidence in the year ahead.”
Financial Outlook
2025 financial guidance is announced as follows:
Total Net Revenue growth of approximately 8%Adjusted EBITDA of $410 million to $460 millionFree Cash Flow Conversion in excess of 45%Adjusted EPS of $0.75 – $0.88Guidance includes anticipated impact from acquisitions or dispositions.
* The Company has excluded a quantitative reconciliation with respect to the Company’s 2025 guidance under the “unreasonable efforts” exception in Item 10(e)(1)(i)(B) of Regulation S-K. See “Non-GAAP Financial Measures” below for additional information.
Video Webcast
Management will host a video webcast on Thursday, February 27, 2025, at 8:30 a.m. (ET) to discuss results for Stagwell Inc. for the quarter and year ended December 31, 2024. The video webcast will be accessible at https://bit.ly/3EVAIAk. An investor presentation has been posted on our website at www.stagwellglobal.com and may be referred to during the webcast.
A recording of the webcast will be accessible one hour after the webcast and available for ninety days at www.stagwellglobal.com.
Stagwell Inc.
Stagwell is the challenger network built to transform marketing. We deliver scaled creative performance for the world’s most ambitious brands, connecting culture-moving creativity with leading-edge technology to harmonize the art and science of marketing. Led by entrepreneurs, our specialists in 40+ countries are unified under a single purpose: to drive effectiveness and improve business results for their clients. Join us at www.stagwellglobal.com.
Contacts
For Investors:
Ben Allanson
IR@stagwellglobal.com
For Press:
Beth Sidhu
PR@stagwellglobal.com
Non-GAAP Financial Measures
In addition to its reported results, Stagwell Inc. has included in this earnings release certain financial results that the Securities and Exchange Commission (SEC) defines as “non-GAAP Financial Measures.” Management believes that such non-GAAP financial measures, when read in conjunction with the Company’s reported results, can provide useful supplemental information for investors analyzing period to period comparisons of the Company’s results. Such non-GAAP financial measures include the following:
(1) Organic Net Revenue: “Organic net revenue growth” and “Organic net revenue decline” reflects the year-over-year change in the Company’s reported net revenue attributable to the Company’s management of the entities it owns. We calculate organic net revenue growth (decline) by subtracting the net impact of acquisitions (divestitures) and the impact of foreign currency exchange fluctuations from the aggregate year-over-year increase or decrease in the Company’s reported net revenue. The net impact of acquisitions (divestitures) reflects the year-over-year change in the Company’s reported net revenue attributable to the impact of all individual entities that were acquired or divested in the current and prior year. We calculate impact of an acquisition as follows: (a) for an entity acquired during the current year, we present the entity’s prior year net revenue for the same period during which we owned it in the current year as impact of the acquisition in the current year; and (b) for an entity acquired in the prior year, we present the entity’s prior year net revenue for the period during which we did not own the entity in the prior year as impact of the acquisition in the current year. We calculate impact of a divestiture as follows: (a) for a divestiture in the current year, we present the entity’s prior year net revenue for the same period during which we no longer owned it in the current year as impact of the divestiture in the current year; and (b) for a divestiture in the prior year, we present the entity’s prior year net revenue for the period during which we owned it in the prior year as impact of the divestiture in the current year. We calculate the impact of any acquisition or divestiture without adjusting for foreign currency exchange fluctuations. The impact of foreign currency exchange fluctuations reflects the year-over-year change in the Company’s reported net revenue attributable to changes in foreign currency exchange rates. We calculate the impact of foreign currency exchange fluctuations for the portion of the reporting period in which we recognized revenue from a foreign entity in both the current year and the prior year. The impact is calculated as the difference between (1) reported prior period net revenue (converted to U.S. dollars at historical foreign currency exchange rates) and (2) prior period net revenue converted to U.S. dollars at current period foreign exchange rates.
(2) Net New Business: Estimate of annualized revenue for new wins less annualized revenue for losses incurred in the period.
(3) Adjusted EBITDA: defined as Net income excluding non-operating income or expense to achieve operating income, plus depreciation and amortization, stock-based compensation, deferred acquisition consideration adjustments, and other items. Other items include restructuring costs, acquisition-related expenses, and non-recurring items.
(4) Adjusted Diluted EPS is defined as (i) Net income (loss) attributable to Stagwell Inc. common shareholders, plus net income attributable to Class C shareholders, excluding amortization expense, impairment and other losses, stock-based compensation, deferred acquisition consideration adjustments, discrete tax items, and other items, divided by (ii) (a) the per weighted average number of common shares outstanding plus (b) the weighted average number of Class C shares outstanding, (if dilutive). Other items includes restructuring costs, acquisition-related expenses, and non-recurring items, and subject to the anti-dilution rules.
(5) Free Cash Flow: defined as Adjusted EBITDA less capital expenditures, change in net working capital, cash taxes, interest, and distributions to minority interests, but excludes contingent M&A payments. Free Cash Flow Conversion is the percentage of adjusted EBITDA.
Included in this earnings release are tables reconciling reported Stagwell Inc. results to arrive at certain of these non-GAAP financial measures.
This document contains forward-looking statements within the meaning of Section 27A of the Securities Act of 1933, as amended (the “Securities Act”), and Section 21E of the Securities Exchange Act of 1934, as amended (the “Exchange Act”). The Company’s representatives may also make forward-looking statements orally or in writing from time to time. Statements in this document that are not historical facts, including, statements about the Company’s beliefs and expectations, future financial performance, growth, and future prospects, the Company’s strategy, business and economic trends and growth, technological leadership and differentiation, potential and completed acquisitions, anticipated and actual operating efficiencies and synergies and estimates of amounts for redeemable noncontrolling interests and deferred acquisition consideration, constitute forward-looking statements. Forward-looking statements, which are generally denoted by words such as “ability,” “aim,” “anticipate,” “assume,” “believe,” “build,” “consider,” “continue,” “could,” “create,” “develop,” “drive,” “estimate,” “expect,” “focus,” “forecast,” “foresee,” “future,” “goal,” “guidance,” “in development,” “intend,” “likely,” “look,” “maintain,” “may,” “ongoing,” “opportunity,” “outlook,” “plan,” “possible,” “potential,” “predict,” “probable,” “project,” “should,” “target,” “will,” “would” or the negative of such terms or other variations thereof and terms of similar substance used in connection with any discussion of current plans, estimates and projections are subject to change based on a number of factors, including those outlined in this section.
Forward-looking statements in this document are based on certain key expectations and assumptions made by the Company. Although the management of the Company believes that the expectations and assumptions on which such forward-looking statements are based are reasonable, undue reliance should not be placed on the forward-looking statements because the Company can give no assurance that they will prove to be correct. The material assumptions upon which such forward-looking statements are based include, among others, assumptions with respect to general business, economic and market conditions, the competitive environment, anticipated and unanticipated tax consequences and anticipated and unanticipated costs. These forward-looking statements are based on current plans, estimates and projections, and are subject to change based on a number of factors, including those outlined in this section. These forward-looking statements are subject to various risks and uncertainties, many of which are outside the Company’s control. Therefore, you should not place undue reliance on such statements. Forward-looking statements speak only as of the date they are made, and the Company undertakes no obligation to update publicly any of them in light of new information or future events, if any.
Forward-looking statements involve inherent risks and uncertainties. A number of important factors could cause actual results to differ materially from those contained in any forward-looking statements. Such risk factors include, but are not limited to, the following:
risks associated with international, national and regional unfavorable economic conditions that could affect the Company or its clients;demand for the Company’s services, which may precipitate or exacerbate other risks and uncertainties;inflation and actions taken by central banks to counter inflation;the Company’s ability to attract new clients and retain existing clients;the impact of a reduction in client spending and changes in client advertising, marketing and corporate communications requirements;financial failure of the Company’s clients;the Company’s ability to retain and attract key employees;the Company’s ability to compete in the markets in which it operates;the Company’s ability to achieve its cost saving initiatives;the Company’s implementation of strategic initiatives;the Company’s ability to remain in compliance with its debt agreements and the Company’s ability to finance its contingent payment obligations when due and payable, including but not limited to those relating to redeemable noncontrolling interests and deferred acquisition consideration;the Company’s ability to manage its growth effectively;the Company’s ability to identify and complete acquisitions or other strategic transactions that complement and expand the Company’s business capabilities and successfully integrate newly acquired businesses into the Company’s operations, retain key employees, and realize expected cost savings, synergies and other related anticipated benefits within the expected time period;the Company’s ability to identify and complete divestitures and to achieve the anticipated benefits therefrom;the Company’s ability to develop products incorporating new technologies, including augmented reality, artificial intelligence, and virtual reality, and realize benefits from such products;the Company’s use of artificial intelligence, including generative artificial intelligence;adverse tax consequences for the Company, its operations and its stockholders, that may differ from the expectations of the Company, including that future changes in tax laws, potential increases to corporate tax rates in the United States and disagreements with tax authorities on the Company’s determinations that may result in increased tax costs;adverse tax consequences in connection with the business combination that formed the Company in August 2021, including the incurrence of material Canadian federal income tax (including material “emigration tax”);the Company’s ability to establish and maintain an effective system of internal control over financial reporting, including the risk that the Company’s internal controls will fail to detect misstatements in its financial statements;the Company’s ability to accurately forecast its future financial performance and provide accurate guidance;the Company’s ability to protect client data from security incidents or cyberattacks;economic disruptions resulting from war and other geopolitical tensions (such as the ongoing military conflicts between Russia and Ukraine and in the Middle East), terrorist activities, natural disasters, and public health events;stock price volatility; andforeign currency fluctuations.
Investors should carefully consider these risk factors, other risk factors described herein, and the additional risk factors outlined in more detail in our 2023 Form 10-K, filed with the Securities and Exchange Commission (the “SEC”) on March 11, 2024, and accessible on the SEC’s website at www.sec.gov, under the caption “Risk Factors,” and in the Company’s other SEC filings.
SCHEDULE 1
STAGWELL INC.
UNAUDITED CONSOLIDATED STATEMENTS OF OPERATIONS
(amounts in thousands, except per share amounts)
Three Months Ended
December 31,
Year Ended
December 31,
2024
2023
2024
2023
Revenue
$ 788,708
$ 654,895
$ 2,841,216
$ 2,527,177
Operating Expenses
Cost of services
502,522
419,865
1,842,978
1,621,174
Office and general expenses
203,887
179,871
711,803
661,250
Depreciation and amortization
38,771
35,036
151,652
142,831
Impairment and other losses
—
833
1,715
11,395
745,180
635,605
2,708,148
2,436,650
Operating Income
43,528
19,290
133,068
90,527
Other income (expenses):
Interest expense, net
(24,038)
(22,889)
(92,317)
(90,644)
Foreign exchange, net
645
(672)
(1,656)
(2,960)
Gain on sale of business
—
94,505
—
94,505
Other, net
(547)
108
(1,372)
(359)
(23,940)
71,052
(95,345)
542
Income before income taxes and equity in earnings of non-consolidated affiliates
19,588
90,342
37,723
91,069
Income tax expense
3,741
35,560
13,182
40,557
Income before equity in earnings of non-consolidated affiliates
15,847
54,782
24,541
50,512
Equity in income (loss) of non-consolidated affiliates
—
(8,423)
503
(8,870)
Net income
15,847
46,359
25,044
41,642
Net income attributable to noncontrolling and redeemable noncontrolling interests
(12,612)
(45,073)
(22,785)
(41,508)
Net income attributable to Stagwell Inc. common shareholders
$ 3,235
$ 1,286
$ 2,259
$ 134
Earnings Per Common Share:
Basic
$ 0.03
$ 0.01
$ 0.02
$ —
Diluted
$ 0.03
$ —
$ 0.02
$ —
Weighted Average Number of Common Shares Outstanding:
Basic
109,266
112,769
110,890
117,259
Diluted
115,147
119,621
115,752
122,170
SCHEDULE 2
STAGWELL INC.
UNAUDITED COMPONENTS OF NET REVENUE CHANGE
(amounts in thousands)
Net Revenue – Components of Change
Change
Three Months
Ended
December 31,
2023
Foreign
Currency
Net
Acquisitions
(Divestitures)
Organic
Total Change
Three Months
Ended
December 31,
2024
Organic
Total
Integrated Agencies Network
$ 302,137
$ 25
$ 4,800
$ 27,405
$ 32,230
$ 334,367
9.1 %
10.7 %
Brand Performance Network
168,519
75
—
6,046
6,121
174,640
3.6 %
3.6 %
Communications Network
68,229
42
15,757
23,666
39,465
107,694
34.7 %
57.8 %
All Other
12,181
(161)
2,950
(2,048)
741
12,922
(16.8) %
6.1 %
$ 551,066
$ (19)
$ 23,507
$ 55,069
$ 78,557
$ 629,623
10.0 %
14.3 %
Net Revenue – Components of Change
Change
Year Ended
December 31,
2023
Foreign
Currency
Net
Acquisitions
(Divestitures)
Organic
Total Change
Year Ended
December 31,
2024
Organic
Total
Integrated Agencies Network
$ 1,232,798
$ 226
$ 7,208
$ 32,521
$ 39,955
$ 1,272,753
2.6 %
3.2 %
Brand Performance Network
627,810
2,220
2,252
18,948
$ 23,420
651,230
3.0 %
3.7 %
Communications Network
245,261
(28)
22,177
$ 66,385
$ 88,534
333,795
27.1 %
36.1 %
All Other
46,585
(984)
(609)
(6,108)
(7,701)
38,884
(13.1) %
(16.5) %
$ 2,152,454
$ 1,434
$ 31,028
$ 111,746
$ 144,208
$ 2,296,662
5.2 %
6.7 %
(1) See Non-GAAP Financial Measures section above for the definition of Adjusted EBITDA and Other items, net.
Note: The Company made changes to its internal management and reporting structure in the first quarter of 2024, resulting in a change to its reportable segments (Networks). Specifically, certain agencies previously within the Brand Performance Network are now in the Integrated Agencies Network. Periods presented prior to the first quarter of 2024 have been recast to reflect the reclassification of certain reporting units (Brands) between operating segments.
SCHEDULE 3
STAGWELL INC.
UNAUDITED SEGMENT OPERATING RESULTS
(amounts in thousands)
For the Three Months Ended December 31, 2024
Integrated
Agencies
Network
Brand
Performance
Network
Communications
Network
All Other
Corporate
Total
Net Revenue
$ 334,367
$ 174,640
$ 107,694
$ 12,922
$ —
$ 629,623
Billable costs
73,558
13,688
72,150
(311)
—
159,085
Revenue
407,925
188,328
179,844
12,611
—
788,708
Billable costs
73,558
13,688
72,150
(311)
—
159,085
Staff costs
212,062
100,890
54,590
10,364
12,315
390,221
Administrative costs
32,857
23,959
10,940
2,692
5,006
75,454
Unbillable and other costs, net
16,455
19,224
965
4,105
—
40,749
Adjusted EBITDA (1)
72,993
30,567
41,199
(4,239)
(17,321)
123,199
Stock-based compensation
2,083
1,989
643
175
8,345
13,235
Depreciation and amortization
19,345
8,071
5,119
2,780
3,456
38,771
Deferred acquisition consideration
7,600
(1,290)
9,673
(938)
—
15,045
Other items, net (1)
7,388
3,173
1,146
185
728
12,620
Operating income (loss)
$ 36,577
$ 18,624
$ 24,618
$ (6,441)
$ (29,850)
$ 43,528
(1) See Non-GAAP Financial Measures section above for the definition of Adjusted EBITDA and Other items, net.
SCHEDULE 4
STAGWELL INC.
UNAUDITED SEGMENT OPERATING RESULTS
(amounts in thousands)
For the Year Ended December 31, 2024
Integrated
Agencies
Network
Brand
Performance
Network
Communications
Network
All Other
Corporate
Total
Net Revenue
$ 1,272,753
$ 651,230
$ 333,795
$ 38,884
$ —
$ 2,296,662
Billable costs
262,692
100,654
181,345
(137)
—
544,554
Revenue
1,535,445
751,884
515,140
38,747
—
2,841,216
Billable costs
262,692
100,654
181,345
(137)
—
544,554
Staff costs
792,041
397,301
177,629
34,999
47,736
1,449,706
Administrative costs
128,954
93,155
37,057
6,139
16,402
281,707
Unbillable and other costs, net
72,756
65,901
2,235
13,570
—
154,462
Adjusted EBITDA (1)
279,002
94,873
116,874
(15,824)
(64,138)
410,787
Stock-based compensation
27,253
6,977
3,374
904
13,653
52,161
Depreciation and amortization
78,076
34,595
14,126
12,718
12,137
151,652
Deferred acquisition consideration
13,290
(7,744)
18,770
(1,321)
—
22,995
Impairment and other losses
1,500
—
—
—
215
1,715
Other items, net (1)
20,592
19,536
3,250
887
4,931
49,196
Operating income (loss)
$ 138,291
$ 41,509
$ 77,354
$ (29,012)
$ (95,074)
$ 133,068
(1) See Non-GAAP Financial Measures section above for the definition of Adjusted EBITDA and Other items, net.
SCHEDULE 5
STAGWELL INC.
UNAUDITED SEGMENT OPERATING RESULTS
(amounts in thousands)
For the Three Months Ended December 31, 2023
Integrated
Agencies
Network
Brand
Performance
Network
Communications
Network
All Other
Corporate
Total
Net Revenue
$ 302,137
$ 168,519
$ 68,229
$ 12,181
$ —
$ 551,066
Billable costs
51,665
16,921
35,217
26
—
103,829
Revenue
353,802
185,440
103,446
12,207
—
654,895
Billable costs
51,665
16,921
35,217
26
—
103,829
Staff costs
195,953
97,871
43,319
6,292
11,088
354,523
Administrative costs
29,618
23,174
8,568
3,445
(1,871)
62,934
Unbillable and other costs, net
18,111
17,357
277
2,885
—
38,630
Adjusted EBITDA (1)
58,456
30,117
16,065
(441)
(9,217)
94,980
Stock-based compensation
12,015
2,364
1,157
91
6,937
22,564
Depreciation and amortization
19,680
8,090
2,800
2,238
2,228
35,036
Deferred acquisition consideration
3,813
1,739
(3,373)
—
—
2,179
Impairment and other losses
737
96
—
—
—
833
Other items, net (1)
6,403
3,713
198
95
4,669
15,078
Operating income (loss)
$ 15,808
$ 14,115
$ 15,283
$ (2,865)
$ (23,051)
$ 19,290
(1) See Non-GAAP Financial Measures section above for the definition of Adjusted EBITDA and Other items.
Note: The Company made changes to its internal management and reporting structure in the first quarter of 2024, resulting in a change to its reportable segments (Networks). Specifically, certain agencies previously within the Brand Performance Network are now in the Integrated Agencies Network. Periods presented prior to the first quarter of 2024 have been recast to reflect the reclassification of certain reporting units (Brands) between operating segments.
SCHEDULE 6
STAGWELL INC.
UNAUDITED SEGMENT OPERATING RESULTS
(amounts in thousands)
For the Year Ended December 31, 2023
Integrated
Agencies
Network
Brand
Performance
Network
Communications
Network
All Other
Corporate
Total
Net Revenue
$ 1,232,798
$ 627,810
$ 245,261
$ 46,585
$ —
$ 2,152,454
Billable costs
185,913
100,364
88,446
—
—
374,723
Revenue
1,418,711
728,174
333,707
46,585
—
2,527,177
Billable costs
185,913
100,364
88,446
—
—
374,723
Staff costs
768,846
386,803
159,165
37,416
36,938
1,389,168
Administrative costs
122,618
87,337
33,664
4,689
11,472
259,780
Unbillable and other costs, net
71,776
55,891
613
15,087
—
143,367
Adjusted EBITDA (1)
269,558
97,779
51,819
(10,607)
(48,410)
360,139
Stock-based compensation
27,485
6,204
3,334
518
19,638
57,179
Depreciation and amortization
81,957
33,250
11,016
8,390
8,218
142,831
Deferred acquisition consideration
11,931
2,851
30
(1,752)
—
13,060
Impairment and other losses
11,299
96
—
—
—
11,395
Other items, net (1)
20,225
12,206
1,535
1,174
10,007
45,147
Operating income (loss)
$ 116,661
$ 43,172
$ 35,904
$ (18,937)
$ (86,273)
$ 90,527
(1) See Non-GAAP Financial Measures section above for the definition of Adjusted EBITDA and Other items, net.
Note: The Company made changes to its internal management and reporting structure in the first quarter of 2024, resulting in a change to its reportable segments (Networks). Specifically, certain agencies previously within the Brand Performance Network are now in the Integrated Agencies Network. Periods presented prior to the first quarter of 2024 have been recast to reflect the reclassification of certain reporting units (Brands) between operating segments.
SCHEDULE 7
STAGWELL INC.
UNAUDITED RECONCILIATION OF ADJUSTED DILUTED EARNINGS PER SHARE (NON-GAAP MEASURE)
(amounts in thousands, except per share amounts)
For the Three Months Ended December 31, 2024
GAAP
Adjustments
Non-GAAP
Net income attributable to Stagwell Inc. common shareholders
$ 3,235
$ 22,226
$ 25,461
Net income attributable to Class C shareholders
—
40,500
40,500
Net income attributable to Stagwell Inc. and Class C shareholders and adjusted net income
$ 3,235
$ 62,726
$ 65,961
Weighted average number of common shares outstanding
115,147
2,567
117,714
Weighted average number of common Class C shares outstanding
—
151,649
151,649
Weighted average number of shares outstanding
115,147
154,216
269,363
Diluted EPS and Adjusted Diluted EPS (1)
$ 0.03
$ 0.24
Adjustments to Net income
Amortization
$ 30,572
Stock-based compensation
13,235
Deferred acquisition consideration
15,045
Other items, net
12,620
71,472
Adjusted tax expense
(20,040)
51,432
Net income attributable to Class C shareholders
11,294
$ 62,726
Allocation of adjustments to Net income
Net income attributable to Stagwell Inc. common shareholders – add-backs
$ 22,226
Net income attributable to Class C shareholders – add-backs
29,206
Net income attributable to Class C shareholders
11,294
40,500
$ 62,726
(1) Adjusted Diluted EPS is defined within the Non-GAAP Financial Measures section of the Executive Summary.
SCHEDULE 8
STAGWELL INC.
UNAUDITED RECONCILIATION OF ADJUSTED DILUTED EARNINGS PER SHARE (NON-GAAP MEASURE)
(amounts in thousands, except per share amounts)
For the Year Ended December 31, 2024
GAAP
Adjustments
Non-GAAP
Net income attributable to Stagwell Inc. common shareholders
$ 2,259
$ 80,403
$ 82,662
Net income attributable to Class C shareholders
—
123,942
123,942
Net income attributable to Stagwell Inc. and Class C and adjusted net income
$ 2,259
$ 204,345
$ 206,604
Weighted average number of common shares outstanding
115,752
2,234
117,986
Weighted average number of common Class C shares outstanding
—
151,649
151,649
Weighted average number of shares outstanding
115,752
153,883
269,635
Diluted EPS and Adjusted Diluted EPS (1)
$ 0.02
$ 0.77
Adjustments to Net Income
Amortization
$ 122,442
Impairment and other losses
1,715
Stock-based compensation
52,161
Deferred acquisition consideration
22,995
Other items, net
49,196
248,509
Adjusted tax expense
(61,308)
187,201
Net income attributable to Class C shareholders
17,144
$ 204,345
Allocation of adjustments to Net income
Net income attributable to Stagwell Inc. common shareholders – add-backs
$ 80,403
Net income attributable to Class C shareholders – add-backs
106,798
Net income attributable to Class C shareholders
17,144
123,942
$ 204,345
(1) Adjusted Diluted EPS is defined within the Non-GAAP Financial Measures section of the Executive Summary.
SCHEDULE 9
STAGWELL INC.
UNAUDITED RECONCILIATION OF ADJUSTED DILUTED EARNINGS PER SHARE (NON-GAAP MEASURE)
(amounts in thousands, except per share amounts)
For the Three Months Ended December 31, 2023
GAAP
Adjustments
Non-GAAP
Net income (loss) attributable to Stagwell Inc. common shareholders
$ 127
$ (4,705)
$ (4,578)
Net income attributable to Class C shareholders
—
35,780
35,780
Net income attributable to Stagwell Inc. and Class C and adjusted net income
$ 127
$ 31,075
$ 31,202
Weighted average number of common shares outstanding
119,621
—
119,621
Weighted average number of common Class C shares outstanding
—
151,649
151,649
Weighted average number of shares outstanding
119,621
151,649
271,270
Diluted EPS and Adjusted Diluted EPS (1)
$ —
$ 0.12
Adjustments to Net income (loss)
Amortization
$ 27,231
Impairment and other losses
833
Stock-based compensation
22,564
Deferred acquisition consideration
3,338
Gain on sale of business
(94,505)
Other items, net
15,078
(25,461)
Adjusted tax expense
14,768
(10,693)
Net income attributable to Class C shareholders
41,768
$ 31,075
Allocation of adjustments to Net income (loss)
Net loss attributable to Stagwell Inc. common shareholders – add-backs
$ (4,705)
Net loss attributable to Class C shareholders – add-backs
(5,988)
Net income attributable to Class C shareholders
41,768
35,780
$ 31,075
(1) Adjusted Diluted EPS is defined within the Non-GAAP Financial Measures section of the Executive Summary.
SCHEDULE 10
STAGWELL INC.
UNAUDITED RECONCILIATION OF ADJUSTED DILUTED EARNINGS PER SHARE (NON-GAAP MEASURE)
(amounts in thousands, except per share amounts)
For the Year Ended December 31, 2023
GAAP
Adjustments
Non-GAAP
Net income attributable to Stagwell Inc. common shareholders
$ 134
$ 52,712
$ 52,846
Net income attributable to Class C shareholders
—
106,153
106,153
Net income attributable to Stagwell Inc. and Class C and adjusted net income
$ 134
$ 158,865
$ 158,999
Weighted average number of common shares outstanding
122,170
3,628
125,798
Weighted average number of common Class C shares outstanding
—
154,972
154,972
Weighted average number of shares outstanding
122,170
158,600
280,770
Diluted EPS and Adjusted Diluted EPS (1)
$ —
$ 0.57
Adjustments to Net income
Amortization
$ 113,835
Impairment and other losses
11,395
Stock-based compensation
57,179
Deferred acquisition consideration
13,060
Gain on sale of business
(94,505)
Other items, net
45,147
146,111
Adjusted tax expense
(26,312)
119,799
Net income attributable to Class C shareholders
39,066
$ 158,865
Allocation of adjustments to Net income
Net income attributable to Stagwell Inc. common shareholders
$ 52,712
Net income to attributable to Class C shareholders – add-backs
67,087
Net income attributable to Class C shareholders
39,066
106,153
$ 158,865
(1) Adjusted Diluted EPS is defined within the Non-GAAP Financial Measures section of the Executive Summary.
SCHEDULE 11
STAGWELL INC.
UNAUDITED CONSOLIDATED BALANCE SHEETS
(amounts in thousands)
December 31, 2024
December 31, 2023
ASSETS
Current Assets
Cash and cash equivalents
$ 131,339
$ 119,737
Accounts receivable, net
716,415
697,178
Expenditures billable to clients
173,194
114,097
Other current assets
114,200
94,054
Total Current Assets
1,135,148
1,025,066
Fixed assets, net
72,706
77,825
Right-of-use assets – operating leases
219,400
254,278
Goodwill
1,554,146
1,498,815
Other intangible assets, net
836,783
818,220
Other assets
90,038
92,843
Total Assets
$ 3,908,221
$ 3,767,047
LIABILITIES, REDEEMABLE NONCONTROLLING INTERESTS (“RNCI”), AND SHAREHOLDERS’ EQUITY
Current Liabilities
Accounts payable
$ 449,347
$ 414,980
Accrued media
245,883
291,777
Accruals and other liabilities
265,356
233,046
Advance billings
294,609
301,674
Current portion of lease liabilities – operating leases
60,195
65,899
Current portion of deferred acquisition consideration
51,906
66,953
Total Current Liabilities
1,367,296
1,374,329
Long-term debt
1,353,624
1,145,828
Long-term portion of deferred acquisition consideration
50,209
34,105
Long-term lease liabilities – operating leases
245,397
281,307
Deferred tax liabilities, net
47,239
40,509
Other liabilities
59,139
54,905
Total Liabilities
3,122,904
2,930,983
Redeemable Noncontrolling Interests
8,412
10,792
Commitments, Contingencies and Guarantees
Shareholders’ Equity
Common shares – Class A & B
115
118
Common shares – Class C
2
2
Paid-in capital
343,647
348,494
Retained earnings
11,740
21,148
Accumulated other comprehensive loss
(23,773)
(13,067)
Stagwell Inc. Shareholders’ Equity
331,731
356,695
Noncontrolling interests
445,174
468,577
Total Shareholders’ Equity
776,905
825,272
Total Liabilities, Redeemable Noncontrolling Interests and Shareholders’ Equity
$ 3,908,221
$ 3,767,047
SCHEDULE 12
STAGWELL INC.
UNAUDITED SUMMARY CASH FLOW DATA
(amounts in thousands)
Year Ended December 31,
2024
2023
Cash flows from operating activities:
Net income
$ 25,044
$ 41,642
Adjustments to reconcile net income to cash provided by operating activities:
Stock-based compensation
52,161
57,179
Depreciation and amortization
151,652
142,831
Amortization of right-of-use lease assets and lease liability interest
75,117
76,653
Impairment and other losses
1,715
11,395
Deferred income taxes
(10,686)
19,443
Adjustment to deferred acquisition consideration
23,005
13,060
Gain on sale of business
—
(94,505)
Other, net
7,622
8,313
Changes in working capital:
Accounts receivable
8,465
(58,704)
Expenditures billable to clients
(54,350)
(21,477)
Other assets
(6,200)
1,153
Accounts payable
24,438
52,837
Accrued expenses and other liabilities
(28,658)
(24,647)
Advance billings
(22,651)
(41,137)
Current portion of lease liabilities – operating leases
(83,905)
(87,629)
Deferred acquisition related payments
(19,910)
(15,400)
Net cash provided by operating activities
142,859
81,007
Cash flows from investing activities:
Capital expenditures
(18,912)
(14,238)
Acquisitions, net of cash acquired
(103,254)
(23,339)
Capitalized software
(35,094)
(28,175)
Proceeds from sale of business, net
—
229,484
Other
(5,212)
(7,781)
Net cash (used in) provided by investing activities
(162,472)
155,951
Cash flows from financing activities:
Repayment of borrowings under revolving credit facility
(1,755,000)
(1,986,500)
Proceeds from borrowings under revolving credit facility
1,960,000
1,945,500
Shares repurchased and cancelled
(108,249)
(223,835)
Distributions to noncontrolling interests
(26,723)
(24,964)
Payment of deferred consideration
(29,774)
(49,221)
Purchase of noncontrolling interest
(3,316)
—
Debt issuance costs
—
(844)
Net cash provided by (used in) financing activities
36,938
(339,864)
Effect of exchange rate changes on cash and cash equivalents
(5,723)
2,054
Net increase (decrease) in cash and cash equivalents
11,602
(100,852)
Cash and cash equivalents at beginning of period
119,737
220,589
Cash and cash equivalents at end of period
$ 131,339
$ 119,737
View original content to download multimedia:https://www.prnewswire.com/news-releases/stagwell-inc-nasdaq-stgw-reports-results-for-the-three-and-twelve-months-ended-december-31-2024-302387320.html
SOURCE Stagwell Inc.

You may like
Technology
Singtel Receives Four Frost & Sullivan 2026 Recognitions for Leadership in Enterprise Connectivity, Cybersecurity, and Digital Transformation
Published
4 hours agoon
July 19, 2026By
The recognitions highlight Singtel’s leadership in secure connectivity, network transformation, IoT innovation, and cybersecurity, delivering customer value through intelligent digital infrastructure and AI-enabled enterprise services.
SAN ANTONIO, July 20, 2026 /CNW/ — Frost & Sullivan is pleased to honor Singtel with the 2026 Southeast Asia IoT Connectivity Service Provider Company of the Year, 2026 Singapore Network Transformation Customer Value Leadership, 2026 Singapore Cybersecurity Services Company of the Year, and 2026 Singapore SD-WAN and SASE Service Provider Company of the Year recognitions. These acknowledgements reflect Singtel’s outstanding achievements in delivering secure, intelligent, and scalable digital infrastructure that enables enterprises to modernize operations, simplify complexity, and accelerate digital transformation across Singapore and Southeast Asia. They underscore the company’s consistent leadership in strategy execution, customer value creation, and innovation across enterprise connectivity, cybersecurity, software-defined networking, and IoT connectivity services.
Frost & Sullivan evaluates companies through a rigorous benchmarking process across two core dimensions: strategy effectiveness and strategy execution. Singtel excelled in both, demonstrating its ability to anticipate evolving enterprise requirements while consistently translating long-term vision into measurable customer outcomes. Through platforms such as Singtel CUBΣ (CUBE) and its multidomestic IoT connectivity architecture, the company continues to unify networking, cybersecurity, automation, and AI-driven intelligence into integrated solutions that address the growing complexity of hybrid, multicloud, and connected environments. “Singtel has established itself as a benchmark for enterprise digital infrastructure by converging connectivity, cybersecurity, network intelligence, and IoT orchestration into a unified, customer-centric ecosystem. Its disciplined execution, platform-led innovation, and commitment to simplifying complex enterprise environments continue to strengthen operational resilience and deliver sustained value for organizations across the region,” said Kenny Yeo, Director at Frost & Sullivan.
Guided by a long-term strategy focused on digital innovation, intelligent infrastructure, and customer-centric transformation, Singtel has moved well-beyond traditional telecommunications to a trusted technology partner for enterprises navigating increasingly connected and data-driven environments. Its strategic investments in AI-enabled operations, cloud-native platforms, secure connectivity, and ecosystem partnerships enable organizations to modernize critical infrastructure while maintaining the flexibility to support future business growth.
The company’s strategic agility and sustained investment in integrated digital platforms have enabled it to scale innovative services across local, regional, and global enterprise environments. Innovation remains central to Singtel’s approach through solutions including the CUBΣ connected intelligence platform, multidomestic IoT connectivity powered by eSIM orchestration, managed cybersecurity services, AI-driven network automation, and network-as-a-service capabilities. These solutions simplify network and security management, strengthen cyber resilience, improve operational visibility, and provide enterprises with scalable, secure, and high-performing connectivity across cloud, edge, IoT, and hybrid infrastructures.
By streamlining service delivery through intelligent automation, centralized orchestration, proactive monitoring, and flexible managed and co-managed service models, Singtel continues to help organizations reduce operational complexity while improving service reliability and business agility. Its ability to integrate best-of-breed technologies in a unified operational framework, combined with strong regional network ownership and localized expertise, enables customers to confidently scale digital initiatives while maintaining security, governance, and operational excellence.
Frost & Sullivan commends Singtel for setting a high standard in competitive strategy, execution, and customer value across multiple technology domains. By combining intelligent networking, secure digital infrastructure, AI-enabled operations, and cross-border IoT capabilities in an integrated platform strategy, the company is shaping the future of enterprise connectivity while helping organizations build resilient, future-ready digital ecosystems.
Each year, Frost & Sullivan presents its Company of the Year and Customer Value Leadership recognitions to organizations that demonstrate outstanding strategy development and implementation, resulting in measurable improvements in customer satisfaction, competitive positioning, and business performance. These recognitions honor forward-thinking companies that continuously raise industry standards through innovation, operational excellence, and long-term value creation.
Frost & Sullivan Best Practices Recognition
Frost & Sullivan’s Best Practices Recognitions honor companies across regional and global markets that exhibit exceptional achievement and consistent excellence in areas such as leadership, technological innovation, customer experience, and strategic product development. Each recognition is the result of a rigorous analytical process in which Frost & Sullivan industry experts benchmark performance through comprehensive interviews, deep-dive analysis, and extensive secondary research. The goal is to identify true best-in-class organizations that are driving transformative growth and setting new industry standards.
Contact us: Start the discussion.
Contact:
Tarini Singh
E: Tarini.Singh@frost.com
View original content:https://www.prnewswire.com/news-releases/singtel-receives-four-frost–sullivan-2026-recognitions-for-leadership-in-enterprise-connectivity-cybersecurity-and-digital-transformation-302829114.html
SOURCE Frost & Sullivan
Technology
Foreign entrepreneurs find business opportunities and a home in Yiwu
Published
4 hours agoon
July 19, 2026By
BEIJING, July 19, 2026 /PRNewswire/ — A report from People’s Daily:
Yiwu, a city in east China’s Zhejiang province, is neither a coastal hub nor a border town. Yet it has built a trade network that reaches across the globe. Today, the city is home to more than 10,000 foreign-invested businesses and around 38,000 foreign merchants who live and work there.
People’s Daily reporters recently visited Yiwu to meet foreign entrepreneurs who have built successful businesses and settled down in the city. They shared stories of growing alongside Yiwu and becoming part of its remarkable transformation.
“I wouldn’t be where I am today without Yiwu,” said Senegalese businessman Sourakhata Tirera, a sentiment he often expresses. He first came to Yiwu in 2003 to source hardware products and was immediately impressed by the Yiwu International Trade Market. He noted, “If you can’t find something here, it’s probably because you haven’t searched carefully enough.”
In 2007, Tirera opened a foreign trade agency in Yiwu. In 2012, leveraging Yiwu’s comprehensive foreign trade pilot reform project, he established a wholly foreign-owned trading company. Today, his company ships 200 to 300 containers every month, dealing in more than 1,000 product categories and providing one-stop sourcing services for clients across Africa.
“Everyone is fascinated by Yiwu because it’s a place full of opportunities. Things that once seemed impossible can become reality here,” Tirera told People’s Daily after he finished receiving a trade delegation from Gabon.
Yemeni businessman Maged Mohammed Ali Al-Huraibi came to Yiwu alone in 2008 to pursue his entrepreneurial dream and founded a cosmetics trading company. In 2024, Yiwu launched a one-stop entrepreneurship service for foreign talent, offering factory leasing, policy consultation, and talent recruitment. Seizing the opportunity, Al-Huraibi invested in a cosmetics factory early that year, successfully transitioning from trader to manufacturer.
“Yiwu made my entrepreneurial dream come true. Now I want to bring cosmetics made in Yiwu to even more countries and regions around the world,” Al-Huraibi said.
Yiwu’s success is not simply about gathering products. More importantly, it comes from the city’s ability to create what the market needs — pioneering new approaches where none exist and forging new paths through continuous exploration.
Nepalese businessman Khadka Raj Kumar first came to Yiwu in 2002. In 2011, Yiwu pioneered a dual-track system for representative offices and foreign-invested business entities, addressing challenges related to residency, employment and business operations for foreign entrepreneurs. The following year, Kumar established his own trading company in Yiwu and later bought a home there.
In 2013, Yiwu established China’s first people’s mediation committee dedicated to foreign-related disputes, inviting foreign businesspeople to serve as mediation processes. Kumar has served in this role since 2017 and has participated in resolving more than 150 foreign-related disputes.
“In Yiwu, we’re not outsiders — we’re part of the local community,” he said.
As Yiwu’s sixth-generation marketplace, the Yiwu Global Digital Trade Center marks the city’s transition from traditional trade to a digital trade ecosystem.
Pakistani businessman Sheikh Jamil, who has operated in Yiwu for 21 years, has witnessed this transformation firsthand. According to him, more and more business is now conducted online. With the help of AI, he can quickly generate product solutions tailored to different market demands. “I can do business with the whole world without leaving my office,” he said.
Yemeni businessman Hasan Mohammed entered Yiwu’s cosmetics business as a distributor a decade ago. In 2018, he registered his own cosmetics brand in Saudi Arabia. With its products registered in Saudi Arabia, manufactured in China and sold worldwide, his business model delivers both high-quality products and a strong competitive edge.
“Yiwu is more like an ecosystem where ideas can quickly become reality. It offers not only opportunities, but also the potential for continuous growth,” said Mohammed.
For Brazilian businesswoman Ana Garcia, Yiwu’s transformation from “Made in Yiwu” to “Created in Yiwu” has been fueled by broad support in branding, digital innovation and global expansion. She founded a business consultancy that helps overseas clients identify market opportunities and sourcing needs, connect with qualified suppliers, and manage every step of the supply chain — from product selection and quality inspection to logistics and customs clearance.
Yiwu belongs not only to China, but also to the world. Together with entrepreneurs from around the globe, the city will continue turning the impossible into the possible, further burnishing its reputation as the “world’s supermarket” and ensuring that products created in Yiwu benefit people in more countries.
View original content:https://www.prnewswire.com/apac/news-releases/foreign-entrepreneurs-find-business-opportunities-and-a-home-in-yiwu-302829158.html
SOURCE People’s Daily
Technology
New Datingsmatch Survey: 1 in 5 Users Say a Wink Led to a Conversation
Published
5 hours agoon
July 19, 2026By
New findings from a Datingsmatch.com user survey show that the smallest gestures are doing more of the communication work than most people realize.
GIBRALTAR, July 19, 2026 /PRNewswire-PRWeb/ — People tend to think about opening messages as the moment a conversation actually starts online. The carefully worded introduction, the line someone spent time writing and then rewrote. What the data from a recent Datingsmatch survey points to is something different: for a meaningful share of users, none of that is where things began. It began with a wink.
According to the survey, 1 in 5 users of Datingsmatch reported that a wink was what got a conversation going. One-fifth of respondents, spread across different age groups and usage habits, identified that a single small gesture as the moment something actually started between two people.
What the Datingsmatch Survey Found
The survey was conducted among 5,000 users of the Datingsmatch online communication platform in June 2026, with participants asked to voluntarily share their experiences. The aim was to get a clearer picture of how conversations tend to begin, what it is that people hesitate about, and what eventually prompts someone to go ahead and reach out.
The wink finding was among the more consistent findings from the responses. Among users who described a conversation they felt good about, a notable portion were able to trace it back to a wink being sent first, whether they had sent it or received it. The reverse situation, where someone sent a cold message with no prior signal of any kind, was something respondents described as harder on both sides of the exchange.
That tracks with what broader research also points to. A 2023 Pew Research Center survey found that 55% of online daters felt insecure about the number of messages they received, and 36% felt overwhelmed by incoming contact. What that suggests is not that people don’t want to connect — it’s that the way contact gets initiated matters a great deal for how it lands.
Why Small Signals Carry More Weight Than They Seem
The Datingsmatch survey also looked at what stops people from reaching out when they want to. Uncertainty came up repeatedly. Not knowing whether someone is open to hearing from you. Not wanting to guess wrong and feel like you’ve overstepped.
What respondents described is not a lack of interest in connecting. It’s the absence of a clear enough signal that the other person is open to it. A Datingsmatch wink feature provides exactly that. It’s visible, unambiguous, and low-commitment enough that neither person has to feel exposed by it. For those still finding their footing on the platform, the beginner’s guide to the Datingsmatch platform walks through how these features work and how to use them effectively.
This connects to a 2024 study published in the journal Cyberpsychology, Behavior, and Social Networking that examined online rejection: ghosting was the most common form of rejection in digital communication, even after substantial prior exchanges. The fear that a message will simply be ignored — without any acknowledgment — is a real barrier. A lower-stakes signal reduces that barrier because the cost of no response feels smaller.
Datingsmatch notes, based on what survey participants shared, that this kind of low-friction signal seems to work differently than most people expect. It doesn’t just start conversations. It seems to reduce the gap that many users described feeling between “I want to reach out” and “I actually did.”
How People Actually Use the Wink Feature on Datingsmatch
Survey responses offered a more specific picture of the behavior. Winks were not being used randomly or as a form of mass outreach. Respondents described using them deliberately, on users they had spent time looking at, toward people they were genuinely interested in but not yet sure about approaching with a message.
Some users described sending a wink as a way of checking whether there was any openness to further contact, without having to commit to a full message exchange in order to find out. Others who had been on the receiving end of a wink said it was something they found easier to respond to, in part because it did not feel like it was asking too much of them too soon. There were also respondents who noted that when a wink had gone back and forth between two people, the first actual message felt less like an approach out of nowhere and more like a natural continuation of something that had already started.
Datingsmatch customer service regularly hears from users that knowing how to start a conversation is one of the things people think about most when they first join the platform. The survey data puts some numbers to what those conversations have long suggested.
What This Means for How the Platform Thinks About Connection
Datingsmatch highlights that findings like these shape how the platform continues to think about the role of small, low-pressure interactions in the overall experience. A conversation that begins with a wink is not a lesser conversation. Survey respondents who traced their most valued exchanges back to a wink described those conversations in consistently positive terms.
The platform sees value in giving users multiple ways to signal interest at different levels of commitment. A message is a commitment. A wink is an invitation. Both have a place, and the data suggests that for a meaningful portion of users, the invitation comes first and matters more than it might look like from the outside.
About Datingsmatch
Datingsmatch is an online communication platform that gives people a range of ways to connect online. The platform is built around the idea that how a conversation starts shapes everything that follows, and that not every interaction needs to begin with a message. Datingsmatch operates globally and continues to develop its communication tools based on how users actually engage with each other.
Media Contact
Elizabeth Fielden, Datingsmatch, 1 5869132511, review@datingsmatch.com, https://datingsmatch.com/
View original content:https://www.prweb.com/releases/new-datingsmatch-survey-1-in-5-users-say-a-wink-led-to-a-conversation-302828676.html
SOURCE Datingsmatch


Saylor turns up heat with ‘110 reasons’ why BIP-110 is a bad idea
Singtel Receives Four Frost & Sullivan 2026 Recognitions for Leadership in Enterprise Connectivity, Cybersecurity, and Digital Transformation
Foreign entrepreneurs find business opportunities and a home in Yiwu
Send Rakhi to UK swiftly with UK Gifts Portal

Whiteboard Series with NEAR | Ep: 45 Joel Thorstensson from ceramic.network

New Gooseneck Omni Antennas Offer Enhanced Signals in a Durable Package

Why You Should Build on #NEAR – Co-founder Illia Polosukhin at CV Labs
Whiteboard Series with NEAR | Ep: 45 Joel Thorstensson from ceramic.network

NEAR End of Year Town Hall 2021: The Open Web World, MetaBUILD 2 Hackathon and 2021 recap
Trending
-

 Coin Market4 days ago
Ostium pauses trading as security firms report multimillion-dollar oracle exploit
-

 Coin Market4 days ago
Revolut receives in-principle approval from UAE authorities for crypto services
-

 Technology4 days ago
GPU.ai Named Official Title Sponsor of AGI Summit SF 2026
-

 Coin Market4 days ago
Aave launches V4 on Avalanche, laying groundwork for tokenized credit markets
-

 Technology4 days ago
InventHelp Inventor Develops Improved Food Delivery Bag (LBT-9719)
-

 Coin Market4 days ago
Crypto firms face AML risks during post-MiCA migration, says AMLA chair
-

 Coin Market4 days ago
US Senator blasts AG pick for ‘dismantling’ crypto unit, Trump’s CZ pardon
-

 Near Videos4 days ago
The best AI agents need your most sensitive data