Reported strongest topline in the history of the company, Q2 2024 revenue was $31.3M, up 318% from Q1Wholesaled 72 hydrogen fuel cell electric vehicles in Q2, exceeding the high-end of guidance, up 80% from Q1Created alternative revenue streams with our initial sale of regulatory creditsBEV “2.0” recall program on track for completion by year-end 2024
PHOENIX, Aug. 9, 2024 /PRNewswire/ — Nikola Corporation (Nasdaq: NKLA), a global leader in zero-emissions transportation and energy supply and infrastructure solutions, via the HYLA brand, today reported financial results and business updates for the quarter ended June 30, 2024.
“In the last three quarters of serial production, we have demonstrated that Nikola is the offtake. We are the catalyst to disrupt Class 8 trucking to make zero-emission a reality,” said Steve Girsky, President and CEO of Nikola. “We are the only OEM with Class 8 FCEVs commercially available in North America today. Our trucks are put to the test every day by end fleet users, hauling freight and delivering to their customers. Q2 is an example of how we’re approaching the intersection of mission and reality and how Nikola is out front, charting the course.”
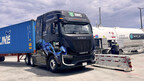
Hydrogen Fuel Cell Electric Truck
In Q2, we exceeded the high-end of the guidance range by delivering 72 hydrogen fuel cell electric vehicles (FCEVs) to our dealer network. That makes 147 wholesaled FCEVs in the first three quarters of serial production. Last quarter, we talked about the importance of expanding our reach to meet the demands of end fleet users virtually anywhere in North America. Walmart Canada is the first major retailer in Canada to introduce a hydrogen fuel cell electric semi-truck to its fleet. We also received repeat orders from two national accounts. Nikola’s Profitability Flywheel is beginning to gain momentum with these national accounts, as each of these end fleets grows its zero-emission presence to achieve decarbonization goals.
We continue to delight fleet users with data-driven quality and performance. To date, our FCEV end fleets have traveled more than 550K miles with an average fuel economy of 7.2 mi/kg, validating our performance benchmark. We collect field data every day and the numbers bear out. On a converted basis, our FCEVs outperformed the average Class 8 truck on fuel economy and avoidance of tailpipe emissions. We estimate the average miles per gallon (mpg) diesel equivalent of our FCEV is 8.0, or 23% better, than the Class 8 fuel economy average of 6.5/diesel gallon equivalent (DGE) per the Department of Energy. Moreover, in-service FCEVs have consumed more than 77 metric tons of hydrogen dispensed at various Nikola fueling solutions. In total, we estimate our FCEV end fleet operations have avoided approximately 867 metric tons of CO2 tailpipe emissions.*
HYLA Energy
We’re delivering HYLA fueling solutions to support volume ramp up. As a strategy, we are launching stations and deploying assets where we anticipate demand. It is our objective to stay ahead of FCEV deployment so that fueling solutions are ready and available for end fleets. To that end, since the Q1 earnings call, we opened a HYLA branded station in Toronto, Ontario, Canada and completed commissioning a modular station in Santa Fe Springs in Southern Calif. We also added another modular refueler at our Ontario, Calif. station, doubling capacity. We recently had a record day in Ontario, with 28 FCEVs refueled and more than 850kg of hydrogen dispensed in one day. Likewise, through our work with Shell, our fleet customers have been able to fuel at Shell’s heavy-duty station in Ontario, CA, where density has been growing. Our stations run 24/7 to support the around-the-clock operations of our fleet users.
Constructive Green Policies
We continued to maintain our dominant share of HVIP vouchers in Calif. At quarter-end, we had 99% of FCEV and 23% of battery-electric vehicle (BEV) HVIP vouchers. We also created alternative revenue streams from the sale of regulatory credits. We recognized our first sale agreement of NOx and PM credits in the quarter. We expect this revenue stream to grow as volume increases each model year.
Battery-Electric Truck
We continued to make progress returning BEVs to our dealer network and end fleet users. We remain on track to complete the recall program by year-end 2024. Feedback on returned units has been overwhelmingly positive and over-the-air updates continue to reach customers.
Second Quarter Financial Highlights
Three Months Ended
June 30,
Six Months Ended
June 30,
(In thousands, except share and per share data)
2024
2023
2024
2023
Trucks produced
77
33
120
96
Trucks shipped
73
45
113
76
Total revenues
$ 31,319
$ 15,362
$ 38,816
$ 26,039
Gross profit (loss)
$ (54,726)
$ (27,631)
$ (112,301)
$ (50,328)
Gross margin
(175) %
(180) %
(289) %
(193) %
Loss from operations
$ (131,124)
$ (168,626)
$ (276,487)
$ (295,826)
Net loss from continuing operations
$ (133,674)
$ (140,010)
$ (281,396)
$ (285,261)
Net loss on discontinued operations
$ —
$ (77,818)
$ —
$ (101,661)
Net loss
$ (133,674)
$ (217,828)
$ (281,396)
$ (386,922)
Adjusted EBITDA (1)
$ (109,396)
$ (125,068)
$ (213,427)
$ (228,756)
Net loss from continuing operations per share, basic and diluted
$ (2.86)
$ (5.93)
$ (6.17)
$ (13.59)
Net loss from discontinued operations
$ —
$ (3.29)
$ —
$ (4.85)
Non-GAAP net loss per share, basic and diluted(1)
$ (2.67)
$ (5.90)
$ (5.29)
$ (12.35)
Weighted-average shares outstanding, basic and diluted
46,699,945
23,623,094
45,614,635
20,987,679
(1) A reconciliation of the non-GAAP versus GAAP information is provided below in the financial statement tables in this press release.
Webcast and Conference Call Information
Nikola will host a webcast to discuss its second quarter results and business progress at 7:30 a.m. Pacific Time (10:30 a.m. Eastern Time) on August 9, 2024. To access the webcast, parties in the United States should follow this link.
The live audio webcast, along with supplemental information, will be accessible on the Company’s Investor Relations website here. A recording of the webcast will also be available following the earnings call.
*Average emissions avoidance estimate based on total end fleet odometer mileage, avg. 6.5 mi/diesel gallon equivalent fuel economy of Class 8 trucks (per DOE), and the mobile combustion emission factor of 10.21 kg CO2 per gallon of diesel fuel (per EPA).
About Nikola Corporation
Nikola Corporation’s mission is clear: pioneering solutions for a zero-emissions world. As an integrated truck and energy company, Nikola is transforming commercial transportation, with our Class 8 vehicles, including battery-electric and hydrogen fuel cell electric trucks, and our energy brand, HYLA, driving the advancement of the complete hydrogen refueling ecosystem, covering supply, distribution and dispensing.
Nikola headquarters is based in Phoenix, Ariz. with a manufacturing facility in Coolidge, Ariz.
Experience our journey to achieve your sustainability goals at nikolamotor.com or engage with us on social media via Facebook @nikolamotorcompany, Instagram @nikolamotorcompany, YouTube @nikolamotorcompany, LinkedIn @nikolamotorcompany or X / Twitter @nikolamotor
Forward-Looking Statements
This press release contains certain forward-looking statements within the meaning of federal securities laws with respect to Nikola Corporation (the “Company”), including statements relating to: the Company’s future financial and business performance, business plan, strategy, focus, opportunities and milestones; the benefits and momentum in the Company’s profitability flywheel; customer demand for trucks; the Company’s beliefs regarding its competition and competitive position; the Company’s business outlook; the Company’s expectations regarding hydrogen refueling solutions and timelines; expectations related to the battery-electric truck recall, including timing of battery replacement and truck deliveries and sales; the Company’s beliefs regarding the benefits and attributes of its trucks, and customer experience; estimated average mileage per gallon diesel equivalent; estimated avoidance of tailpipe emissions; and government incentives including CARB credits and expectations regarding related revenue. These forward-looking statements other than statements of historical fact, and generally are identified by words such as “believe,” “project,” “expect,” “anticipate,” “estimate,” “intend,” “strategy,” “future,” “opportunity,” “plan,” “may,” “should,” “will,” “would,” and similar expressions. Forward-looking statements are predictions, projections, and other statements about future events based on current expectations and assumptions and, as a result, are subject to risks and uncertainties. Many factors could cause actual future events to differ materially from the forward-looking statements in this press release, including but not limited to: successful execution of the Company’s business plan; design and manufacturing changes and delays, including shortages of parts and materials and other supply challenges; general economic, financial, legal, regulatory, political and business conditions and changes in domestic and foreign markets; demand for and customer acceptance of the Company’s trucks and hydrogen refueling solutions; the results of customer pilot testing; the execution and terms of definitive agreements with strategic partners and customers; the failure to convert LOIs or MOUs into binding orders; the cancellation of orders; risks associated with development and testing of fuel cell power modules and hydrogen storage systems; risks related to the recall, including higher than expected costs, the discovery of additional problems, delays retrofitting the trucks and delivering such trucks to customers, supply chain and other issues that may create additional delays, order cancellations as a result of the recall, litigation, complaints and/or product liability claims, and reputational harm; risks related to the rollout of the Company’s business and milestones and the timing of expected business milestones; actual driving conditions and other factors that affect vehicle range; changes in methodology, inputs, assumptions or other factors used to estimate average mileage per gallon diesel equivalent or avoidance of tailpipe emissions; the effects of competition on the Company’s business; the Company’s capital needs ability to raise capital; the Company’s ability to achieve cost reductions and decrease its cash usage; the grant, receipt and continued availability of federal and state incentives; and the factors, risks and uncertainties regarding the Company’s business described in the “Risk Factors” section of the Company’s Quarterly Report on Form 10-Q, for the quarter ended March 31, 2024 filed with the SEC, in addition to the Company’s subsequent filings with the SEC. These filings identify and address other important risks and uncertainties that could cause the Company’s actual events and results to differ materially from those contained in the forward-looking statements. Forward-looking statements speak only as of the date they are made. Readers are cautioned not to put undue reliance on forward-looking statements, and, except as required by law, the Company assumes no obligation and does not intend to update or revise these forward-looking statements, whether as a result of new information, future events, or otherwise.
Use of Non-GAAP Financial Measures
This press release references Adjusted EBITDA and non-GAAP net loss per share, basic and diluted, all of which are non-GAAP financial measures and are presented as supplemental measures of the Company’s performance. The Company defines Adjusted EBITDA as earnings before interest expense, taxes, depreciation and amortization, stock-based compensation expense, and certain other items determined by the Company. Non-GAAP net loss is defined as net loss adjusted for stock-based compensation expense and certain other items determined by the Company. Non-GAAP net loss per share, basic and diluted is defined as non-GAAP net loss divided by weighted average basic and diluted shares outstanding. These non-GAAP measures are not substitutes for or superior to measures of financial performance prepared in accordance with generally accepted accounting principles in the United States (GAAP) and should not be considered as an alternative to any other performance measures derived in accordance with GAAP.
The Company believes that presenting these non-GAAP measures provides useful supplemental information to investors about the Company in understanding and evaluating its operating results, enhancing the overall understanding of its past performance and future prospects, and allowing for greater transparency with respect to key financial metrics used by its management in financial and operational-decision making. However, there are a number of limitations related to the use of non-GAAP measures and their nearest GAAP equivalents. For example, other companies may calculate non-GAAP measures differently or may use other measures to calculate their financial performance, and therefore any non-GAAP measures the Company uses may not be directly comparable to similarly titled measures of other companies.
CONDENSED CONSOLIDATED STATEMENTS OF OPERATIONS
(In thousands, except share and per share data)
(Unaudited)
Three Months Ended
June 30,
Six Months Ended
June 30,
2024
2023
2024
2023
Revenues:
Truck sales
$ 28,743
$ 12,006
$ 36,161
$ 22,061
Service and other
2,576
3,356
2,655
3,978
Total revenues
31,319
15,362
38,816
26,039
Cost of revenues:
Truck sales
78,994
40,203
140,741
73,223
Service and other
7,051
2,790
10,376
3,144
Total cost of revenues
86,045
42,993
151,117
76,367
Gross loss
(54,726)
(27,631)
(112,301)
(50,328)
Operating expenses:
Research and development (1)
40,161
64,514
79,658
126,320
Selling, general, and administrative (1)
36,237
58,764
84,528
101,461
Loss on supplier deposits
—
17,717
—
17,717
Total operating expenses
76,398
140,995
164,186
245,498
Loss from operations
(131,124)
(168,626)
(276,487)
(295,826)
Other income (expense):
Interest expense, net
(3,941)
(8,749)
(6,219)
(18,582)
Gain on divestiture of affiliate
—
70,849
—
70,849
Loss on debt extinguishment
(1,529)
(20,362)
(2,313)
(20,362)
Other income (expense), net
3,893
(5,505)
4,753
(5,315)
Loss before income taxes and equity in net loss of affiliates
(132,701)
(132,393)
(280,266)
(269,236)
Income tax expense
92
—
92
—
Loss before equity in net loss of affiliates
(132,793)
(132,393)
(280,358)
(269,236)
Equity in net loss of affiliates
(881)
(7,617)
(1,038)
(16,025)
Net loss from continuing operations
(133,674)
(140,010)
(281,396)
(285,261)
Discontinued operations:
Loss from discontinued operations
—
(52,883)
—
(76,726)
Loss from deconsolidation of discontinued operations
—
(24,935)
—
(24,935)
Net loss from discontinued operations
—
(77,818)
—
(101,661)
Net loss
$ (133,674)
$ (217,828)
$ (281,396)
$ (386,922)
Basic and diluted net loss per share (2):
Net loss from continuing operations
$ (2.86)
$ (5.93)
$ (6.17)
$ (13.59)
Net loss from discontinued operations
$ —
$ (3.29)
$ —
$ (4.85)
Net loss
$ (2.86)
$ (9.22)
$ (6.17)
$ (18.44)
Weighted-average shares outstanding, basic and diluted (2)
46,699,945
23,623,094
45,614,635
20,987,679
(1) Includes stock-based compensation as follows:
Three Months Ended June 30,
Six Months Ended June 30,
2024
2023
2024
2023
Cost of revenues
$ 352
$ 668
$ 680
$ 1,399
Research and development
2,493
6,574
5,352
15,660
Selling, general, and administrative
5,105
18,467
10,704
33,198
Total stock-based compensation expense
$ 7,950
$ 25,709
$ 16,736
$ 50,257
(2) Shares issued and outstanding have been adjusted to reflect the one-for-thirty (1-for-30) reverse stock split that became effective on June 24, 2024.
CONDENSED CONSOLIDATED BALANCE SHEETS
(In thousands, except share and per share data)
(Unaudited)
June 30,
December 31,
2024
2023
(Unaudited)
Assets
Current assets
Cash and cash equivalents
$ 256,330
$ 464,715
Restricted cash and cash equivalents
10,200
1,224
Accounts receivable, net
39,840
17,974
Inventory
62,134
62,588
Prepaid expenses and other current assets
61,599
25,911
Total current assets
430,103
572,412
Restricted cash and cash equivalents
16,086
28,026
Long-term deposits
8,887
14,954
Property, plant and equipment, net
494,023
503,416
Intangible assets, net
82,161
85,860
Investment in affiliate
56,024
57,062
Goodwill
5,238
5,238
Other assets
17,392
7,889
Total assets
$ 1,109,914
$ 1,274,857
Liabilities and stockholders’ equity
Current liabilities
Accounts payable
$ 55,559
$ 44,133
Accrued expenses and other current liabilities
213,980
207,022
Debt and finance lease liabilities, current
11,806
8,950
Total current liabilities
281,345
260,105
Long-term debt and finance lease liabilities, net of current portion
266,390
269,279
Operating lease liabilities
7,362
4,765
Other long-term liabilities
31,264
21,534
Total liabilities
586,361
555,683
Commitments and contingencies
Stockholders’ equity
Preferred stock
—
—
Common stock
5
4
Additional paid-in capital
3,876,034
3,790,401
Accumulated deficit
(3,352,465)
(3,071,069)
Accumulated other comprehensive loss
(21)
(162)
Total stockholders’ equity
523,553
719,174
Total liabilities and stockholders’ equity
$ 1,109,914
$ 1,274,857
CONDENSED CONSOLIDATED STATEMENTS OF CASH FLOWS
(In thousands)
(Unaudited)
Six Months Ended June 30,
2024
2023
Cash flows from operating activities
Net loss
$ (281,396)
$ (386,922)
Less: Loss from discontinued operations
—
(101,661)
Loss from continuing operations
(281,396)
(285,261)
Adjustments to reconcile net loss from continuing operations to net cash used in operating activities:
Depreciation and amortization
21,688
11,762
Stock-based compensation
16,736
50,257
Equity in net loss of affiliates
1,038
16,025
Revaluation of financial instruments
(2,147)
7,906
Revaluation of contingent stock consideration
—
(2,472)
Inventory write-downs
37,576
12,718
Non-cash interest expense
7,835
19,363
Loss on supplier deposits
—
17,717
Gain on divestiture of affiliate
—
(70,849)
Loss on debt extinguishment
2,313
20,362
Loss on disposal of assets
3,158
—
Other non-cash activity
3,680
1,015
Changes in operating assets and liabilities:
Accounts receivable, net
(21,866)
11,640
Inventory
(38,132)
11,725
Prepaid expenses and other current assets
(20,029)
(48,583)
Other assets
(962)
(2,041)
Accounts payable, accrued expenses and other current liabilities
6,234
(59,474)
Long-term deposits
(278)
(1,293)
Operating lease liabilities
(1,739)
(779)
Other long-term liabilities
16,135
3,097
Net cash used in operating activities
(250,156)
(287,165)
Cash flows from investing activities
Purchases and deposits of property, plant and equipment
(30,182)
(87,719)
Proceeds from the sale of assets
21,398
—
Divestiture of affiliate
—
35,000
Payments to Assignee
—
(2,724)
Investments in affiliate
—
(84)
Net cash used in investing activities
(8,784)
(55,527)
Cash flows from financing activities
Proceeds from the exercise of stock options
—
1,040
Proceeds from issuance of shares under the Tumim Purchase Agreements
—
67,587
Proceeds from registered direct offering, net of underwriter’s discount
—
63,806
Proceeds from public offering, net of underwriter’s discount
—
32,244
Proceeds from issuance of common stock under Equity Distribution Agreement, net of commissions and other fees paid
52,201
61,565
Proceeds from issuance of convertible notes, net of discount and issuance costs
—
52,075
Proceeds from issuance of financing obligation, net of issuance costs
—
49,605
Proceeds from insurance premium financing
4,598
3,909
Repayment of debt and promissory notes
(261)
(5,057)
Payment for Coupon Make-Whole Premium
(4,530)
—
Payments on insurance premium financing
(1,853)
(2,381)
Payments on finance lease liabilities and financing obligation
(2,564)
(255)
Net cash provided by financing activities
47,591
324,138
Net decrease in cash and cash equivalents, including restricted cash and cash equivalents
(211,349)
(18,554)
Cash and cash equivalents, including restricted cash and cash equivalents, beginning of period
493,965
313,909
Cash and cash equivalents, including restricted cash and cash equivalents, end of period
$ 282,616
$ 295,355
Cash flows from discontinued operations:
Operating activities
$ —
$ (4,964)
Investing activities
—
(1,804)
Financing activities
—
(572)
Net cash used in discontinued operations
$ —
$ (7,340)
Reconciliation of GAAP Financial Metrics to Non-GAAP
(In thousands, except share and per share data)
(Unaudited)
Reconciliation of Net Loss from continuing operations to EBITDA and Adjusted EBITDA
Three Months Ended June 30,
Six Months Ended June 30,
2024
2023
2024
2023
(in thousands)
Net loss from continuing operations
$ (133,674)
$ (140,010)
$ (281,396)
$ (285,261)
Interest expense, net
3,941
8,749
6,219
18,582
Income tax expense
92
—
92
—
Depreciation and amortization
11,092
5,524
21,688
11,762
EBITDA
(118,549)
(125,737)
(253,397)
(254,917)
Stock-based compensation
7,950
25,709
16,736
50,257
Loss on supplier deposits
—
17,717
—
17,717
Gain on divestiture of affiliate
—
(70,849)
—
(70,849)
Loss on debt extinguishment
1,529
20,362
2,313
20,362
Loss on disposal of assets
470
—
3,158
—
Equipment purchase cancellation
—
—
15,613
—
Revaluation of financial instruments
(2,972)
5,633
(2,147)
5,434
Regulatory and legal matters (1)
2,176
2,097
4,297
3,240
Adjusted EBITDA
$ (109,396)
$ (125,068)
$ (213,427)
$ (228,756)
(1) Regulatory and legal matters include legal, advisory, and other professional service fees incurred in connection with a short-seller article from September 2020, and investigations and litigation related thereto.
Reconciliation of GAAP to Non-GAAP Net Loss, and GAAP to Non-GAAP Net Loss per Share, basic and diluted
Three Months Ended June 30,
Six Months Ended June 30,
2024
2023
2024
2023
(in thousands, except share and per share data)
Net loss from continuing operations
$ (133,674)
$ (140,010)
$ (281,396)
$ (285,261)
Stock-based compensation
7,950
25,709
16,736
50,257
Loss on supplier deposits
—
17,717
—
17,717
Gain on divestiture of affiliate
—
(70,849)
—
(70,849)
Loss on debt extinguishment
1,529
20,362
2,313
20,362
Revaluation of financial instruments
(2,972)
5,633
(2,147)
5,434
Loss on disposal of assets
470
—
3,158
—
Equipment purchase cancellation
—
—
15,613
—
Regulatory and legal matters (1)
2,176
2,097
4,297
3,240
Non-GAAP net loss
$ (124,521)
$ (139,341)
$ (241,426)
$ (259,100)
Net loss from continuing operations per share, basic and diluted (2)
$ (2.86)
$ (5.93)
$ (6.17)
$ (13.59)
Non-GAAP net loss per share, basic and diluted
$ (2.67)
$ (5.90)
$ (5.29)
$ (12.35)
Weighted average shares outstanding, basic and diluted (2)
46,699,945
23,623,094
45,614,635
20,987,679
(1) Regulatory and legal matters include legal, advisory, and other professional service fees incurred in connection with a short-seller article from September 2020, and investigations and litigation related thereto.
(2) Shares issued and outstanding have been adjusted to reflect the one-for-thirty (1-for-30) reverse stock split that became effective on June 24, 2024.
Reconciliation of Cash flows to Adjusted Free Cash Flow
Three Months Ended June 30,
Six Months Ended June 30,
2024
2023
2024
2023
(in thousands)
Most comparable GAAP measure:
Net cash used in operating activities
$ (134,553)
$ (111,143)
$ (250,156)
$ (287,165)
Net cash used in investing activities
(13,724)
(5,010)
(8,784)
(55,527)
Net cash provided by financing activities
52,646
208,222
47,591
324,138
Non-GAAP measure:
Net cash used for operating activities
(134,553)
(111,143)
(250,156)
(287,165)
Purchases of property, plant and equipment
(13,724)
(37,202)
(30,182)
(87,719)
Adjusted free cash flow
$ (148,277)
$ (148,345)
$ (280,338)
$ (374,884)
View original content to download multimedia:https://www.prnewswire.com/news-releases/nikola-corporation-reports-second-quarter-2024-results-302218731.html
SOURCE Nikola Corporation









 Technology5 days ago
 Technology5 days ago
 Coin Market4 days ago
 Coin Market4 days ago
 Technology4 days ago
 Technology4 days ago
 Technology4 days ago