Connect with us

Technology

Automation Solutions for Renewable Power Generation Market expected to grow by USD 3.15 Billion from 2024-2028 driven by AI-powered advancements and supportive renewable policies – Technavio

Published

on

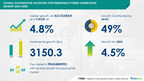
NEW YORK, Oct. 14, 2024 /PRNewswire/ — Report on how AI is driving market transformation – The Global Automation Solutions for Renewable Power Generation Market size is estimated to grow by USD 3.15 billion from 2024-2028, according to Technavio. The market is estimated to grow at a CAGR of 4.8% during the forecast period. aggressive policies supporting growth of renewable power generation is driving market growth, with a trend towards inception of new business models of automation solutions. However, cost challenges due to retrofitting automation solutions in conventional devices and machines poses a challenge – Key market players include ABB Ltd., Beckhoff Automation, Bosch Rexroth AG, Delta Electronics Inc., Eaton Corp plc, Emerson Electric Co., Fuji Electric Co. Ltd., GE Grid Solutions, Hitachi Energy Ltd., Honeywell International Inc., Intel Corp., Mitsubishi Electric Corp., OMRON Corp., Pilz GmbH and Co. KG, Rockwell Automation Inc., Schneider Electric SE, Siemens AG, Tata Power Co. Ltd., Toshiba Corp., and Yokogawa Electric Corp..

Key insights into market evolution with AI-powered analysis. Explore trends, segmentation, and growth drivers- View the snapshot of this report

Automation Solutions For Renewable Power Generation Market Scope

Report Coverage

Details

Base year

2023

Historic period

2018 – 2022

Forecast period

2024-2028

Growth momentum & CAGR

Accelerate at a CAGR of 4.8%

Market growth 2024-2028

USD 3150.3 million

Market structure

Fragmented

YoY growth 2022-2023 (%)

4.5

Regional analysis

APAC, North America, Europe, Middle East and Africa, and South America

Performing market contribution

APAC at 49%

Key countries

US, China, India, Germany, and Japan

Key companies profiled

ABB Ltd., Beckhoff Automation, Bosch Rexroth AG, Delta Electronics Inc., Eaton Corp plc, Emerson Electric Co., Fuji Electric Co. Ltd., GE Grid Solutions, Hitachi Energy Ltd., Honeywell International Inc., Intel Corp., Mitsubishi Electric Corp., OMRON Corp., Pilz GmbH and Co. KG, Rockwell Automation Inc., Schneider Electric SE, Siemens AG, Tata Power Co. Ltd., Toshiba Corp., and Yokogawa Electric Corp.

Market Driver

The Automation Solutions for Renewable Power Generation market is witnessing a significant trend with the emergence of Energy as a Service (EaaS) business models. EaaS enables customers to access energy solutions through subscription-based services, reducing the need for substantial upfront investments. This model allows businesses to outsource energy management, including installation and maintenance of renewable technologies. Advanced technologies like smart meters and IoT devices are integrated, enhancing operational efficiency and real-time energy consumption monitoring. EaaS also facilitates decentralized energy systems, enabling peer-to-peer energy trading and optimizing energy usage. As sustainability becomes a priority, EaaS provides flexible, scalable solutions that align with environmental objectives. This shift democratizes access to renewable energy and fosters innovation in energy management practices across various sectors, driving market growth during the forecast period.

The global automation solution market for renewable power generation is on the rise, driven by the increasing adoption of clean energy sources such as solar farms, wind farms, hydroelectric operations, and biomass operations. Robotic automation and process automation are key trends in this sector, enabling operational efficiency and reducing costs. Renewable power plants, including solar PV installations, solar energy, wind energy, wind power, hydropower, and biomass, are leveraging Programmable Logic Controllers (PLCs), predictive analytics software, real-time data analytics, and predictive maintenance algorithms for intelligent control. Smart grid technologies, such as prepaid grid integration and demand response, are essential for managing variable energy sources from renewable power plants. The renewable sector, including solar, wind, hydro, and biomass, is focused on climate change mitigation, environmental sustainability, and subsidies. Artificial intelligence, machine learning, distributed energy resources, and cybersecurity measures, including micro grids and blockchain, are critical for managing renewable power generation assets and ensuring grid stability. Cybersecurity solutions are also crucial to protect against greenhouse gas emissions and safeguard against cyber threats. 

Request Sample of our comprehensive report now to stay ahead in the AI-driven market evolution!

Market Challenges

Automation solutions in renewable power generation offer numerous benefits, but integrating these systems into existing infrastructure involves substantial investment and effort. Companies must conduct a cost-benefit analysis before purchasing new automation systems, ensuring they are compatible with advanced solutions or can be retrofitted with smart devices. The proliferation of various automation devices necessitates a common operational framework for secure and effective communication. Failure to integrate systems may hinder market growth during the forecast period. Companies must carefully evaluate the compatibility and integration capabilities of potential automation solutions to maximize returns and minimize costs.In today’s business environment, the renewable power generation market faces numerous challenges, including meeting clean energy demands in the face of climate change and environmental sustainability. Subsidies for renewable sources are crucial, but operational efficiency is key to profitability. Variable energy sources like Solar PV and Wind Power require smart grid technologies, artificial intelligence, and machine learning for effective management. Distributed energy resources, micro grids, and blockchain offer solutions for energy market volatility. Cybersecurity measures are essential to protect against cyber threats. Renewable power plants, from Solar PV installations to Hydropower and Biomass, require asset management, process control, and remote monitoring for optimal performance. Next-generation digital technologies like AI and IoT solutions can help reduce downtime and improve asset performance. Government investment in renewable energy sectors is vital to meet global energy demand and reduce carbon footprint. Renewable energy generation from Renewable Energy Sectors like Solar Energy, Wind Energy, and Hydropower is crucial to combat greenhouse gases and power our world sustainably.

Discover how AI is revolutionizing market trends- Get your access now!

Segment Overview 

This automation solutions for renewable power generation market report extensively covers market segmentation by

End-user 1.1 Solar energy1.2 Wind energy1.3 OthersApplication 2.1 Asset management2.2 Process control2.3 Remote monitoring2.4 OthersGeography 3.1 APAC3.2 North America3.3 Europe3.4 Middle East and Africa3.5 South America

1.1 Solar energy- Automation plays a crucial role in optimizing the performance of solar power plants by addressing the challenges of controlling complex systems. Advanced algorithms are essential due to the difficulty of managing solar power plant systems with conventional control solutions. Automation solutions in solar power plants perform several functions, including calculating solar reflector positions, self-calibration and prediction of reflectors, and computing sun and normal vectors. These systems also help reduce structural and mechanical errors, monitor and analyze solar PV plant performance, and ensure high performance, reduced downtime, and fault detection. ABB Ltd, a major player in the market, recently achieved a milestone of delivering automation to 5-GW solar power plants in India, highlighting the growing demand for these solutions. The market is expected to grow due to factors such as the need for efficient and productive solar power plants, increasing adoption of renewable energy, and the scalability and distributed architecture of automation solutions.

Download a Sample of our comprehensive report today to discover how AI-driven innovations are reshaping competitive dynamics

Research Analysis

The global automation solutions market for renewable power generation is a rapidly growing sector, driven by the increasing adoption of renewable sources for power production. Automation plays a crucial role in optimizing the performance and efficiency of renewable power plants, including solar farms, wind farms, hydroelectric operations, and biomass operations. Robotic automation and process automation are key technologies used to streamline operations and reduce costs. Distributed Control Systems (DCS) and Programmable Logic Controllers (PLC) are essential components of renewable power plant automation, enabling real-time process control and monitoring. Predictive analytics software helps optimize performance, reduce downtime, and minimize greenhouse gas emissions. Renewable power plants, including solar PV installations, solar energy, wind energy, wind power, hydropower, and biomass, all benefit from automation solutions. Asset management and process control systems, along with remote monitoring capabilities, ensure optimal performance and reliability in the renewable sector. The renewable energy sector continues to evolve, with automation solutions playing a vital role in maximizing the potential of renewable power plants and reducing their carbon footprint.

Market Research Overview

The global automation solutions market for renewable power generation is a rapidly growing sector, driven by the increasing adoption of clean energy sources such as solar farms, wind farms, hydroelectric operations, and biomass operations in response to climate change and environmental sustainability initiatives. Renewable power generation faces unique challenges due to the variable nature of these energy sources, requiring advanced automation solutions. Robotic automation and process automation play crucial roles in optimizing renewable power generation, with Programmable Logic Controllers (PLCs) and Predictive analytics software enabling real-time data analytics and Predictive maintenance algorithms. Intelligent control algorithms, Prepaid grid integration, and Demand response systems help manage energy production and distribution efficiently. Renewable energy sectors, including Solar Power, Wind Power, Hydropower, and Biomass, are integrating Next-Generation Digital Technologies like Artificial Intelligence (AI), Machine Learning, and Internet of Things (IoT) Solutions to enhance operational efficiency and Asset Performance. Cybersecurity measures, Micro grids, Blockchain, and Cybersecurity solutions are essential to ensure grid security and reliability. Government investment, subsidies, and the energy market’s evolving landscape are key factors influencing the renewable sector’s growth. Renewable energy generation from Solar PV modules, Wind Turbines, and Biomass plants contributes significantly to reducing the global energy demand’s carbon footprint. As renewable energy sources become increasingly important, automation solutions will continue to play a pivotal role in ensuring their operational efficiency and reliability.

Table of Contents:

1 Executive Summary
2 Market Landscape
3 Market Sizing
4 Historic Market Size
5 Five Forces Analysis
6 Market Segmentation

End-userSolar EnergyWind EnergyOthersApplicationAsset ManagementProcess ControlRemote MonitoringOthersGeographyAPACNorth AmericaEuropeMiddle East And AfricaSouth America

7 Customer Landscape
8 Geographic Landscape
9 Drivers, Challenges, and Trends
10 Company Landscape
11 Company Analysis
12 Appendix

About Technavio

Technavio is a leading global technology research and advisory company. Their research and analysis focuses on emerging market trends and provides actionable insights to help businesses identify market opportunities and develop effective strategies to optimize their market positions.

With over 500 specialized analysts, Technavio’s report library consists of more than 17,000 reports and counting, covering 800 technologies, spanning across 50 countries. Their client base consists of enterprises of all sizes, including more than 100 Fortune 500 companies. This growing client base relies on Technavio’s comprehensive coverage, extensive research, and actionable market insights to identify opportunities in existing and potential markets and assess their competitive positions within changing market scenarios.

Contacts

Technavio Research
Jesse Maida
Media & Marketing Executive
US: +1 844 364 1100
UK: +44 203 893 3200
Email: media@technavio.com
Website: www.technavio.com/

View original content to download multimedia:https://www.prnewswire.com/news-releases/automation-solutions-for-renewable-power-generation-market-expected-to-grow-by-usd-3-15-billion-from-2024-2028-driven-by-ai-powered-advancements-and-supportive-renewable-policies—technavio-302274749.html

SOURCE Technavio

Continue Reading
Click to comment

Leave a Reply

Your email address will not be published. Required fields are marked *

Technology

Brightstar Lottery Delivers Enhanced Retail Central System to Lottotech in Mauritius

Published

on

By

Company extends its longtime relationship with the operator of the Mauritius National Lottery with new multi-year contract agreement

LONDON, May 12, 2026 /PRNewswire/ — Brightstar Lottery PLC (NYSE: BRSL) (“Brightstar”) announced today that its subsidiaries, Brightstar Global Solutions Corporation and Brightstar Lottery Cyprus Limited, have signed a multi-year contract extension with Lottotech, the operator of the Mauritius National Lottery. Brightstar will deploy an advanced lottery central system to unlock further benefits for Lottotech. Additionally, Brightstar will replace all lottery terminals with its latest hardware, the RetailerPro S2, which will feature Brightstar’s cutting-edge terminal application platform, OpenRetail.

“Extending Lottotech’s trusted relationship with Brightstar into its third decade through this latest contract underscores our shared commitment to long-term innovation and growth,” said Moorghen Veeramootoo, Lottotech Chief Executive Officer. “Enhancing our central system marks a significant milestone for Lottotech, enabling greater agility, flexibility, and disaster tolerance as we enhance the player and retailer experiences while positioning our business for continued success.”

“As Lottotech’s exclusive retail lottery technology partner since its inception, Brightstar has continuously pushed boundaries to revolutionize products that benefit and complement the expectations of today’s modern lottery,” said Marco Tasso, Brightstar Chief Operating Officer International and Italy Operations. “We are excited to deliver our next-generation terminals and deploy our advanced central system to Lottotech, a natural next step in the evolution of Lottotech’s business critical operations.”

Engineered for speed and reliability, Brightstar’s Retailer Pro S2 is powered by a high-performance processor that ensures rapid transaction processing. Its ergonomic, modular design supports multiple player-facing displays and a broad range of peripherals enabling flexible and engaging player interactions. Brightstar’s OpenRetail software is designed to streamline lottery operations with unmatched versatility and efficiency. Built on a single code line, updates and new features can be deployed easily across all point-of-sale devices.

About Lottotech Ltd
Lottotech is Mauritius’ leading lottery and gaming operator and the exclusive operator of the Mauritius National Lottery. Since 2008, the company has been delivering secure, innovative, and responsible gaming experiences through a portfolio of popular products including Loto, Loto Vert, and Football Pools. With a network of more than 600 retail points across Mauritius and Rodrigues, Lottotech combines retail and digital solutions to provide accessible entertainment while supporting national development through meaningful contributions to education, health, sports, culture, and community initiatives. As a member of the World Lottery Association (WLA), Lottotech is committed to the highest standards of integrity, security, and responsible gaming, and has achieved WLA Responsible Gaming Level 4 Certification. Through continuous innovation, operational excellence, and a customer-centric approach, Lottotech continues to create sustainable value for its players, partners, and the Mauritian community. For more information, visit www.lottotech.mu or follow Lottotech on LinkedIn.

About Brightstar Lottery PLC
Brightstar Lottery PLC (NYSE: BRSL) is global leader in lottery focused on innovation and forward-thinking strategies and solutions, building on our renowned expertise in delivering secure technology and producing reliable, comprehensive solutions for our customers. As a premier pure play global lottery company, our best-in-class lottery operations, retail and digital solutions, and award-winning lottery games enable our customers to achieve their goals, entertain players and distribute meaningful benefits to communities. Brightstar has a well-established local presence and is a trusted partner to governments and regulators around the world, creating value by adhering to the highest standards of service, integrity, and responsibility. Brightstar serves nearly 90 lottery customers and their players on six continents. It is the primary technology provider to 26 of the 46 lottery jurisdictions in the U.S. and eight of the world’s 10 largest lotteries. Brightstar has approximately 6,000 employees. For more information, please visit www.brightstarlottery.com or follow along on LinkedIn.

Cautionary Statement Regarding Forward-Looking Statements
This news release may contain forward-looking statements (including within the meaning of the Private Securities Litigation Reform Act of 1995) concerning Brightstar Lottery PLC and its consolidated subsidiaries (the “Company”) and other matters. These statements may discuss goals, intentions, and expectations as to future plans, trends, events, products and services, customer relationships, results of operations, or financial condition, or otherwise, based on current beliefs of the management of the Company as well as assumptions made by, and information currently available to, such management. Forward-looking statements may be accompanied by words such as “aim,” “anticipate,” “believe,” “plan,” “could,” “would,” “should,” “shall,” “continue,” “estimate,” “expect,” “forecast,” “future,” “guidance,” “intend,” “may,” “will,” “possible,” “potential,” “predict,” “project” or the negative or other variations of them. These forward-looking statements speak only as of the date on which such statements are made and are subject to various risks and uncertainties, many of which are outside the Company’s control. Should one or more of these risks or uncertainties materialize, or should any of the underlying assumptions prove incorrect, actual results may differ materially from those predicted in the forward-looking statements and from past results, performance, or achievements. Therefore, you should not place undue reliance on such statements. Factors that could cause actual results to differ materially from those in the forward-looking statements include (but are not limited to) macroeconomic, regulatory and political uncertainty, including as a result of new or increased tariffs, trade wars, and other restrictions on trade between or among countries in which the Company operates, and related changes in discretionary consumer spending and behavior, fluctuations in foreign currency exchange rates, and the other factors and risks described in the Company’s annual report on Form 20-F for the financial year ended December 31, 2025 and other documents filed or furnished from time to time with the SEC, which are available on the SEC’s website at www.sec.gov and on the investor relations section of the Company’s website at www.brightstarlottery.com. Except as required under applicable law, the Company does not assume any obligation to update these forward-looking statements. You should carefully consider these factors and other risks and uncertainties that may affect the Company’s business. All forward-looking statements contained in this news release are qualified in their entirety by this cautionary statement. All subsequent written or oral forward-looking statements attributable to the Company, or persons acting on its behalf, are expressly qualified in their entirety by this cautionary statement.

Contact:
Mike DeAngelis, Corporate Communications, +1 (401) 392-1000, mike.deangelis@brightstarlottery.com
Matteo Selva, Italian media inquiries, +39 366 6803635
James Hurley, Investor Relations, +1 (401) 392-7190

© 2026 Brightstar Lottery PLC

The trademarks and/or service marks used herein are either trademarks or registered trademarks of Brightstar Lottery PLC, its affiliates or its licensors.


View original content to download multimedia:https://www.prnewswire.com/news-releases/brightstar-lottery-delivers-enhanced-retail-central-system-to-lottotech-in-mauritius-302769839.html

SOURCE Brightstar Lottery PLC

Continue Reading

Technology

goeasy Ltd. Reports Results for the First Quarter 2026

Published

on

By

Loan Portfolio of $5.36 billion at Q1/26 end, up 12% from $4.80 billion at Q1/25 end
Revenue of $413 million in Q1/26, up 2% compared to $405 million in Q1/25
Net Charge Off Rate1 of 17.8% in Q1/26, up 890 bps from 8.9% in Q1/25
Diluted Loss Per Share of $3.22 in Q1/26, down from diluted EPS of $2.28 in Q1/25
Adjusted Diluted Loss Per Share1 of $1.90 in Q1/26, down from Adj. Dil. EPS1 of $3.49 in Q1/25

MISSISSAUGA, ON, May 12, 2026 /CNW/ – goeasy Ltd. (TSX: GSY), (“goeasy” or the “Company”), one of Canada’s leading consumer lenders focused on delivering a full suite of financial services to Canadians with non-prime credit scores, today reported results for the first quarter ended March 31, 2026.

“We continued to advance our six-point action plan in the first quarter, with cost efficiency measures already taking effect,” said Patrick Ens, goeasy’s Chief Executive Officer. “In March, we took decisive action to significantly reduce our exposure to merchant-originated loans. Our ending loan book size, total yield, and net charge off rate came in as expected. Our direct-to-consumer business remains strong, and with $560.1 million cash provided by operations before net principal written in the quarter, our liquidity position is solid as we manage through this transitional period.”

First Quarter Results

During the quarter, the Company generated $551.3 million in loan originations, down 19% compared to $676.8 million generated in the first quarter of 2025. The decrease in lending, consistent with the Company’s six-point action plan, was driven primarily by a reduction in merchant-originated automotive and powersports loan originations, as the Company implemented tighter credit underwriting measures in response to unfavourable credit performance in those portfolios. 

At quarter end, the consumer loan portfolio was $5.36 billion, up 12% from $4.80 billion at the end of the first quarter of 2025, but down $150.0 million or 3% from the end of the fourth quarter of 2025. Organic growth in the Company’s consumer loan portfolio was the main driver of growth in revenue, which increased 2% from $404.9 million in the first quarter of 2025 to $412.9 million in the first quarter of 2026. Total annualized yield (including ancillary products) realized on average consumer loans receivable1 was 27.9% in the quarter, down 330 bps from the same period in 2025, but up 130 bps from the fourth quarter of 2025. Total annualized yield decreased year-over-year mainly due to the impact of higher allowance for credit losses on interest receivable; the continued impact of the lowered maximum allowable rate of interest on the Company’s unsecured lending product; and a higher proportion of larger dollar value loans, which have reduced pricing on certain ancillary products.

During the quarter, the annualized net charge off rate was 17.8%, up 890 bps from 8.9% in the first quarter of 2025, but down 600 bps from the fourth quarter of 2025. Annualized net charge off rate increased year -over-year primarily due to higher charge offs in the merchant-originated automotive and powersports loan portfolios. The total allowance for credit losses on gross consumer loans increased to $541.2 million from $382.8 million as at March 31, 2025, mainly due to the Company’s current view of collectability and an increase in the credit loss outlook for the merchant-originated automotive and powersports loans. The rate of allowance for expected credit losses, defined as the allowance for credit losses on gross consumer loans receivable as a percentage of the ending gross consumer loans receivable, increased from 9.57% as at December 31, 2025 to 10.09% as at March 31, 2026, driven primarily by unfavourable changes in the macroeconomic forecast data used in the Company’s IFRS 9 allowance model.

Operating income for the first quarter of 2026 was $28.9 million, down 80% from $144.1 million in the first quarter of 2025. After adjusting for unusual and non-recurring items, the Company reported adjusted operating income2 of $36.9 million, a decrease from $147.4 million in the first quarter of 2025. The efficiency ratio1 for the first quarter of 2026 was 24.5%, a 160 bps improvement from 26.1% in the first quarter of 2025.

Net loss for the first quarter of 2026 was $53.0 million, down from net income of $38.7 million in the first quarter of 2025, and diluted loss per share was $3.22, down from diluted earnings per share of $2.28 reported in the first quarter of 2025. Adjusted net loss2 for the first quarter of 2026 was $31.3 million, down from adjusted net income2 of $59.3 million in the first quarter of 2025. The decrease in adjusted net income was primarily driven by lower adjusted operating income from lower total yield on consumer loans (including ancillary products) and elevated credit losses. Adjusted diluted loss per share1 was $1.90, down from adjusted diluted earnings per share1 of $3.49 in the first quarter of 2025.

Balance Sheet and Liquidity

Total assets were $5.82 billion as at March 31, 2026, an increase of 9% from $5.34 billion as at March 31, 2025, primarily driven by growth in consumer loans receivable and cash. Cash provided by operations before net principal written2 in the first quarter of 2026 was $560.1 million, compared to $410.7 million in the first quarter of 2025. The Company’s debt-to-adjusted tangible equity ratio3, a capital management measure for leverage, was 5.30x as at March 31, 2026, compared to 3.69x as at March 31, 2025. The average blended coupon interest rate for the Company’s debt as at March 31, 2026 was 6.6%.

As at March 31, 2026, goeasy had liquidity (cash on hand plus unused contractual borrowing capacity) of $1.10 billion (of which $743 million is not currently available to be drawn by the Company). Subsequent to quarter end, the Company used existing liquidity to repay the US$64.6 million senior unsecured notes that matured on May 1, 2026. The Company was not subject to financial covenant compliance, and was in compliance with all other applicable covenants, for the Revolving Securitization Warehouse Facility I as at March 31, 2026. The Company was in compliance with all of its covenants (including financial covenants) under its Revolving Credit Facility agreement as at March 31, 2026. The Company continues to progress toward transitioning to a replacement backup servicer and completing a satisfactory audit in respect of the Revolving Securitization Warehouse Facility I, completion of which will permit additional draws on the facility.

Selected Additional First Quarter Information
(March 31, 2026 relative to March 31, 2025, where applicable)

44% of gross consumer loans receivable secured, down from 46%Total number of active lending customers at 466,000, up 7%71% of net loan advances1 in the quarter were issued to new customers, down from 73%Weighted average interest rate4 on consumer loans of 28.5%, up from 26.5%86.6% of gross consumer loans receivable, on a dollar-weighted basis, carried an interest rate less than or equal to a 35% Annual Percentage Rate, being the maximum allowable interest rate for new loans written after January 1, 2025

Updated 2026 Outlook

The Company disclosed its first quarter 2026 outlook, along with the relevant assumptions and risk factors, in its fourth quarter 2025 MD&A. The Company’s actual first quarter performance was consistent with its first quarter 2026 outlook across all three measures. The Company continues to focus on prudent management of liquidity, strengthening of credit performance, and alignment of its capital structure. Management remains confident in goeasy’s ability to return to its long track record of strong credit performance and returns that will reinforce confidence among shareholders and other stakeholders.

Q2 2026 Outlook

Full Year 2026 Commentary

Gross consumer loans receivable at period end

$4.9 to $5.1 billion

Expected to decline from December 31, 2025 level before resuming growth in the later part of the year

Total yield on consumer loans (including ancillary products)1

27.0% to 28.5%

Expected to improve over course of the year as charge offs decline

Net charge offs as a percentage of average gross consumer loans receivable1

16.0% to 17.5%

Expected to be in the mid-teens for full year 2026; improvement is expected as the year progresses

This outlook is subject to and based on the assumptions and risks set out in more detail under “Forward-Looking Statements”.

Share Repurchases and Dividend Payments

In consideration of recent developments that affected earnings in 2025, the Board of Directors (the “Board”) made the decision to suspend the regular quarterly dividend on the Company’s Common Shares and to suspend share repurchases under its normal course issuer bid on an indefinite basis. These actions are aligned with management’s focus on prudently preserving capital and maintaining liquidity.

Adoption of Shareholder Rights Plan

The Company also announced today that the Board has approved the adoption of a shareholder rights plan (the “SRP”) pursuant to a shareholder rights plan agreement entered into with TSX Trust Company, as rights agent, dated May 12, 2026 (the “Effective Date”).

The SRP has been adopted to: (i) ensure that all shareholders of the Company are treated fairly in connection with any unsolicited take-over bid or acquisition of control of the Company (including by way of a “creeping” take-over bid); (ii) provide the Board and shareholders of the Company with adequate time to consider and evaluate any unsolicited take-over bid or similar transaction; and (iii) enable the Board to identify, solicit, develop and negotiate any value-enhancing alternatives, as may be considered appropriate, to any unsolicited take-over bids or similar transaction.

The SRP is similar to rights plans adopted by other Canadian companies and ratified by their shareholders. The SRP is not being adopted in response to any specific proposal or intention to acquire control of the Company, and the Board is not aware of any pending or threatened take-over bid for the Company.

Pursuant to the SRP, one right will attach to each issued and outstanding common share of the Company. Subject to the terms of SRP, the rights become exercisable if any person (together with certain related parties) becomes a beneficial owner of 20% or more of the outstanding common shares without complying with the “Permitted Bid” provisions of the SRP. In such event, holders of the rights (other than the acquiring person and its related parties) will be permitted to exercise their rights to purchase additional common shares at a substantial discount to the then market price of the common shares.

The SRP has been conditionally accepted by the Toronto Stock Exchange. While the SRP is effective as of the Effective Date, it is subject to ratification by the Company’s shareholders at a meeting of shareholders to be held within six months of its Effective Date. The Company currently expects to seek shareholder ratification of the SRP at a special meeting to be called and held within that six-month period (the “Meeting”). If the SRP is not ratified by shareholders within that six-month period, it, together with the outstanding rights, will terminate and cease to be effective.

A summary of the principal terms of the SRP will be included in the management proxy circular to be sent to shareholders in connection with the Meeting. The full text of the SRP is available under the Company’s profile on SEDAR+ at sedarplus.ca.

Forward-Looking Statements

This press release includes forward-looking statements about goeasy, including, but not limited to, its business operations, strategy and expected financial performance and condition. Forward-looking statements include, but are not limited to, statements with respect to forecasts for growth of the consumer loans receivable, annual revenue growth forecasts, strategic initiatives, new product offerings and new delivery channels, anticipated cost savings, planned capital expenditures, anticipated capital requirements and the Company’s ability to secure sufficient capital, liquidity of the Company, plans and references to future operations and results, critical accounting estimates, expected future yields and net charge off rates on loans, the dealer relationships, the size and characteristics of the Canadian non-prime lending market, the continued development of the type and size of competitors in the market, the inclusion of the SRP in the management information circular for any Meeting and the calling and the holding of any such Meeting and the timing thereof; and the approval, ratification and confirmation of the SRP. In certain cases, forward-looking statements that are predictive in nature, depend upon or refer to future events or conditions, and/or can be identified by the use of words such as “expect”, “continue”, “anticipate”, “intend”, “aim”, “plan”, “believe”, “budget”, “estimate”, “forecast”, “foresee”, “target” or negative versions thereof and similar expressions, and/or state that certain actions, events or results “may”, “could”, “would”, “might” or “will” be taken, occur or be achieved.

Forward-looking statements are based on certain factors and assumptions, including expected growth, results of operations and business prospects and are inherently subject to, among other things, risks, uncertainties and assumptions about the Company’s operations, economic factors and the industry generally. There can be no assurance that forward-looking statements will prove to be accurate as actual results and future events could differ materially from those expressed or implied by forward-looking statements made by the Company. Some important factors that could cause actual results to differ materially from those expressed in the forward-looking statements include, but are not limited to, goeasy’s ability to enter into new lease and/or financing agreements, collect on existing lease and/or financing agreements, open new locations on favourable terms, offer products which appeal to customers at a competitive rate, respond to changes in legislation, react to uncertainties related to regulatory action, raise capital under favourable terms, compete, manage the impact of litigation (including shareholder litigation), control costs at all levels of the organization and maintain and enhance the system of internal controls.

The Company cautions that the foregoing list is not exhaustive. These and other factors could cause actual results to differ materially from our expectations expressed in the forward-looking statements, and further details and descriptions of these and other factors are disclosed in the Company’s Management’s Discussion and Analysis (“MD&A”) for the year ended December 31, 2025, including under the section entitled “Risk Factors”.

The reader is cautioned to consider these, and other factors carefully and not to place undue reliance on forward-looking statements, which may not be appropriate for other purposes. The Company is under no obligation (and expressly disclaims any such obligation) to update or alter the forward-looking statements whether as a result of new information, future events or otherwise, unless required by law.

The Company particularly cautions that the Q2 2026 outlook and full year 2026 commentary presented above under the heading “Updated 2026 Outlook” (the “2026 Outlook Information”) constitutes forward-looking information and that in formulating its outlook, the Company makes a series of assumptions, which include, but are not limited to, assumptions about Environmental Conditions (Stability in the macroeconomic environment; Continued demand for non-prime credit across); Portfolio Growth (Loan originations adjust as underwriting criteria are tightened, particularly within indirect channels); Liquidity & Funding (The Company prioritizes liquidity and covenant compliance; Continued access to funding at acceptable rates; Continued strong free cash flow from its existing portfolio); Revenue Yield (Portfolio yield expected to be negatively impacted by bad debts on interest receivable; Business mix shift to include more unsecured personal loan originations at higher yields; Total portfolio yield and net charge off as a percentage of gross consumer loans receivable on its lending products are as estimated in the Company’s budget and strategic plan); Credit Performance (Net charge offs as a percentage of gross consumer loans receivable perform in line with the Company’ budget and forecasts generated through the use of its proprietary credit and underwriting models; The mixture of customers acquired through each of the Company’s acquisition channels and the mixture of new and existing borrowers are as estimated in the Company’s forecast); Investment Performance (No material changes are assumed in the fair value of investments, and no forecast is made regarding the timing of realization of the investment portfolio); and Mergers and Acquisitions (No mergers or acquisitions are contemplated within the outlook period). These assumptions and expectations are subject to a number of risks, including the following, as well as those set out the section entitled “Risk Factors” in the Company’s MD&A: Environmental & Market Conditions (Uncertainty in consumer demand or broader economic conditions may adversely impact loan originations and portfolio performance; Deterioration in employment levels or economic stability could negatively affect credit performance and increase net charge off rates; Competitive dynamics or pricing pressures may impact margins and growth); Access to Capital & Funding (The Company’s ability to access capital on acceptable terms and maintain adequate liquidity to support operations and strategic priorities); Regulatory Environment (Changes to laws and regulations governing consumer lending that could impact product offerings, pricing or operations); Credit Performance (A material increase in net charge off as a percentage of gross consumer loans receivable beyond expectations, including adverse performance from prior vintages or new originations); and Operating Execution (The Company’s ability to successfully execute on its Action Plan, including underwriting changes, and operating model alignment and platform consolidation; Risks associated with transitioning originations and customer portfolios toward the easyfinancial platform). The 2026 Outlook Information constitutes targets established by the Company and is subject to change as plans and business conditions vary. Accordingly, investors are cautioned not to place undue reliance on the 2026 Outlook Information. Actual results may differ materially.

About goeasy

goeasy Ltd. is a leading Canadian provider of non-prime consumer lending solutions, offering a suite of financial products through its easyfinancial, easyhome, and LendCare brands. goeasy offers unsecured and secured instalment loans, point-of-sale financing, and lease-to-own merchandise through its omni-channel model, which spans online, mobile, and hundreds of locations nationwide.

Driven by its team members’ dedication to expand access to credit for underserved communities and helping customers strengthen their financial futures, goeasy has proudly served more than 1.6 million customers while building an award-winning culture. Shares of goeasy Ltd. are listed on the Toronto Stock Exchange (TSX) under the symbol GSY. For more information, visit www.goeasy.com.

For investor inquiries, contact:

James Obright
Senior Vice President, Investor Relations & Capital Markets
investor_relations@goeasy.com

For media inquiries, contact:

mediainquiries@goeasy.com

Notes:

1 These are non-IFRS ratios. Refer to “Non-IFRS Measures and Other Financial Measures” section in this press release.
2 These are non-IFRS measures. Refer to “Non-IFRS Measures and Other Financial Measures” section in this press release.
3 These are capital management measures. Refer to “Non-IFRS Measures and Other Financial Measures” section in this press release.
4 These are supplementary financial measures. Refer to “Non-IFRS Measures and Other Financial Measures” section in this press release.

goeasy Ltd.

INTERIM CONDENSED CONSOLIDATED STATEMENTS OF FINANCIAL POSITION

(Unaudited)

(Expressed in thousands of Canadian dollars)

As At

As At

March 31,

December 31,

2026

2025

ASSETS 

Cash 

356,237

152,661

Accounts receivable

40,307

42,361

Prepaid expenses

13,877

9,159

Income taxes recoverable

109,467

90,559

Consumer loans receivable, net 

4,982,870

5,155,360

Investments 

23,117

29,103

Lease assets, net

33,851

36,656

Derivative financial assets 

31,138

11,146

Deferred income tax assets 

25,831

22,250

Property and equipment, net 

28,634

30,788

Right-of-use assets, net

51,135

52,510

Intangible assets, net

103,914

104,142

Goodwill

21,310

21,310

TOTAL ASSETS

5,821,688

5,758,005

LIABILITIES AND SHAREHOLDERS’ EQUITY

Liabilities

Revolving credit facility 

310,310

175,052

Accounts payable and other liabilities

79,585

107,842

Dividends payable 

23,398

Unearned revenue

29,962

31,219

Accrued interest payable

84,970

68,533

Deferred income tax liabilities 

11,064

5,367

Lease liabilities

57,840

59,451

Secured borrowings 

71,612

88,783

Revolving securitization warehouse facilities 

609,561

611,015

Derivative financial liabilities 

14,402

46,107

Notes payable 

3,751,143

3,690,818

TOTAL LIABILITIES

5,020,449

4,907,585

Shareholders’ equity

Share capital 

431,264

430,325

Contributed surplus

25,244

26,782

Accumulated other comprehensive loss

(8,960)

(13,367)

Retained earnings

353,691

406,680

TOTAL SHAREHOLDERS’ EQUITY

801,239

850,420

TOTAL LIABILITIES AND SHAREHOLDERS’ EQUITY

5,821,688

5,758,005


goeasy Ltd.

INTERIM CONDENSED CONSOLIDATED STATEMENTS OF INCOME (LOSS)

(Unaudited)

(Expressed in thousands of Canadian dollars, except earnings (loss) per share)

Three Months Ended

March 31,

March 31,

2026

2025

Restated

REVENUE

Interest income

317,910

308,891

Lease revenue

20,045

22,242

Commissions earned

70,063

68,187

Charges and fees

4,839

5,603

412,857

404,923

OPERATING EXPENSES

BAD DEBTS 

267,200

145,023

OTHER OPERATING EXPENSES

Salaries and benefits

52,664

49,463

Share-based compensation 

(1,062)

4,441

Technology costs

11,370

12,220

Underwriting and collections

9,385

7,162

Occupancy

5,714

5,672

Restructuring charges

4,763

Advertising and promotion

3,263

8,686

Other expenses

10,690

7,681

96,787

95,325

DEPRECIATION AND AMORTIZATION

Depreciation of lease assets

6,485

6,983

Amortization of intangible assets 

5,525

5,646

Depreciation of right-of-use assets 

5,342

5,297

Depreciation of property and equipment 

2,642

2,597

19,994

20,523

TOTAL OPERATING EXPENSES

383,981

260,871

OPERATING INCOME

28,876

144,052

OTHER LOSS 

(5,986)

FINANCE COSTS 

(93,163)

(89,651)

INCOME (LOSS) BEFORE INCOME TAXES

(70,273)

54,401

INCOME TAX EXPENSE (RECOVERY) 

Current

(18,908)

30,896

Deferred

1,624

(15,204)

(17,284)

15,692

NET INCOME (LOSS) 

(52,989)

38,709

BASIC EARNINGS (LOSS) PER SHARE 

(3.22)

2.30

DILUTED EARNINGS (LOSS) PER SHARE 

(3.22)

2.28


SUMMARY OF FINANCIAL RESULTS BY REPORTABLE SEGMENT

(Expressed in thousands of Canadian dollars, except earnings per share)

Three Months Ended March 31, 2026

easyfinancial

easyhome

Corporate

Total

Revenue

Interest income

303,582

14,328

317,910

Lease revenue

20,045

20,045

Commissions earned

66,006

4,057

70,063

Charges and fees

4,067

772

4,839

373,655

39,202

412,857

Operating expenses 

Bad debts

256,799

10,401

267,200

Other operating expenses

63,908

12,704

20,175

96,787

Depreciation and amortization

9,916

8,488

1,590

19,994

330,623

31,593

21,765

383,981

Operating income (loss)

43,032

7,609

(21,765)

28,876

Other loss

(5,986)

Finance costs

(93,163)

Loss before income taxes

(70,273)

Income tax recovery

(17,284)

Net loss

(52,989)

Diluted loss per share

(3.22)

Three Months Ended March 31, 2025 

(As restated) 

easyfinancial

easyhome

Corporate

Total

Revenue

Interest income

298,408

10,483

308,891

Lease revenue

22,242

22,242

Commissions earned

64,625

3,562

68,187

Charges and fees

4,848

755

5,603

367,881

37,042

404,923

Operating expenses 

Bad debts

140,467

4,556

145,023

Other operating expenses

61,526

13,924

19,875

95,325

Depreciation and amortization

9,737

9,063

1,723

20,523

211,730

27,543

21,598

260,871

Operating income (loss)

156,151

9,499

(21,598)

144,052

Other income

Finance costs

(89,651)

Income before income taxes

54,401

Income tax expense

15,692

Net income

38,709

Diluted earnings per share

2.28


SUMMARY OF FINANCIAL RESULTS AND KEY PERFORMANCE INDICATORS

Three Months Ended 

($ in 000’s except earnings per share and percentages) 

March 31,  

2026 

March 31,  

2025 

(As restated) 

Variance  

$ / bps 

Variance  

% Change 

Summary Financial Results 

Revenue 

412,857

404,923

7,934

2.0 %

Bad debts 

267,200

145,023

122,177

84.2 %

Other operating expenses 

96,787

95,325

1,462

1.5 %

EBITDA1 

36,399

157,592

(121,193)

(76.9 %)

EBITDA margin1 

8.8 %

38.9 %

(3,010 bps) 

(77.4 %)

Depreciation and amortization 

19,994

20,523

(529)

(2.6 %)

Operating income 

28,876

144,052

(115,176)

(80.0 %)

Operating margin 

7.0 %

35.6 %

(2,860 bps) 

(80.3 %)

Other income (loss) 

(5,986)

(5,986)

(100.0 %)

Finance costs 

93,163

89,651

3,512

3.9 %

Effective income tax rate 

24.6 %

28.8 %

(420 bps) 

(14.7 %)

Net income (loss)  

(52,989)

38,709

(91,698)

(236.9 %)

Diluted earnings (loss) per share 

(3.22)

2.28

(5.50)

(241.2 %)

Return on receivables 

(3.9 %)

3.3 %

(720 bps) 

(218.2 %)

Return on assets 

(3.7 %)

2.9 %

(660 bps) 

(227.6 %)

Return on equity 

(25.7 %)

13.4 %

(3,910 bps) 

(291.8 %)

Return on tangible common equity1 

(26.8 %)

17.9 %

(4,470 bps) 

(249.7 %)

Adjusted Financial Results1,2 

Other operating expenses 

98,509

102,216

(3,707)

(3.6 %)

Efficiency ratio 

24.5 %

26.1 %

(160 bps) 

(6.1 %)

Operating income 

36,914

147,419

(110,505)

(75.0 %)

Operating margin 

8.9 %

36.4 %

(2,750 bps) 

(75.6 %)

Net income (loss) 

(31,313)

59,349

(90,662)

(152.8 %)

Diluted earnings per share 

(1.90)

3.49

(5.39)

(154.4 %)

Return on receivables 

(2.3 %)

5.0 %

(730 bps) 

(146.0 %)

Return on assets 

(2.2 %)

4.5 %

(670 bps) 

(148.9 %)

Return on equity 

(15.2 %)

20.5 %

(3,570 bps) 

(174.1 %)

Return on tangible common equity 

(16.6 %)

25.9 %

(4,250 bps) 

(164.1 %)

Key Performance Indicators 

Segment Financials 

easyfinancial revenue 

373,655

367,881

5,774

1.6 %

easyfinancial operating margin 

11.5 %

42.4 %

(3,090 bps) 

(72.9 %)

easyhome revenue 

39,202

37,042

2,160

5.8 %

easyhome operating margin 

19.4 %

25.6 %

(620 bps) 

(24.2 %)

Portfolio Indicators 

Gross consumer loans receivable 

5,363,456

4,795,387

568,069

11.8 %

Growth in consumer loans receivable 

(150,011)

192,950

(342,961)

(177.7 %)

Gross loan originations 

551,314

676,769

(125,455)

(18.5 %)

Total yield on consumer loans (including ancillary products)1 

27.9 %

31.2 %

(330 bps) 

(10.5 %)

Net charge offs as a percentage of average gross consumer loans receivable1 

17.8 %

8.9 %

890 bps 

100.2 %

Cash provided by operations before net principal written1 

560,108

410,747

149,361

36.4 %

Potential monthly leasing revenue1 

5,820

6,727

(907)

(13.5 %)

1 EBITDA, adjusted other operating expenses, adjusted operating income (loss), adjusted net income (loss) and cash provided by operations before net principal written are non-IFRS measures. EBITDA margin, efficiency ratio, adjusted operating margin, adjusted diluted earnings (loss) per share, adjusted return on receivables, adjusted return on equity, adjusted return on assets, reported and adjusted return on tangible common equity, total yield on consumer loans (including ancillary products) and net charge offs as a percentage of average gross consumer loans receivable are non-IFRS ratios. See description in sections “Portfolio Analysis”, “Key Performance Indicators and Non-IFRS Measures” and “Financial Condition”.
2 Adjusting items are discussed in the “Key Performance Indicators and Non-IFRS Measures” section.

Non-IFRS Measures and Other Financial Measures

The Company uses a number of financial measures to assess its performance. Some of these measures are not calculated in accordance with International Financial Reporting Standards (IFRS) as issued by International Accounting Standards Board (IASB), are not identified by IFRS and do not have standardized meanings that would ensure consistency and comparability among companies using these measures. The Company believes that non-IFRS measures are useful in assessing ongoing business performance and provide readers with a better understanding of how management assesses performance. These non-IFRS measures are used throughout this press release and listed below. An explanation of the composition of non-IFRS measures and other financial measures can be found in the Company’s MD&A, available on www.sedarplus.ca.

Adjusted Net Income (Loss) and Adjusted Diluted Earnings (Loss) Per Share

Adjusted net income (loss) is a non-IFRS measure and adjusted diluted earnings (loss) per share is a non-IFRS ratio. Refer to “Key Performance Indicators and Non-IFRS Measures” section on page 33 of the Company’s MD&A for the three-month period ended March 31, 2026. Items used to calculate adjusted net income (loss) and adjusted diluted earnings (loss) per share for the three-month periods ended March 31, 2026 and 2025 include those indicated in the chart below:

Three Months Ended 

($ in 000’s except earnings per share) 

March 31, 

2026 

March 31, 

2025 

(As restated) 

Net income (loss)  

(52,989)

38,709

Impact of adjusting items 

Other operating expenses  

Restructuring charges1 

4,763

    Integration costs2 

92

Depreciation and amortization  

Amortization of acquired intangible assets3 

3,275

3,275

Other loss 

5,986

Finance costs 

Fair value change on prepayment options related to Notes Payable5 

13,309

24,714

Total pre-tax impact of adjusting items 

27,333

28,081

Income tax impact of above adjusting items 

(5,657)

(7,441)

After-tax impact of adjusting items 

21,676

20,640

Adjusted net income (loss)

(31,313)

59,349

Weighted average number of diluted shares outstanding 

16,456

17,007

Diluted earnings (loss) per share 

(3.22)

2.28

Per share impact of adjusting items 

1.32

1.21

Adjusted diluted earnings (loss) per share 

(1.90)

3.49

Adjusting item related to restructuring charges 

1 The Company completed a restructuring exercise in March 2026 and incurred a total of $4.8 million related to severance costs, settlement claims and consulting fees. 

Adjusting items related to the LendCare acquisition 

2 Integration costs related to representation and warranty insurance costs, and other integration costs related to the acquisition of LendCare.  

3 Amortization of the $131 million intangible asset related to the acquisition of LendCare, with an estimated useful life of ten years. 

Adjusting item related to other loss  

4 For the three-month period ended March 31, 2026, net investment loss was due to fair value changes in the Company’s investments. 

Adjusting item related to prepayment options embedded in the Notes Payable 

5 For the three-month periods ended March 31, 2026 and 2025, the Company recognized a fair value change on the prepayment options related to Notes Payable. 

Adjusted Other Operating Expenses and Efficiency Ratio

Adjusted other operating expenses is a non-IFRS measure and efficiency ratio is a non-IFRS ratio. Refer to “Key Performance Indicators and Non-IFRS Measures” section on page 33 of the Company’s MD&A for the three-month period ended March 31, 2026. Items used to calculate adjusted other operating expenses and efficiency ratio for the three-month periods ended March 31, 2026 and 2025 include those indicated in the chart below:

Three Months Ended 

($ in 000’s except earnings per share) 

March 31, 

2026 

March 31, 

2025 

(As restated) 

Other operating expenses  

96,787

95,325

Impact of adjusting items1 

Other operating expenses 

Restructuring charges 

(4,763)

Integration costs 

(92)

Depreciation and amortization  

Depreciation of lease assets 

6,485

6,983

Total impact of adjusting items 

1,722

6,891

Adjusted other operating expenses 

98,509

102,216

Total revenue 

412,857

404,923

Less: Bad debts on interest receivable 

(10,879)

(13,739)

Adjusted Financial Revenue 

401,978

391,184


Efficiency ratio 


24.5 %


26.1 %

1 For explanation of adjusting items, refer to the corresponding “Adjusted Net Income and Adjusted Diluted Earnings Per Share” section. 

Adjusted Operating Margin

Adjusted operating margin is a non-IFRS measure and adjusted operating margin is a non-IFRS ratio. Refer to “Key Performance Indicators and Non-IFRS Measures” section on page 33 of the Company’s MD&A for the three-month period ended March 31, 2026. Items used to calculate adjusted operating income (loss) and adjusted operating margins for the three-month periods ended March 31, 2026 and 2025 include those indicated in the chart below:

Three Months Ended 

($ in 000’s except percentages) 

March 31, 

2026 

March 31, 

2026 (adjusted) 

March 31, 

2025 

(As restated) 

March 31, 

2025 

(adjusted) 

(As restated) 

easyfinancial 

Operating income (loss) 

43,032

43,032

156,151

156,151

Divided by revenue 

373,655

373,655

367,881

367,881

easyfinancial operating margin 

11.5 %

11.5 %

42.4 %

42.4 %

easyhome 

Operating income 

7,609

7,609

9,499

9,499

Divided by revenue 

39,202

39,202

37,042

37,042

easyhome operating margin 

19.4 %

19.4 %

25.6 %

25.6 %

Total 

Operating income (loss) 

28,876

28,876

144,052

144,052

Other operating expenses1  

Restructuring charges 

4,763

Integration costs 

92

Depreciation and amortization

Amortization of acquired intangible assets 

3,275

3,275

Adjusted operating income (loss) 

28,876

36,914

144,052

147,419

Divided by revenue 

412,857

412,857

404,923

404,923

Total operating margin 

7.0 %

8.9 %

35.6 %

36.4 %

1 For explanation of adjusting items, refer to the corresponding “Adjusted Net Income and Adjusted Diluted Earnings Per Share” section.

Earnings before Interest, Taxes, Depreciation and Amortization (“EBITDA”) and EBITDA Margin

EBITDA is a non-IFRS measure, while EBITDA margin is a non-IFRS ratio. Refer to “Key Performance Indicators and Non-IFRS Measures” section on page 33 of the Company’s MD&A for the three-month period ended March 31, 2026. Items used to calculate EBITDA and EBITDA margin for the three-month periods ended March 31, 2026 and 2025 include those indicated in the chart below:

Three Months Ended 

($ in 000’s except percentages) 

March 31, 

2026 

March 31, 

2025 

(As restated) 

Net income (loss) 

(52,989)

38,709

Finance cost 

93,163

89,651

Income tax expense 

(17,284)

15,692

Depreciation and amortization 

19,994

20,523

Depreciation of lease assets 

(6,485)

(6,983)

EBITDA 

36,399

157,592

Divided by revenue 

412,857

404,923

EBITDA margin 

8.8 %

38.9 %

Cash Provided by Operating Activities before Net Principal Written

Cash provided by operating activities before net principal written is a non-IFRS measure. Refer to “Key Performance Indicators and Non-IFRS Measures” section on page 33 of the Company’s MD&A for the three-month period ended March 31, 2026. Items used to calculate cash provided by operating activities before net principal written for the three-month periods ended March 31, 2026 and 2025 include those indicated in the chart below:

Three Months Ended 

($ in 000’s) 


March 31, 

2026 

March 31, 

2025 

(As restated) 

Cash provided by (used in) operating activities 

122,296

(180,312)

Net principal written 

437,812

591,059

Cash provided by operating activities before net principal written 

560,108

410,747

Adjusted Return on Receivables

Adjusted return on receivables is a non-IFRS ratio. Refer to “Key Performance Indicators and Non-IFRS Measures” section on page 33 of the Company’s MD&A for the three-month period ended March 31, 2026. Items used to calculate adjusted return on receivables for the three-month periods ended March 31, 2026 and 2025 include those indicated in the chart below:

Three Months Ended 

($ in 000’s except percentages) 

March 31, 

2026 

March 31, 

2026  

(adjusted) 

March 31, 

2025 

(As restated) 

March 31, 

2025  

(adjusted) 

(As restated) 

Net income (loss)  

(52,989)

(52,989)

38,709

38,709

After-tax impact of adjusting items1 

21,676

20,640

Adjusted net income (loss) 

(52,989)

(31,313)

38,709

59,349

Multiplied by number of periods in a year 

X 4 

X 4 

X 4 

X 4 

Divided by average gross consumer loans receivable 

5,454,278

5,454,278

4,712,699

4,712,699

Return on receivables 

(3.9 %)

(2.3 %)

3.3 %

5.0 %

1 For explanation of adjusting items, refer to the corresponding “Adjusted Net Income and Adjusted Diluted Earnings Per Share” section. 

Adjusted Return on Assets

Adjusted return on assets is a non-IFRS ratio. Refer to “Key Performance Indicators and Non-IFRS Measures” section on page 33 of the Company’s MD&A for the three-month period ended March 31, 2026. Items used to calculate adjusted return on assets for the three-month periods ended March 31, 2026 and 2025 include those indicated in the chart below:

Three Months Ended 

($ in 000’s except percentages) 

March 31, 

2026 

March 31, 

2026  

(adjusted) 

March 31, 

2025 

(As restated) 

March 31, 

2025  

(adjusted) 

(As restated) 

Net income (loss)  

(52,989)

(52,989)

38,709

38,709

After-tax impact of adjusting items1 

21,676

20,640

Adjusted net income (loss) 

(52,989)

(31,313)

38,709

59,349

Multiplied by number of periods in a year 

X 4 

X 4 

X 4 

X 4 

Divided by average total assets for the period 

5,789,846

5,789,846

5,276,581

5,276,581

Return on assets 

(3.7 %)

(2.2 %)

2.9 %

4.5 %

1 For explanation of adjusting items, refer to the corresponding “Adjusted Net Income and Adjusted Diluted Earnings Per Share” section. 

Adjusted Return on Equity

Adjusted return on equity is a non-IFRS ratio. Refer to “Key Performance Indicators and Non-IFRS Measures” section on page 33 of the Company’s MD&A for the three-month period ended March 31, 2026. Items used to calculate adjusted return on equity for the three-month periods ended March 31, 2026 and 2025 include those indicated in the chart below:

Three Months Ended 

($ in 000’s except percentages) 

March 31, 

2026 

March 31, 

2026  

(adjusted) 

March 31, 

2025 

(As restated) 

March 31, 

2025  

(adjusted) 

(As restated) 

Net income (loss)  

(52,989)

(52,989)

38,709

38,709

After-tax impact of adjusting items1 

21,676

20,640

Adjusted net income (loss) 

(52,989)

(31,313)

38,709

59,349

Multiplied by number of periods in a year 

X 4 

X 4 

X 4 

X 4 

Divided by average shareholders’ equity for the period 

825,829

825,829

1,157,511

1,157,511

Return on equity 

(25.7 %)

(15.2 %)

13.4 %

20.5 %

1 For explanation of adjusting items, refer to the corresponding “Adjusted Net Income and Adjusted Diluted Earnings Per Share” section. 

Reported and Adjusted Return on Tangible Common Equity

Reported and adjusted return on tangible common equity are non-IFRS ratios. Refer to “Key Performance Indicators and Non-IFRS Measures” section on page 33 of the Company’s MD&A for the three-month period ended March 31, 2026. Items used to calculate reported and adjusted return on tangible common equity for the three-month periods ended March 31, 2026 and 2025 include those indicated in the chart below:

Three Months Ended 

($ in 000’s except percentages) 

March 31, 

2026 

March 31, 

2026  

(adjusted) 

March 31, 

2025 

(As restated) 

March 31, 

2025  

(adjusted) 

(As restated) 

Net income (loss)  

(52,989)

(52,989)

38,709

38,709

Amortization of acquired intangible assets 

3,275


3,275

3,275

3,275

Income tax impact of the above item 

(868)

(868)

(868)

(868)

Net income before amortization of acquired intangible assets, net of income tax 

(50,582)

(50,582)

41,116


41,116

Impact of adjusting items1 

Other operating expenses  

Restructuring charges 

4,763

Integration costs 

92

Other loss  

5,986

Finance costs 

Fair value change on prepayment options related to Notes Payable 

13,309

24,714

Total pre-tax impact of adjusting items 

(50,582)

24,058

24,806

Income tax impact of above adjusting items 

(4,789)

(6,573)

After-tax impact of adjusting items 

19,269

18,233

Adjusted net income (loss) 

(50,582)

(31,313)

41,116

59,349

Multiplied by number of periods in a year 

X 4 

X 4 

X 4 

X 4 

Average shareholders’ equity 

825,829

825,829

1,157,511

1,157,511

Average goodwill 

(21,310)

(21,310)

(180,923)

(180,923)

Average acquired intangible assets2 

(68,229)

(68,229)

(81,329)

(81,329)

Average related deferred tax liabilities 

18,081

18,081

21,552

21,552

Divided by average tangible common equity 

754,371


754,371

916,811

916,811

Return on tangible common equity 

(26.8 %)

(16.6 %)

17.9 %

25.9 %

1 For explanation of adjusting items, refer to the corresponding “Adjusted Net Income and Adjusted Diluted Earnings Per Share” section. 

2 Excludes intangible assets relating to software

easyhome Financial Revenue

easyhome financial revenue is a non-IFRS measure. It is calculated as total company revenue less easyfinancial revenue and leasing revenue. The Company believes that easyhome financial revenue is an important measure of the performance of the easyhome segment. Items used to calculate easyhome financial revenue for the three-month periods ended March 31, 2026 and 2025 include those indicated in the chart below:

($in 000’s)

Three Months Ended

March 31,

2026

March 31,

2025

(As restated)

Total company revenue

412,857

404,923

Less: easyfinancial revenue

(373,655)

(367,881)

Less: leasing revenue

(21,273)

(23,515)

easyhome financial revenue

17,929

13,527

Total Yield on Consumer Loans as a Percentage of Average Gross Consumer Loans Receivable

Total yield on consumer loans as a percentage of average gross consumer loans receivable is a non-IFRS ratio. See description in section “Portfolio Analysis” on page 20 of the Company’s MD&A for the three-month period ended March 31, 2026. Items used to calculate total yield on consumer loans as a percentage of average gross consumer loans receivable for the three-month periods ended March 31, 2026 and 2025 include those indicated in the chart below:

Three Months Ended 

($ in 000’s except percentages) 

March 31, 

2026 

March 31, 

2025 

(As restated) 

Total Company revenue 

412,857

404,923

Less: Leasing revenue 

(21,273)

(23,515)

Less: Bad debts on interest income 

(10,879)

(13,739)

Adjusted Financial revenue 

380,705

367,669

Multiplied by number of periods in a year 

X 4 

X 4 

Divided by average gross consumer loans receivable 

5,454,278

4,712,699

Total yield on consumer loans as a percentage of average gross consumer loans receivable (annualized) 

27.9 %

31.2 %

Net Charge Offs as a Percentage of Average Gross Consumer Loans Receivable

Net charge Offs as a percentage of average gross consumer loans receivable is a non-IFRS ratio. See description in section “Portfolio Analysis” on page 20 of the Company’s MD&A for the three-month period ended March 31, 2026. Items used to calculate net charge Offs as a percentage of average gross consumer loans receivable for the three-month periods ended March 31, 2026 and 2025 include those indicated in the chart below:

Three Months Ended

($in 000’s except percentages)

March 31,

2026

March 31,

2025

(As restated)

Net charge offs on gross consumer loans receivable

242,581

104,758

Multiplied by number of periods in a year

X 4

X 4

Divided by average gross consumer loans receivable

5,454,278

4,712,699

Net charge offs as a percentage of average gross consumer loans receivable (annualized)

17.8 %

8.9 %

Net Principal Written and Percentage Net Principal Written to New Customers

Net principal written (Net loan advances) is a non-IFRS measure. See description in section “Portfolio Analysis” on page 20 of the Company’s MD&A for the three-month period ended March 31, 2026. The percentage of net loan advances to new customers is a non-IFRS ratio. It is calculated as loan originations to new customers divided by the net principal written. The Company uses percentage of net loan advances to new customers, among other measures, to assess the operating performance of its lending business.  Items used to calculate the percentage of net loan advances to new customers for the three-month periods ended for the three-month period ended March 31, 2026 include those indicated in the chart below:

Three Months Ended 

($ in 000’s) 

March 31, 

2026 

March 31, 

2025 

Gross loan originations 

551,314

676,769

Loan originations to new customers 

312,694

431,949

Loan originations to existing customers 

238,620

244,820

Less: Proceeds applied to repay existing loans 

(113,502)

(85,710)

Net advance to existing customers 

125,118

159,110

Net principal written 

437,812

591,059

Percentage net advances to new customers

71.4 %

73.1 %

Debt to Adjusted Tangible Equity

Debt to adjusted tangible equity is a capital management measure. Refer to “Financial Condition” section on page 41 of the Company’s MD&A for the three-month period ended March 31, 2026. 

Weighted Average Interest Rate

Weighted average interest rate is a supplementary financial measure. It is calculated as the sum of individual loan balance multiplied by interest rate divided by gross consumer loans receivable.

SOURCE goeasy Ltd.

Continue Reading

Technology

3M Annual Meeting Results

Published

on

By

ST. PAUL, Minn., May 12, 2026 /PRNewswire/ — At today’s Annual Meeting of Shareholders, 3M (NYSE:MMM) shareholders overwhelmingly supported each of the proposals recommended for approval by the company.

Preliminary Shareholder Voting Results

3M shareholders today voted on the following business items:

1) Shareholders supported 10 directors for one-year terms:

David P. Bozeman, President, Chief Executive Officer and Director, C.H. Robinson Worldwide, Inc.Thomas “Tony” K. Brown, retired Group Vice President, Global Purchasing, Ford Motor CompanyWilliam M. “Bill” Brown, Chairman of the Board and Chief Executive Officer, 3M CompanyAudrey Choi, retired Chief Sustainability Officer and Management Committee Member, Morgan StanleyAnne H. Chow, retired Chief Executive Officer, AT&T BusinessJames R. Fitterling, Chair and Chief Executive Officer, Dow Inc.Suzan Kereere, President, Global Markets, PayPalNeil G. Mitchill, Jr., Executive Vice President and Chief Financial Officer, RTX CorporationPedro J. Pizarro, President, Chief Executive Officer and Director, Edison InternationalThomas W. Sweet, retired Chief Financial Officer, Dell Technologies

2) Shareholders supported the appointment of PricewaterhouseCoopers LLP as 3M’s independent registered public accounting firm for 2026.

3) Shareholders supported, on an advisory basis, executive compensation, as described in the company’s Notice of Annual Meeting and Proxy Statement.

3M will disclose the final voting results on each item of business properly presented at the Annual Meeting on Form 8-K to be filed with the SEC.

About 3M
3M (NYSE: MMM) is focused on transforming industries around the world by applying science and creating innovative, customer-focused solutions. Our multi-disciplinary team is working to solve tough customer problems by leveraging diverse technology platforms, differentiated capabilities, global footprint, and operational excellence. Discover how 3M is shaping the future at 3M.com/news.

Please note that the company announces material financial, business and operational information using the 3M investor relations website, SEC filings, press releases, public conference calls and webcasts. The company also uses the 3M News Center and social media to communicate with our customers and the public about the company, products and services and other matters. It is possible that the information 3M posts on the News Center and social media could be deemed to be material information. Therefore, the company encourages investors, the media and others interested in 3M to review the information posted on 3M’s News Center and the social media channels such as @3M or @3MNews.

Contacts

3M
Investor Contact:
Diane Farrow, 612-202-2449
Media Contact:
3Mnews@mmm.com

View original content to download multimedia:https://www.prnewswire.com/news-releases/3m-annual-meeting-results-302770102.html

SOURCE 3M Company

Continue Reading

Trending