Technology
E-Learning Market in Europe expected to expand by USD 79.4 billion from 2024-2028, driven by AI’s impact on proficiency assessments and certifications – Technavio
Published
2 years agoon
By
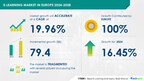
NEW YORK, Oct. 14, 2024 /PRNewswire/ — Report on how AI is redefining market landscape – The E-Learning Market in Europe size is estimated to grow by USD 79.4 billion from 2024-2028, according to Technavio. The market is estimated to grow at a CAGR of over 19.96% during the forecast period. Availability of subject proficiency assessments and certifications is driving market growth, with a trend towards rising adoption of content gamification in digital education. However, high development costs associated with e-learning courses poses a challenge – Key market players include Adobe Inc., Articulate Inc., Cegos Group, Cengage Learning Inc., Cisco Systems Inc., City and Guilds Group, D2L Inc., Docebo Inc., Hive Learning Ltd., Hubken Group Ltd., Instructure Holdings Inc., John Wiley and Sons Inc., Learning Technologies Group Plc, Mind Gym Plc, MPS Ltd., NIIT Ltd., Pearson Plc, Sanako, Simplilearn, and Skillsoft Corp..
Key insights into market evolution with AI-powered analysis. Explore trends, segmentation, and growth drivers- View the snapshot of this report
E-Learning Market In Europe Scope
Report Coverage
Details
Base year
2023
Historic period
2018 – 2022
Forecast period
2024-2028
Growth momentum & CAGR
Accelerate at a CAGR of 19.96%
Market growth 2024-2028
USD 79.4 billion
Market structure
Fragmented
YoY growth 2022-2023 (%)
16.45
Regional analysis
Europe
Performing market contribution
Europe at 100%
Key countries
UK, Germany, and Rest of Europe
Key companies profiled
Adobe Inc., Articulate Global Inc., Cegos Group, Cengage Learning Inc., Cisco Systems Inc., City and Guilds Group, D2L Inc., Docebo Inc., Hive Learning Ltd., Hubken Group Ltd., Instructure Holdings Inc., John Wiley and Sons Inc., Learning Technologies Group Plc, Mind Gym Plc, MPS Ltd., NIIT Ltd., Pearson Plc, Sanako, Simplilearn, and Skillsoft Corp.
Market Driver
The European E-learning market is witnessing significant growth due to the increasing trend of personalized learning and the proliferation of mobile devices. With the adoption of Bring Your Own Device (BYOD) initiatives in educational institutions, students are increasingly engaging in mobile-based learning. Mobile learning apps have gained popularity due to their convenience, affordability, and interactive nature. Vendors like MPS Ltd., based in India, offer mobile app-based E-learning solutions for various disciplines and test preparations. The adoption of mobile learning apps has encouraged other vendors to optimize their products for mobile accessibility. Gamification of content, which involves using multimedia tools and interactive quizzes and games, is a popular trend in mobile learning. This approach enhances learner engagement, promotes collaborative learning, and provides instant feedback. The cost-effectiveness of mobile apps compared to full-scale learning platforms makes them an attractive option for academic institutions. Overall, the gamification of content and the growing popularity of mobile learning apps are key drivers of the European E-learning market.
The European E-Learning market is experiencing significant growth, with a focus on network-enabled transfer of skills and knowledge through electronic resources. Learning systems, including Online E-Learning, Virtual Classroom, and Mobile E-Learning, are trending. LMS and Rapid E-Learning are popular for academic and corporate sectors, providing customized solutions for English language learners, students with disabilities, and the corporate sector for talent retention. Service and content providers offer interactive content for childhood education, K-12 education, and smart education initiatives. Digitalization drives the demand for digital transformation in education and training. M-learning, IoT devices, and Micro-credentials are key trends. However, challenges include infrastructure restraints, quality concerns, and technical issues. LinkedIn Corporation and other online learning platforms are addressing these challenges, offering personalized learning solutions and job placement skills.
Request Sample of our comprehensive report now to stay ahead in the AI-driven market evolution!
Market Challenges
The cost of developing E-learning courses in Europe varies based on the instructional design model and target learner group. For instance, courses for children include basic words and video graphics, while those for higher education levels feature more lectures and tutor conversations. The development process involves SMEs, instructional design team, project management team, and technical staff specialists, each contributing significantly to the costs. The consultation stage with SMEs costs over USD3,000, designing lecture and visual content costs around USD7,000, and practical assessments development costs approximately USD1,000, totaling approximately USD11,000. The production of online course content for an hour costs around USD18,000, and regular updates increase investments over time. These high development costs may delay the break-even point for new entrants in the European E-learning market, potentially slowing its growth during the forecast period.The European e-learning market is experiencing significant growth, driven by the need for flexible learning solutions for English language learnners and students with disabilities. M-learning and corporate sector training are key areas of focus, with talent retention and skill enhancement campaigns top priorities. School closures due to the pandemic have accelerated digitalization, leading to increased use of online learning platforms in education and training. Customized learning solutions, interactive content, and personalized learning are in demand. However, challenges include the digital divide, infrastructure restraints, quality concerns, technical issues, and regulatory issues. Innovations like micro-credentials, artificial intelligence, blended learning, and gamification are addressing these challenges. Companies like LinkedIn Corporation are leading the way in corporate training. Education institutions are embracing digital transformation, using cloud computing, IoT devices, and Learning Management Systems to enhance job placement skills. Flexible learning formats and accessibility are essential for all ages, from childhood education to K-12 and smart education initiatives. Despite resistance to change, the future of education and training is clearly digital.
Discover how AI is revolutionizing market trends- Get your access now!
Segment Overview
This e-learning market in Europe report extensively covers market segmentation by
Product 1.1 Packaged content1.2 SolutionsApplication 2.1 Higher education2.2 Corporate2.3 K-12Geography 3.1 Europe
1.1 Packaged content- The European E-Learning market has seen a significant increase in the adoption of packaged digital educational content, including e-books, videos, and simulations. Institutions and corporations are shifting towards technology-aided learning to meet industry demands. EU policies and programs promoting digital learning have fueled this trend. Packaged content offers cost benefits and wider access to learning materials. Vendors like Pearson, Adobe, and Cengage provide customized content and solutions. However, the rise of in-house E-learning content poses a challenge, as some institutions develop and distribute their own materials. This has led to an increase in personalized learning and distance education initiatives. Renowned institutions like the University of Oxford offer packaged content in the form of e-textbooks and audio-visual presentations. The packaged content segment is projected to grow more slowly than the solutions segment during the forecast period.
Download a Sample of our comprehensive report today to discover how AI-driven innovations are reshaping competitive dynamics
Research Analysis
The European E-Learning market is experiencing significant growth as education and training institutions, as well as businesses, embrace digital transformation. Electronic resources and network-enabled transfer of skills and knowledge have become essential for delivering education and training in various sectors. Online E-Learning platforms have become a popular choice for education delivery, with Mobile E-Learning and Rapid E-Learning providing added flexibility. Virtual Classroom technology enables real-time interaction between students and instructors. Service Providers and Content Providers offer customized solutions to meet the unique needs of Academic, Corporate, and K-12 institutions. Interactive content, IoT devices, and Smart Education initiatives are driving innovation in the sector. The Digital Divide remains a challenge, but initiatives are underway to bridge the gap and ensure equal access to digital learning opportunities.
Market Research Overview
The European E-Learning market is experiencing significant growth as learning systems shift from traditional methods to network-enabled transfer of skills and knowledge. Electronic resources are becoming the norm for education delivery, with online E-Learning, Mobile E-Learning, Rapid E-Learning, and Virtual Classroom leading the charge. Service Providers and Content Providers cater to various sectors, including Academic and Corporate, to bridge the digital divide and provide access to technology for English language learners and students with disabilities. The Corporate sector is leveraging E-Learning for talent retention, while digitalization and skill enhancement campaigns drive demand in the Education and Training sector. Digital transformation is revolutionizing the way we learn, with Online learning platforms, Smart education initiatives, and IoT devices offering interactive content and personalized learning solutions. However, challenges such as accessibility, resistance to change, regulatory issues, content standardization, and technical issues persist. Innovations like Artificial Intelligence, Blended learning, Cloud computing, Micro-credentials, and Gamification are addressing these challenges and offering flexible learning formats and continuous learning opportunities.
Table of Contents:
1 Executive Summary
2 Market Landscape
3 Market Sizing
4 Historic Market Size
5 Five Forces Analysis
6 Market Segmentation
ProductPackaged ContentSolutionsApplicationHigher EducationCorporateK-12GeographyEurope
7 Customer Landscape
8 Geographic Landscape
9 Drivers, Challenges, and Trends
10 Company Landscape
11 Company Analysis
12 Appendix
About Technavio
Technavio is a leading global technology research and advisory company. Their research and analysis focuses on emerging market trends and provides actionable insights to help businesses identify market opportunities and develop effective strategies to optimize their market positions.
With over 500 specialized analysts, Technavio’s report library consists of more than 17,000 reports and counting, covering 800 technologies, spanning across 50 countries. Their client base consists of enterprises of all sizes, including more than 100 Fortune 500 companies. This growing client base relies on Technavio’s comprehensive coverage, extensive research, and actionable market insights to identify opportunities in existing and potential markets and assess their competitive positions within changing market scenarios.
Contacts
Technavio Research
Jesse Maida
Media & Marketing Executive
US: +1 844 364 1100
UK: +44 203 893 3200
Email: media@technavio.com
Website: www.technavio.com/
View original content to download multimedia:https://www.prnewswire.com/news-releases/e-learning-market-in-europe-expected-to-expand-by-usd-79-4-billion-from-2024-2028–driven-by-ais-impact-on-proficiency-assessments-and-certifications—technavio-302274052.html
SOURCE Technavio
You may like
Technology
Brightstar Lottery Delivers Enhanced Retail Central System to Lottotech in Mauritius
Published
2 hours agoon
May 12, 2026By
Company extends its longtime relationship with the operator of the Mauritius National Lottery with new multi-year contract agreement
LONDON, May 12, 2026 /PRNewswire/ — Brightstar Lottery PLC (NYSE: BRSL) (“Brightstar”) announced today that its subsidiaries, Brightstar Global Solutions Corporation and Brightstar Lottery Cyprus Limited, have signed a multi-year contract extension with Lottotech, the operator of the Mauritius National Lottery. Brightstar will deploy an advanced lottery central system to unlock further benefits for Lottotech. Additionally, Brightstar will replace all lottery terminals with its latest hardware, the RetailerPro S2, which will feature Brightstar’s cutting-edge terminal application platform, OpenRetail.
“Extending Lottotech’s trusted relationship with Brightstar into its third decade through this latest contract underscores our shared commitment to long-term innovation and growth,” said Moorghen Veeramootoo, Lottotech Chief Executive Officer. “Enhancing our central system marks a significant milestone for Lottotech, enabling greater agility, flexibility, and disaster tolerance as we enhance the player and retailer experiences while positioning our business for continued success.”
“As Lottotech’s exclusive retail lottery technology partner since its inception, Brightstar has continuously pushed boundaries to revolutionize products that benefit and complement the expectations of today’s modern lottery,” said Marco Tasso, Brightstar Chief Operating Officer International and Italy Operations. “We are excited to deliver our next-generation terminals and deploy our advanced central system to Lottotech, a natural next step in the evolution of Lottotech’s business critical operations.”
Engineered for speed and reliability, Brightstar’s Retailer Pro S2 is powered by a high-performance processor that ensures rapid transaction processing. Its ergonomic, modular design supports multiple player-facing displays and a broad range of peripherals enabling flexible and engaging player interactions. Brightstar’s OpenRetail software is designed to streamline lottery operations with unmatched versatility and efficiency. Built on a single code line, updates and new features can be deployed easily across all point-of-sale devices.
About Lottotech Ltd
Lottotech is Mauritius’ leading lottery and gaming operator and the exclusive operator of the Mauritius National Lottery. Since 2008, the company has been delivering secure, innovative, and responsible gaming experiences through a portfolio of popular products including Loto, Loto Vert, and Football Pools. With a network of more than 600 retail points across Mauritius and Rodrigues, Lottotech combines retail and digital solutions to provide accessible entertainment while supporting national development through meaningful contributions to education, health, sports, culture, and community initiatives. As a member of the World Lottery Association (WLA), Lottotech is committed to the highest standards of integrity, security, and responsible gaming, and has achieved WLA Responsible Gaming Level 4 Certification. Through continuous innovation, operational excellence, and a customer-centric approach, Lottotech continues to create sustainable value for its players, partners, and the Mauritian community. For more information, visit www.lottotech.mu or follow Lottotech on LinkedIn.
About Brightstar Lottery PLC
Brightstar Lottery PLC (NYSE: BRSL) is global leader in lottery focused on innovation and forward-thinking strategies and solutions, building on our renowned expertise in delivering secure technology and producing reliable, comprehensive solutions for our customers. As a premier pure play global lottery company, our best-in-class lottery operations, retail and digital solutions, and award-winning lottery games enable our customers to achieve their goals, entertain players and distribute meaningful benefits to communities. Brightstar has a well-established local presence and is a trusted partner to governments and regulators around the world, creating value by adhering to the highest standards of service, integrity, and responsibility. Brightstar serves nearly 90 lottery customers and their players on six continents. It is the primary technology provider to 26 of the 46 lottery jurisdictions in the U.S. and eight of the world’s 10 largest lotteries. Brightstar has approximately 6,000 employees. For more information, please visit www.brightstarlottery.com or follow along on LinkedIn.
Cautionary Statement Regarding Forward-Looking Statements
This news release may contain forward-looking statements (including within the meaning of the Private Securities Litigation Reform Act of 1995) concerning Brightstar Lottery PLC and its consolidated subsidiaries (the “Company”) and other matters. These statements may discuss goals, intentions, and expectations as to future plans, trends, events, products and services, customer relationships, results of operations, or financial condition, or otherwise, based on current beliefs of the management of the Company as well as assumptions made by, and information currently available to, such management. Forward-looking statements may be accompanied by words such as “aim,” “anticipate,” “believe,” “plan,” “could,” “would,” “should,” “shall,” “continue,” “estimate,” “expect,” “forecast,” “future,” “guidance,” “intend,” “may,” “will,” “possible,” “potential,” “predict,” “project” or the negative or other variations of them. These forward-looking statements speak only as of the date on which such statements are made and are subject to various risks and uncertainties, many of which are outside the Company’s control. Should one or more of these risks or uncertainties materialize, or should any of the underlying assumptions prove incorrect, actual results may differ materially from those predicted in the forward-looking statements and from past results, performance, or achievements. Therefore, you should not place undue reliance on such statements. Factors that could cause actual results to differ materially from those in the forward-looking statements include (but are not limited to) macroeconomic, regulatory and political uncertainty, including as a result of new or increased tariffs, trade wars, and other restrictions on trade between or among countries in which the Company operates, and related changes in discretionary consumer spending and behavior, fluctuations in foreign currency exchange rates, and the other factors and risks described in the Company’s annual report on Form 20-F for the financial year ended December 31, 2025 and other documents filed or furnished from time to time with the SEC, which are available on the SEC’s website at www.sec.gov and on the investor relations section of the Company’s website at www.brightstarlottery.com. Except as required under applicable law, the Company does not assume any obligation to update these forward-looking statements. You should carefully consider these factors and other risks and uncertainties that may affect the Company’s business. All forward-looking statements contained in this news release are qualified in their entirety by this cautionary statement. All subsequent written or oral forward-looking statements attributable to the Company, or persons acting on its behalf, are expressly qualified in their entirety by this cautionary statement.
Contact:
Mike DeAngelis, Corporate Communications, +1 (401) 392-1000, mike.deangelis@brightstarlottery.com
Matteo Selva, Italian media inquiries, +39 366 6803635
James Hurley, Investor Relations, +1 (401) 392-7190
© 2026 Brightstar Lottery PLC
The trademarks and/or service marks used herein are either trademarks or registered trademarks of Brightstar Lottery PLC, its affiliates or its licensors.
View original content to download multimedia:https://www.prnewswire.com/news-releases/brightstar-lottery-delivers-enhanced-retail-central-system-to-lottotech-in-mauritius-302769839.html
SOURCE Brightstar Lottery PLC
Technology
goeasy Ltd. Reports Results for the First Quarter 2026
Published
2 hours agoon
May 12, 2026By
Loan Portfolio of $5.36 billion at Q1/26 end, up 12% from $4.80 billion at Q1/25 end
Revenue of $413 million in Q1/26, up 2% compared to $405 million in Q1/25
Net Charge Off Rate1 of 17.8% in Q1/26, up 890 bps from 8.9% in Q1/25
Diluted Loss Per Share of $3.22 in Q1/26, down from diluted EPS of $2.28 in Q1/25
Adjusted Diluted Loss Per Share1 of $1.90 in Q1/26, down from Adj. Dil. EPS1 of $3.49 in Q1/25
MISSISSAUGA, ON, May 12, 2026 /CNW/ – goeasy Ltd. (TSX: GSY), (“goeasy” or the “Company”), one of Canada’s leading consumer lenders focused on delivering a full suite of financial services to Canadians with non-prime credit scores, today reported results for the first quarter ended March 31, 2026.
“We continued to advance our six-point action plan in the first quarter, with cost efficiency measures already taking effect,” said Patrick Ens, goeasy’s Chief Executive Officer. “In March, we took decisive action to significantly reduce our exposure to merchant-originated loans. Our ending loan book size, total yield, and net charge off rate came in as expected. Our direct-to-consumer business remains strong, and with $560.1 million cash provided by operations before net principal written in the quarter, our liquidity position is solid as we manage through this transitional period.”
First Quarter Results
During the quarter, the Company generated $551.3 million in loan originations, down 19% compared to $676.8 million generated in the first quarter of 2025. The decrease in lending, consistent with the Company’s six-point action plan, was driven primarily by a reduction in merchant-originated automotive and powersports loan originations, as the Company implemented tighter credit underwriting measures in response to unfavourable credit performance in those portfolios.
At quarter end, the consumer loan portfolio was $5.36 billion, up 12% from $4.80 billion at the end of the first quarter of 2025, but down $150.0 million or 3% from the end of the fourth quarter of 2025. Organic growth in the Company’s consumer loan portfolio was the main driver of growth in revenue, which increased 2% from $404.9 million in the first quarter of 2025 to $412.9 million in the first quarter of 2026. Total annualized yield (including ancillary products) realized on average consumer loans receivable1 was 27.9% in the quarter, down 330 bps from the same period in 2025, but up 130 bps from the fourth quarter of 2025. Total annualized yield decreased year-over-year mainly due to the impact of higher allowance for credit losses on interest receivable; the continued impact of the lowered maximum allowable rate of interest on the Company’s unsecured lending product; and a higher proportion of larger dollar value loans, which have reduced pricing on certain ancillary products.
During the quarter, the annualized net charge off rate was 17.8%, up 890 bps from 8.9% in the first quarter of 2025, but down 600 bps from the fourth quarter of 2025. Annualized net charge off rate increased year -over-year primarily due to higher charge offs in the merchant-originated automotive and powersports loan portfolios. The total allowance for credit losses on gross consumer loans increased to $541.2 million from $382.8 million as at March 31, 2025, mainly due to the Company’s current view of collectability and an increase in the credit loss outlook for the merchant-originated automotive and powersports loans. The rate of allowance for expected credit losses, defined as the allowance for credit losses on gross consumer loans receivable as a percentage of the ending gross consumer loans receivable, increased from 9.57% as at December 31, 2025 to 10.09% as at March 31, 2026, driven primarily by unfavourable changes in the macroeconomic forecast data used in the Company’s IFRS 9 allowance model.
Operating income for the first quarter of 2026 was $28.9 million, down 80% from $144.1 million in the first quarter of 2025. After adjusting for unusual and non-recurring items, the Company reported adjusted operating income2 of $36.9 million, a decrease from $147.4 million in the first quarter of 2025. The efficiency ratio1 for the first quarter of 2026 was 24.5%, a 160 bps improvement from 26.1% in the first quarter of 2025.
Net loss for the first quarter of 2026 was $53.0 million, down from net income of $38.7 million in the first quarter of 2025, and diluted loss per share was $3.22, down from diluted earnings per share of $2.28 reported in the first quarter of 2025. Adjusted net loss2 for the first quarter of 2026 was $31.3 million, down from adjusted net income2 of $59.3 million in the first quarter of 2025. The decrease in adjusted net income was primarily driven by lower adjusted operating income from lower total yield on consumer loans (including ancillary products) and elevated credit losses. Adjusted diluted loss per share1 was $1.90, down from adjusted diluted earnings per share1 of $3.49 in the first quarter of 2025.
Balance Sheet and Liquidity
Total assets were $5.82 billion as at March 31, 2026, an increase of 9% from $5.34 billion as at March 31, 2025, primarily driven by growth in consumer loans receivable and cash. Cash provided by operations before net principal written2 in the first quarter of 2026 was $560.1 million, compared to $410.7 million in the first quarter of 2025. The Company’s debt-to-adjusted tangible equity ratio3, a capital management measure for leverage, was 5.30x as at March 31, 2026, compared to 3.69x as at March 31, 2025. The average blended coupon interest rate for the Company’s debt as at March 31, 2026 was 6.6%.
As at March 31, 2026, goeasy had liquidity (cash on hand plus unused contractual borrowing capacity) of $1.10 billion (of which $743 million is not currently available to be drawn by the Company). Subsequent to quarter end, the Company used existing liquidity to repay the US$64.6 million senior unsecured notes that matured on May 1, 2026. The Company was not subject to financial covenant compliance, and was in compliance with all other applicable covenants, for the Revolving Securitization Warehouse Facility I as at March 31, 2026. The Company was in compliance with all of its covenants (including financial covenants) under its Revolving Credit Facility agreement as at March 31, 2026. The Company continues to progress toward transitioning to a replacement backup servicer and completing a satisfactory audit in respect of the Revolving Securitization Warehouse Facility I, completion of which will permit additional draws on the facility.
Selected Additional First Quarter Information
(March 31, 2026 relative to March 31, 2025, where applicable)
44% of gross consumer loans receivable secured, down from 46%Total number of active lending customers at 466,000, up 7%71% of net loan advances1 in the quarter were issued to new customers, down from 73%Weighted average interest rate4 on consumer loans of 28.5%, up from 26.5%86.6% of gross consumer loans receivable, on a dollar-weighted basis, carried an interest rate less than or equal to a 35% Annual Percentage Rate, being the maximum allowable interest rate for new loans written after January 1, 2025
Updated 2026 Outlook
The Company disclosed its first quarter 2026 outlook, along with the relevant assumptions and risk factors, in its fourth quarter 2025 MD&A. The Company’s actual first quarter performance was consistent with its first quarter 2026 outlook across all three measures. The Company continues to focus on prudent management of liquidity, strengthening of credit performance, and alignment of its capital structure. Management remains confident in goeasy’s ability to return to its long track record of strong credit performance and returns that will reinforce confidence among shareholders and other stakeholders.
Q2 2026 Outlook
Full Year 2026 Commentary
Gross consumer loans receivable at period end
$4.9 to $5.1 billion
Expected to decline from December 31, 2025 level before resuming growth in the later part of the year
Total yield on consumer loans (including ancillary products)1
27.0% to 28.5%
Expected to improve over course of the year as charge offs decline
Net charge offs as a percentage of average gross consumer loans receivable1
16.0% to 17.5%
Expected to be in the mid-teens for full year 2026; improvement is expected as the year progresses
This outlook is subject to and based on the assumptions and risks set out in more detail under “Forward-Looking Statements”.
Share Repurchases and Dividend Payments
In consideration of recent developments that affected earnings in 2025, the Board of Directors (the “Board”) made the decision to suspend the regular quarterly dividend on the Company’s Common Shares and to suspend share repurchases under its normal course issuer bid on an indefinite basis. These actions are aligned with management’s focus on prudently preserving capital and maintaining liquidity.
Adoption of Shareholder Rights Plan
The Company also announced today that the Board has approved the adoption of a shareholder rights plan (the “SRP”) pursuant to a shareholder rights plan agreement entered into with TSX Trust Company, as rights agent, dated May 12, 2026 (the “Effective Date”).
The SRP has been adopted to: (i) ensure that all shareholders of the Company are treated fairly in connection with any unsolicited take-over bid or acquisition of control of the Company (including by way of a “creeping” take-over bid); (ii) provide the Board and shareholders of the Company with adequate time to consider and evaluate any unsolicited take-over bid or similar transaction; and (iii) enable the Board to identify, solicit, develop and negotiate any value-enhancing alternatives, as may be considered appropriate, to any unsolicited take-over bids or similar transaction.
The SRP is similar to rights plans adopted by other Canadian companies and ratified by their shareholders. The SRP is not being adopted in response to any specific proposal or intention to acquire control of the Company, and the Board is not aware of any pending or threatened take-over bid for the Company.
Pursuant to the SRP, one right will attach to each issued and outstanding common share of the Company. Subject to the terms of SRP, the rights become exercisable if any person (together with certain related parties) becomes a beneficial owner of 20% or more of the outstanding common shares without complying with the “Permitted Bid” provisions of the SRP. In such event, holders of the rights (other than the acquiring person and its related parties) will be permitted to exercise their rights to purchase additional common shares at a substantial discount to the then market price of the common shares.
The SRP has been conditionally accepted by the Toronto Stock Exchange. While the SRP is effective as of the Effective Date, it is subject to ratification by the Company’s shareholders at a meeting of shareholders to be held within six months of its Effective Date. The Company currently expects to seek shareholder ratification of the SRP at a special meeting to be called and held within that six-month period (the “Meeting”). If the SRP is not ratified by shareholders within that six-month period, it, together with the outstanding rights, will terminate and cease to be effective.
A summary of the principal terms of the SRP will be included in the management proxy circular to be sent to shareholders in connection with the Meeting. The full text of the SRP is available under the Company’s profile on SEDAR+ at sedarplus.ca.
Forward-Looking Statements
This press release includes forward-looking statements about goeasy, including, but not limited to, its business operations, strategy and expected financial performance and condition. Forward-looking statements include, but are not limited to, statements with respect to forecasts for growth of the consumer loans receivable, annual revenue growth forecasts, strategic initiatives, new product offerings and new delivery channels, anticipated cost savings, planned capital expenditures, anticipated capital requirements and the Company’s ability to secure sufficient capital, liquidity of the Company, plans and references to future operations and results, critical accounting estimates, expected future yields and net charge off rates on loans, the dealer relationships, the size and characteristics of the Canadian non-prime lending market, the continued development of the type and size of competitors in the market, the inclusion of the SRP in the management information circular for any Meeting and the calling and the holding of any such Meeting and the timing thereof; and the approval, ratification and confirmation of the SRP. In certain cases, forward-looking statements that are predictive in nature, depend upon or refer to future events or conditions, and/or can be identified by the use of words such as “expect”, “continue”, “anticipate”, “intend”, “aim”, “plan”, “believe”, “budget”, “estimate”, “forecast”, “foresee”, “target” or negative versions thereof and similar expressions, and/or state that certain actions, events or results “may”, “could”, “would”, “might” or “will” be taken, occur or be achieved.
Forward-looking statements are based on certain factors and assumptions, including expected growth, results of operations and business prospects and are inherently subject to, among other things, risks, uncertainties and assumptions about the Company’s operations, economic factors and the industry generally. There can be no assurance that forward-looking statements will prove to be accurate as actual results and future events could differ materially from those expressed or implied by forward-looking statements made by the Company. Some important factors that could cause actual results to differ materially from those expressed in the forward-looking statements include, but are not limited to, goeasy’s ability to enter into new lease and/or financing agreements, collect on existing lease and/or financing agreements, open new locations on favourable terms, offer products which appeal to customers at a competitive rate, respond to changes in legislation, react to uncertainties related to regulatory action, raise capital under favourable terms, compete, manage the impact of litigation (including shareholder litigation), control costs at all levels of the organization and maintain and enhance the system of internal controls.
The Company cautions that the foregoing list is not exhaustive. These and other factors could cause actual results to differ materially from our expectations expressed in the forward-looking statements, and further details and descriptions of these and other factors are disclosed in the Company’s Management’s Discussion and Analysis (“MD&A”) for the year ended December 31, 2025, including under the section entitled “Risk Factors”.
The reader is cautioned to consider these, and other factors carefully and not to place undue reliance on forward-looking statements, which may not be appropriate for other purposes. The Company is under no obligation (and expressly disclaims any such obligation) to update or alter the forward-looking statements whether as a result of new information, future events or otherwise, unless required by law.
The Company particularly cautions that the Q2 2026 outlook and full year 2026 commentary presented above under the heading “Updated 2026 Outlook” (the “2026 Outlook Information”) constitutes forward-looking information and that in formulating its outlook, the Company makes a series of assumptions, which include, but are not limited to, assumptions about Environmental Conditions (Stability in the macroeconomic environment; Continued demand for non-prime credit across); Portfolio Growth (Loan originations adjust as underwriting criteria are tightened, particularly within indirect channels); Liquidity & Funding (The Company prioritizes liquidity and covenant compliance; Continued access to funding at acceptable rates; Continued strong free cash flow from its existing portfolio); Revenue Yield (Portfolio yield expected to be negatively impacted by bad debts on interest receivable; Business mix shift to include more unsecured personal loan originations at higher yields; Total portfolio yield and net charge off as a percentage of gross consumer loans receivable on its lending products are as estimated in the Company’s budget and strategic plan); Credit Performance (Net charge offs as a percentage of gross consumer loans receivable perform in line with the Company’ budget and forecasts generated through the use of its proprietary credit and underwriting models; The mixture of customers acquired through each of the Company’s acquisition channels and the mixture of new and existing borrowers are as estimated in the Company’s forecast); Investment Performance (No material changes are assumed in the fair value of investments, and no forecast is made regarding the timing of realization of the investment portfolio); and Mergers and Acquisitions (No mergers or acquisitions are contemplated within the outlook period). These assumptions and expectations are subject to a number of risks, including the following, as well as those set out the section entitled “Risk Factors” in the Company’s MD&A: Environmental & Market Conditions (Uncertainty in consumer demand or broader economic conditions may adversely impact loan originations and portfolio performance; Deterioration in employment levels or economic stability could negatively affect credit performance and increase net charge off rates; Competitive dynamics or pricing pressures may impact margins and growth); Access to Capital & Funding (The Company’s ability to access capital on acceptable terms and maintain adequate liquidity to support operations and strategic priorities); Regulatory Environment (Changes to laws and regulations governing consumer lending that could impact product offerings, pricing or operations); Credit Performance (A material increase in net charge off as a percentage of gross consumer loans receivable beyond expectations, including adverse performance from prior vintages or new originations); and Operating Execution (The Company’s ability to successfully execute on its Action Plan, including underwriting changes, and operating model alignment and platform consolidation; Risks associated with transitioning originations and customer portfolios toward the easyfinancial platform). The 2026 Outlook Information constitutes targets established by the Company and is subject to change as plans and business conditions vary. Accordingly, investors are cautioned not to place undue reliance on the 2026 Outlook Information. Actual results may differ materially.
About goeasy
goeasy Ltd. is a leading Canadian provider of non-prime consumer lending solutions, offering a suite of financial products through its easyfinancial, easyhome, and LendCare brands. goeasy offers unsecured and secured instalment loans, point-of-sale financing, and lease-to-own merchandise through its omni-channel model, which spans online, mobile, and hundreds of locations nationwide.
Driven by its team members’ dedication to expand access to credit for underserved communities and helping customers strengthen their financial futures, goeasy has proudly served more than 1.6 million customers while building an award-winning culture. Shares of goeasy Ltd. are listed on the Toronto Stock Exchange (TSX) under the symbol GSY. For more information, visit www.goeasy.com.
For investor inquiries, contact:
James Obright
Senior Vice President, Investor Relations & Capital Markets
investor_relations@goeasy.com
For media inquiries, contact:
Notes:
1 These are non-IFRS ratios. Refer to “Non-IFRS Measures and Other Financial Measures” section in this press release.
2 These are non-IFRS measures. Refer to “Non-IFRS Measures and Other Financial Measures” section in this press release.
3 These are capital management measures. Refer to “Non-IFRS Measures and Other Financial Measures” section in this press release.
4 These are supplementary financial measures. Refer to “Non-IFRS Measures and Other Financial Measures” section in this press release.
goeasy Ltd.
INTERIM CONDENSED CONSOLIDATED STATEMENTS OF FINANCIAL POSITION
(Unaudited)
(Expressed in thousands of Canadian dollars)
As At
As At
March 31,
December 31,
2026
2025
ASSETS
Cash
356,237
152,661
Accounts receivable
40,307
42,361
Prepaid expenses
13,877
9,159
Income taxes recoverable
109,467
90,559
Consumer loans receivable, net
4,982,870
5,155,360
Investments
23,117
29,103
Lease assets, net
33,851
36,656
Derivative financial assets
31,138
11,146
Deferred income tax assets
25,831
22,250
Property and equipment, net
28,634
30,788
Right-of-use assets, net
51,135
52,510
Intangible assets, net
103,914
104,142
Goodwill
21,310
21,310
TOTAL ASSETS
5,821,688
5,758,005
LIABILITIES AND SHAREHOLDERS’ EQUITY
Liabilities
Revolving credit facility
310,310
175,052
Accounts payable and other liabilities
79,585
107,842
Dividends payable
–
23,398
Unearned revenue
29,962
31,219
Accrued interest payable
84,970
68,533
Deferred income tax liabilities
11,064
5,367
Lease liabilities
57,840
59,451
Secured borrowings
71,612
88,783
Revolving securitization warehouse facilities
609,561
611,015
Derivative financial liabilities
14,402
46,107
Notes payable
3,751,143
3,690,818
TOTAL LIABILITIES
5,020,449
4,907,585
Shareholders’ equity
Share capital
431,264
430,325
Contributed surplus
25,244
26,782
Accumulated other comprehensive loss
(8,960)
(13,367)
Retained earnings
353,691
406,680
TOTAL SHAREHOLDERS’ EQUITY
801,239
850,420
TOTAL LIABILITIES AND SHAREHOLDERS’ EQUITY
5,821,688
5,758,005
goeasy Ltd.
INTERIM CONDENSED CONSOLIDATED STATEMENTS OF INCOME (LOSS)
(Unaudited)
(Expressed in thousands of Canadian dollars, except earnings (loss) per share)
Three Months Ended
March 31,
March 31,
2026
2025
Restated
REVENUE
Interest income
317,910
308,891
Lease revenue
20,045
22,242
Commissions earned
70,063
68,187
Charges and fees
4,839
5,603
412,857
404,923
OPERATING EXPENSES
BAD DEBTS
267,200
145,023
OTHER OPERATING EXPENSES
Salaries and benefits
52,664
49,463
Share-based compensation
(1,062)
4,441
Technology costs
11,370
12,220
Underwriting and collections
9,385
7,162
Occupancy
5,714
5,672
Restructuring charges
4,763
–
Advertising and promotion
3,263
8,686
Other expenses
10,690
7,681
96,787
95,325
DEPRECIATION AND AMORTIZATION
Depreciation of lease assets
6,485
6,983
Amortization of intangible assets
5,525
5,646
Depreciation of right-of-use assets
5,342
5,297
Depreciation of property and equipment
2,642
2,597
19,994
20,523
TOTAL OPERATING EXPENSES
383,981
260,871
OPERATING INCOME
28,876
144,052
OTHER LOSS
(5,986)
–
FINANCE COSTS
(93,163)
(89,651)
INCOME (LOSS) BEFORE INCOME TAXES
(70,273)
54,401
INCOME TAX EXPENSE (RECOVERY)
Current
(18,908)
30,896
Deferred
1,624
(15,204)
(17,284)
15,692
NET INCOME (LOSS)
(52,989)
38,709
BASIC EARNINGS (LOSS) PER SHARE
(3.22)
2.30
DILUTED EARNINGS (LOSS) PER SHARE
(3.22)
2.28
SUMMARY OF FINANCIAL RESULTS BY REPORTABLE SEGMENT
(Expressed in thousands of Canadian dollars, except earnings per share)
Three Months Ended March 31, 2026
easyfinancial
easyhome
Corporate
Total
Revenue
Interest income
303,582
14,328
–
317,910
Lease revenue
–
20,045
–
20,045
Commissions earned
66,006
4,057
–
70,063
Charges and fees
4,067
772
–
4,839
373,655
39,202
–
412,857
Operating expenses
Bad debts
256,799
10,401
–
267,200
Other operating expenses
63,908
12,704
20,175
96,787
Depreciation and amortization
9,916
8,488
1,590
19,994
330,623
31,593
21,765
383,981
Operating income (loss)
43,032
7,609
(21,765)
28,876
Other loss
(5,986)
Finance costs
(93,163)
Loss before income taxes
(70,273)
Income tax recovery
(17,284)
Net loss
(52,989)
Diluted loss per share
(3.22)
Three Months Ended March 31, 2025
(As restated)
easyfinancial
easyhome
Corporate
Total
Revenue
Interest income
298,408
10,483
–
308,891
Lease revenue
–
22,242
–
22,242
Commissions earned
64,625
3,562
–
68,187
Charges and fees
4,848
755
–
5,603
367,881
37,042
–
404,923
Operating expenses
Bad debts
140,467
4,556
–
145,023
Other operating expenses
61,526
13,924
19,875
95,325
Depreciation and amortization
9,737
9,063
1,723
20,523
211,730
27,543
21,598
260,871
Operating income (loss)
156,151
9,499
(21,598)
144,052
Other income
–
Finance costs
(89,651)
Income before income taxes
54,401
Income tax expense
15,692
Net income
38,709
Diluted earnings per share
2.28
SUMMARY OF FINANCIAL RESULTS AND KEY PERFORMANCE INDICATORS
Three Months Ended
($ in 000’s except earnings per share and percentages)
March 31,
2026
March 31,
2025
(As restated)
Variance
$ / bps
Variance
% Change
Summary Financial Results
Revenue
412,857
404,923
7,934
2.0 %
Bad debts
267,200
145,023
122,177
84.2 %
Other operating expenses
96,787
95,325
1,462
1.5 %
EBITDA1
36,399
157,592
(121,193)
(76.9 %)
EBITDA margin1
8.8 %
38.9 %
(3,010 bps)
(77.4 %)
Depreciation and amortization
19,994
20,523
(529)
(2.6 %)
Operating income
28,876
144,052
(115,176)
(80.0 %)
Operating margin
7.0 %
35.6 %
(2,860 bps)
(80.3 %)
Other income (loss)
(5,986)
–
(5,986)
(100.0 %)
Finance costs
93,163
89,651
3,512
3.9 %
Effective income tax rate
24.6 %
28.8 %
(420 bps)
(14.7 %)
Net income (loss)
(52,989)
38,709
(91,698)
(236.9 %)
Diluted earnings (loss) per share
(3.22)
2.28
(5.50)
(241.2 %)
Return on receivables
(3.9 %)
3.3 %
(720 bps)
(218.2 %)
Return on assets
(3.7 %)
2.9 %
(660 bps)
(227.6 %)
Return on equity
(25.7 %)
13.4 %
(3,910 bps)
(291.8 %)
Return on tangible common equity1
(26.8 %)
17.9 %
(4,470 bps)
(249.7 %)
Adjusted Financial Results1,2
Other operating expenses
98,509
102,216
(3,707)
(3.6 %)
Efficiency ratio
24.5 %
26.1 %
(160 bps)
(6.1 %)
Operating income
36,914
147,419
(110,505)
(75.0 %)
Operating margin
8.9 %
36.4 %
(2,750 bps)
(75.6 %)
Net income (loss)
(31,313)
59,349
(90,662)
(152.8 %)
Diluted earnings per share
(1.90)
3.49
(5.39)
(154.4 %)
Return on receivables
(2.3 %)
5.0 %
(730 bps)
(146.0 %)
Return on assets
(2.2 %)
4.5 %
(670 bps)
(148.9 %)
Return on equity
(15.2 %)
20.5 %
(3,570 bps)
(174.1 %)
Return on tangible common equity
(16.6 %)
25.9 %
(4,250 bps)
(164.1 %)
Key Performance Indicators
Segment Financials
easyfinancial revenue
373,655
367,881
5,774
1.6 %
easyfinancial operating margin
11.5 %
42.4 %
(3,090 bps)
(72.9 %)
easyhome revenue
39,202
37,042
2,160
5.8 %
easyhome operating margin
19.4 %
25.6 %
(620 bps)
(24.2 %)
Portfolio Indicators
Gross consumer loans receivable
5,363,456
4,795,387
568,069
11.8 %
Growth in consumer loans receivable
(150,011)
192,950
(342,961)
(177.7 %)
Gross loan originations
551,314
676,769
(125,455)
(18.5 %)
Total yield on consumer loans (including ancillary products)1
27.9 %
31.2 %
(330 bps)
(10.5 %)
Net charge offs as a percentage of average gross consumer loans receivable1
17.8 %
8.9 %
890 bps
100.2 %
Cash provided by operations before net principal written1
560,108
410,747
149,361
36.4 %
Potential monthly leasing revenue1
5,820
6,727
(907)
(13.5 %)
1 EBITDA, adjusted other operating expenses, adjusted operating income (loss), adjusted net income (loss) and cash provided by operations before net principal written are non-IFRS measures. EBITDA margin, efficiency ratio, adjusted operating margin, adjusted diluted earnings (loss) per share, adjusted return on receivables, adjusted return on equity, adjusted return on assets, reported and adjusted return on tangible common equity, total yield on consumer loans (including ancillary products) and net charge offs as a percentage of average gross consumer loans receivable are non-IFRS ratios. See description in sections “Portfolio Analysis”, “Key Performance Indicators and Non-IFRS Measures” and “Financial Condition”.
2 Adjusting items are discussed in the “Key Performance Indicators and Non-IFRS Measures” section.
Non-IFRS Measures and Other Financial Measures
The Company uses a number of financial measures to assess its performance. Some of these measures are not calculated in accordance with International Financial Reporting Standards (IFRS) as issued by International Accounting Standards Board (IASB), are not identified by IFRS and do not have standardized meanings that would ensure consistency and comparability among companies using these measures. The Company believes that non-IFRS measures are useful in assessing ongoing business performance and provide readers with a better understanding of how management assesses performance. These non-IFRS measures are used throughout this press release and listed below. An explanation of the composition of non-IFRS measures and other financial measures can be found in the Company’s MD&A, available on www.sedarplus.ca.
Adjusted Net Income (Loss) and Adjusted Diluted Earnings (Loss) Per Share
Adjusted net income (loss) is a non-IFRS measure and adjusted diluted earnings (loss) per share is a non-IFRS ratio. Refer to “Key Performance Indicators and Non-IFRS Measures” section on page 33 of the Company’s MD&A for the three-month period ended March 31, 2026. Items used to calculate adjusted net income (loss) and adjusted diluted earnings (loss) per share for the three-month periods ended March 31, 2026 and 2025 include those indicated in the chart below:
Three Months Ended
($ in 000’s except earnings per share)
March 31,
2026
March 31,
2025
(As restated)
Net income (loss)
(52,989)
38,709
Impact of adjusting items
Other operating expenses
Restructuring charges1
4,763
–
Integration costs2
–
92
Depreciation and amortization
Amortization of acquired intangible assets3
3,275
3,275
Other loss 4
5,986
–
Finance costs
Fair value change on prepayment options related to Notes Payable5
13,309
24,714
Total pre-tax impact of adjusting items
27,333
28,081
Income tax impact of above adjusting items
(5,657)
(7,441)
After-tax impact of adjusting items
21,676
20,640
Adjusted net income (loss)
(31,313)
59,349
Weighted average number of diluted shares outstanding
16,456
17,007
Diluted earnings (loss) per share
(3.22)
2.28
Per share impact of adjusting items
1.32
1.21
Adjusted diluted earnings (loss) per share
(1.90)
3.49
Adjusting item related to restructuring charges
1 The Company completed a restructuring exercise in March 2026 and incurred a total of $4.8 million related to severance costs, settlement claims and consulting fees.
Adjusting items related to the LendCare acquisition
2 Integration costs related to representation and warranty insurance costs, and other integration costs related to the acquisition of LendCare.
3 Amortization of the $131 million intangible asset related to the acquisition of LendCare, with an estimated useful life of ten years.
Adjusting item related to other loss
4 For the three-month period ended March 31, 2026, net investment loss was due to fair value changes in the Company’s investments.
Adjusting item related to prepayment options embedded in the Notes Payable
5 For the three-month periods ended March 31, 2026 and 2025, the Company recognized a fair value change on the prepayment options related to Notes Payable.
Adjusted Other Operating Expenses and Efficiency Ratio
Adjusted other operating expenses is a non-IFRS measure and efficiency ratio is a non-IFRS ratio. Refer to “Key Performance Indicators and Non-IFRS Measures” section on page 33 of the Company’s MD&A for the three-month period ended March 31, 2026. Items used to calculate adjusted other operating expenses and efficiency ratio for the three-month periods ended March 31, 2026 and 2025 include those indicated in the chart below:
Three Months Ended
($ in 000’s except earnings per share)
March 31,
2026
March 31,
2025
(As restated)
Other operating expenses
96,787
95,325
Impact of adjusting items1
Other operating expenses
Restructuring charges
(4,763)
–
Integration costs
–
(92)
Depreciation and amortization
Depreciation of lease assets
6,485
6,983
Total impact of adjusting items
1,722
6,891
Adjusted other operating expenses
98,509
102,216
Total revenue
412,857
404,923
Less: Bad debts on interest receivable
(10,879)
(13,739)
Adjusted Financial Revenue
401,978
391,184
Efficiency ratio
24.5 %
26.1 %
1 For explanation of adjusting items, refer to the corresponding “Adjusted Net Income and Adjusted Diluted Earnings Per Share” section.
Adjusted Operating Margin
Adjusted operating margin is a non-IFRS measure and adjusted operating margin is a non-IFRS ratio. Refer to “Key Performance Indicators and Non-IFRS Measures” section on page 33 of the Company’s MD&A for the three-month period ended March 31, 2026. Items used to calculate adjusted operating income (loss) and adjusted operating margins for the three-month periods ended March 31, 2026 and 2025 include those indicated in the chart below:
Three Months Ended
($ in 000’s except percentages)
March 31,
2026
March 31,
2026 (adjusted)
March 31,
2025
(As restated)
March 31,
2025
(adjusted)
(As restated)
easyfinancial
Operating income (loss)
43,032
43,032
156,151
156,151
Divided by revenue
373,655
373,655
367,881
367,881
easyfinancial operating margin
11.5 %
11.5 %
42.4 %
42.4 %
easyhome
Operating income
7,609
7,609
9,499
9,499
Divided by revenue
39,202
39,202
37,042
37,042
easyhome operating margin
19.4 %
19.4 %
25.6 %
25.6 %
Total
Operating income (loss)
28,876
28,876
144,052
144,052
Other operating expenses1
Restructuring charges
–
4,763
–
–
Integration costs
–
–
–
92
Depreciation and amortization1
Amortization of acquired intangible assets
–
3,275
–
3,275
Adjusted operating income (loss)
28,876
36,914
144,052
147,419
Divided by revenue
412,857
412,857
404,923
404,923
Total operating margin
7.0 %
8.9 %
35.6 %
36.4 %
1 For explanation of adjusting items, refer to the corresponding “Adjusted Net Income and Adjusted Diluted Earnings Per Share” section.
Earnings before Interest, Taxes, Depreciation and Amortization (“EBITDA”) and EBITDA Margin
EBITDA is a non-IFRS measure, while EBITDA margin is a non-IFRS ratio. Refer to “Key Performance Indicators and Non-IFRS Measures” section on page 33 of the Company’s MD&A for the three-month period ended March 31, 2026. Items used to calculate EBITDA and EBITDA margin for the three-month periods ended March 31, 2026 and 2025 include those indicated in the chart below:
Three Months Ended
($ in 000’s except percentages)
March 31,
2026
March 31,
2025
(As restated)
Net income (loss)
(52,989)
38,709
Finance cost
93,163
89,651
Income tax expense
(17,284)
15,692
Depreciation and amortization
19,994
20,523
Depreciation of lease assets
(6,485)
(6,983)
EBITDA
36,399
157,592
Divided by revenue
412,857
404,923
EBITDA margin
8.8 %
38.9 %
Cash Provided by Operating Activities before Net Principal Written
Cash provided by operating activities before net principal written is a non-IFRS measure. Refer to “Key Performance Indicators and Non-IFRS Measures” section on page 33 of the Company’s MD&A for the three-month period ended March 31, 2026. Items used to calculate cash provided by operating activities before net principal written for the three-month periods ended March 31, 2026 and 2025 include those indicated in the chart below:
Three Months Ended
($ in 000’s)
March 31,
2026
March 31,
2025
(As restated)
Cash provided by (used in) operating activities
122,296
(180,312)
Net principal written
437,812
591,059
Cash provided by operating activities before net principal written
560,108
410,747
Adjusted Return on Receivables
Adjusted return on receivables is a non-IFRS ratio. Refer to “Key Performance Indicators and Non-IFRS Measures” section on page 33 of the Company’s MD&A for the three-month period ended March 31, 2026. Items used to calculate adjusted return on receivables for the three-month periods ended March 31, 2026 and 2025 include those indicated in the chart below:
Three Months Ended
($ in 000’s except percentages)
March 31,
2026
March 31,
2026
(adjusted)
March 31,
2025
(As restated)
March 31,
2025
(adjusted)
(As restated)
Net income (loss)
(52,989)
(52,989)
38,709
38,709
After-tax impact of adjusting items1
–
21,676
–
20,640
Adjusted net income (loss)
(52,989)
(31,313)
38,709
59,349
Multiplied by number of periods in a year
X 4
X 4
X 4
X 4
Divided by average gross consumer loans receivable
5,454,278
5,454,278
4,712,699
4,712,699
Return on receivables
(3.9 %)
(2.3 %)
3.3 %
5.0 %
1 For explanation of adjusting items, refer to the corresponding “Adjusted Net Income and Adjusted Diluted Earnings Per Share” section.
Adjusted Return on Assets
Adjusted return on assets is a non-IFRS ratio. Refer to “Key Performance Indicators and Non-IFRS Measures” section on page 33 of the Company’s MD&A for the three-month period ended March 31, 2026. Items used to calculate adjusted return on assets for the three-month periods ended March 31, 2026 and 2025 include those indicated in the chart below:
Three Months Ended
($ in 000’s except percentages)
March 31,
2026
March 31,
2026
(adjusted)
March 31,
2025
(As restated)
March 31,
2025
(adjusted)
(As restated)
Net income (loss)
(52,989)
(52,989)
38,709
38,709
After-tax impact of adjusting items1
–
21,676
–
20,640
Adjusted net income (loss)
(52,989)
(31,313)
38,709
59,349
Multiplied by number of periods in a year
X 4
X 4
X 4
X 4
Divided by average total assets for the period
5,789,846
5,789,846
5,276,581
5,276,581
Return on assets
(3.7 %)
(2.2 %)
2.9 %
4.5 %
1 For explanation of adjusting items, refer to the corresponding “Adjusted Net Income and Adjusted Diluted Earnings Per Share” section.
Adjusted Return on Equity
Adjusted return on equity is a non-IFRS ratio. Refer to “Key Performance Indicators and Non-IFRS Measures” section on page 33 of the Company’s MD&A for the three-month period ended March 31, 2026. Items used to calculate adjusted return on equity for the three-month periods ended March 31, 2026 and 2025 include those indicated in the chart below:
Three Months Ended
($ in 000’s except percentages)
March 31,
2026
March 31,
2026
(adjusted)
March 31,
2025
(As restated)
March 31,
2025
(adjusted)
(As restated)
Net income (loss)
(52,989)
(52,989)
38,709
38,709
After-tax impact of adjusting items1
–
21,676
–
20,640
Adjusted net income (loss)
(52,989)
(31,313)
38,709
59,349
Multiplied by number of periods in a year
X 4
X 4
X 4
X 4
Divided by average shareholders’ equity for the period
825,829
825,829
1,157,511
1,157,511
Return on equity
(25.7 %)
(15.2 %)
13.4 %
20.5 %
1 For explanation of adjusting items, refer to the corresponding “Adjusted Net Income and Adjusted Diluted Earnings Per Share” section.
Reported and Adjusted Return on Tangible Common Equity
Reported and adjusted return on tangible common equity are non-IFRS ratios. Refer to “Key Performance Indicators and Non-IFRS Measures” section on page 33 of the Company’s MD&A for the three-month period ended March 31, 2026. Items used to calculate reported and adjusted return on tangible common equity for the three-month periods ended March 31, 2026 and 2025 include those indicated in the chart below:
Three Months Ended
($ in 000’s except percentages)
March 31,
2026
March 31,
2026
(adjusted)
March 31,
2025
(As restated)
March 31,
2025
(adjusted)
(As restated)
Net income (loss)
(52,989)
(52,989)
38,709
38,709
Amortization of acquired intangible assets
3,275
3,275
3,275
3,275
Income tax impact of the above item
(868)
(868)
(868)
(868)
Net income before amortization of acquired intangible assets, net of income tax
(50,582)
(50,582)
41,116
41,116
Impact of adjusting items1
Other operating expenses
Restructuring charges
–
4,763
–
–
Integration costs
–
–
–
92
Other loss
–
5,986
–
–
Finance costs
Fair value change on prepayment options related to Notes Payable
–
13,309
–
24,714
Total pre-tax impact of adjusting items
(50,582)
24,058
–
24,806
Income tax impact of above adjusting items
–
(4,789)
–
(6,573)
After-tax impact of adjusting items
–
19,269
–
18,233
Adjusted net income (loss)
(50,582)
(31,313)
41,116
59,349
Multiplied by number of periods in a year
X 4
X 4
X 4
X 4
Average shareholders’ equity
825,829
825,829
1,157,511
1,157,511
Average goodwill
(21,310)
(21,310)
(180,923)
(180,923)
Average acquired intangible assets2
(68,229)
(68,229)
(81,329)
(81,329)
Average related deferred tax liabilities
18,081
18,081
21,552
21,552
Divided by average tangible common equity
754,371
754,371
916,811
916,811
Return on tangible common equity
(26.8 %)
(16.6 %)
17.9 %
25.9 %
1 For explanation of adjusting items, refer to the corresponding “Adjusted Net Income and Adjusted Diluted Earnings Per Share” section.
2 Excludes intangible assets relating to software
easyhome Financial Revenue
easyhome financial revenue is a non-IFRS measure. It is calculated as total company revenue less easyfinancial revenue and leasing revenue. The Company believes that easyhome financial revenue is an important measure of the performance of the easyhome segment. Items used to calculate easyhome financial revenue for the three-month periods ended March 31, 2026 and 2025 include those indicated in the chart below:
($in 000’s)
Three Months Ended
March 31,
2026
March 31,
2025
(As restated)
Total company revenue
412,857
404,923
Less: easyfinancial revenue
(373,655)
(367,881)
Less: leasing revenue
(21,273)
(23,515)
easyhome financial revenue
17,929
13,527
Total Yield on Consumer Loans as a Percentage of Average Gross Consumer Loans Receivable
Total yield on consumer loans as a percentage of average gross consumer loans receivable is a non-IFRS ratio. See description in section “Portfolio Analysis” on page 20 of the Company’s MD&A for the three-month period ended March 31, 2026. Items used to calculate total yield on consumer loans as a percentage of average gross consumer loans receivable for the three-month periods ended March 31, 2026 and 2025 include those indicated in the chart below:
Three Months Ended
($ in 000’s except percentages)
March 31,
2026
March 31,
2025
(As restated)
Total Company revenue
412,857
404,923
Less: Leasing revenue
(21,273)
(23,515)
Less: Bad debts on interest income
(10,879)
(13,739)
Adjusted Financial revenue
380,705
367,669
Multiplied by number of periods in a year
X 4
X 4
Divided by average gross consumer loans receivable
5,454,278
4,712,699
Total yield on consumer loans as a percentage of average gross consumer loans receivable (annualized)
27.9 %
31.2 %
Net Charge Offs as a Percentage of Average Gross Consumer Loans Receivable
Net charge Offs as a percentage of average gross consumer loans receivable is a non-IFRS ratio. See description in section “Portfolio Analysis” on page 20 of the Company’s MD&A for the three-month period ended March 31, 2026. Items used to calculate net charge Offs as a percentage of average gross consumer loans receivable for the three-month periods ended March 31, 2026 and 2025 include those indicated in the chart below:
Three Months Ended
($in 000’s except percentages)
March 31,
2026
March 31,
2025
(As restated)
Net charge offs on gross consumer loans receivable
242,581
104,758
Multiplied by number of periods in a year
X 4
X 4
Divided by average gross consumer loans receivable
5,454,278
4,712,699
Net charge offs as a percentage of average gross consumer loans receivable (annualized)
17.8 %
8.9 %
Net Principal Written and Percentage Net Principal Written to New Customers
Net principal written (Net loan advances) is a non-IFRS measure. See description in section “Portfolio Analysis” on page 20 of the Company’s MD&A for the three-month period ended March 31, 2026. The percentage of net loan advances to new customers is a non-IFRS ratio. It is calculated as loan originations to new customers divided by the net principal written. The Company uses percentage of net loan advances to new customers, among other measures, to assess the operating performance of its lending business. Items used to calculate the percentage of net loan advances to new customers for the three-month periods ended for the three-month period ended March 31, 2026 include those indicated in the chart below:
Three Months Ended
($ in 000’s)
March 31,
2026
March 31,
2025
Gross loan originations
551,314
676,769
Loan originations to new customers
312,694
431,949
Loan originations to existing customers
238,620
244,820
Less: Proceeds applied to repay existing loans
(113,502)
(85,710)
Net advance to existing customers
125,118
159,110
Net principal written
437,812
591,059
Percentage net advances to new customers
71.4 %
73.1 %
Debt to Adjusted Tangible Equity
Debt to adjusted tangible equity is a capital management measure. Refer to “Financial Condition” section on page 41 of the Company’s MD&A for the three-month period ended March 31, 2026.
Weighted Average Interest Rate
Weighted average interest rate is a supplementary financial measure. It is calculated as the sum of individual loan balance multiplied by interest rate divided by gross consumer loans receivable.
SOURCE goeasy Ltd.
ST. PAUL, Minn., May 12, 2026 /PRNewswire/ — At today’s Annual Meeting of Shareholders, 3M (NYSE:MMM) shareholders overwhelmingly supported each of the proposals recommended for approval by the company.
Preliminary Shareholder Voting Results
3M shareholders today voted on the following business items:
1) Shareholders supported 10 directors for one-year terms:
David P. Bozeman, President, Chief Executive Officer and Director, C.H. Robinson Worldwide, Inc.Thomas “Tony” K. Brown, retired Group Vice President, Global Purchasing, Ford Motor CompanyWilliam M. “Bill” Brown, Chairman of the Board and Chief Executive Officer, 3M CompanyAudrey Choi, retired Chief Sustainability Officer and Management Committee Member, Morgan StanleyAnne H. Chow, retired Chief Executive Officer, AT&T BusinessJames R. Fitterling, Chair and Chief Executive Officer, Dow Inc.Suzan Kereere, President, Global Markets, PayPalNeil G. Mitchill, Jr., Executive Vice President and Chief Financial Officer, RTX CorporationPedro J. Pizarro, President, Chief Executive Officer and Director, Edison InternationalThomas W. Sweet, retired Chief Financial Officer, Dell Technologies
2) Shareholders supported the appointment of PricewaterhouseCoopers LLP as 3M’s independent registered public accounting firm for 2026.
3) Shareholders supported, on an advisory basis, executive compensation, as described in the company’s Notice of Annual Meeting and Proxy Statement.
3M will disclose the final voting results on each item of business properly presented at the Annual Meeting on Form 8-K to be filed with the SEC.
About 3M
3M (NYSE: MMM) is focused on transforming industries around the world by applying science and creating innovative, customer-focused solutions. Our multi-disciplinary team is working to solve tough customer problems by leveraging diverse technology platforms, differentiated capabilities, global footprint, and operational excellence. Discover how 3M is shaping the future at 3M.com/news.
Please note that the company announces material financial, business and operational information using the 3M investor relations website, SEC filings, press releases, public conference calls and webcasts. The company also uses the 3M News Center and social media to communicate with our customers and the public about the company, products and services and other matters. It is possible that the information 3M posts on the News Center and social media could be deemed to be material information. Therefore, the company encourages investors, the media and others interested in 3M to review the information posted on 3M’s News Center and the social media channels such as @3M or @3MNews.
Contacts
3M
Investor Contact:
Diane Farrow, 612-202-2449
Media Contact:
3Mnews@mmm.com
View original content to download multimedia:https://www.prnewswire.com/news-releases/3m-annual-meeting-results-302770102.html
SOURCE 3M Company
Bermuda to transition ‘key’ financial services to Stellar blockchain
Brightstar Lottery Delivers Enhanced Retail Central System to Lottotech in Mauritius
goeasy Ltd. Reports Results for the First Quarter 2026
Send Rakhi to UK swiftly with UK Gifts Portal
Whiteboard Series with NEAR | Ep: 45 Joel Thorstensson from ceramic.network
New Gooseneck Omni Antennas Offer Enhanced Signals in a Durable Package
Why You Should Build on #NEAR – Co-founder Illia Polosukhin at CV Labs
Whiteboard Series with NEAR | Ep: 45 Joel Thorstensson from ceramic.network
NEAR End of Year Town Hall 2021: The Open Web World, MetaBUILD 2 Hackathon and 2021 recap
Trending
-
Coin Market5 days agoAptos Foundation, Aptos Labs commit $50M to development as it eyes AI agent future
-
Near Videos4 days agoNEAR Origin Story Part 3
-
Coin Market4 days agoSpot Bitcoin ETFs log 6th straight week of net inflows for first time in 9 months
-
Coin Market5 days ago
CLARITY Act support carries electoral boost, HarrisX poll finds
-
Coin Market3 days agoSantiment flags risk as crypto bullish talk spikes while BTC holds $80K
-
Technology5 days agoeSign.AI Named Sole Electronic Signature Technology Provider for Hong Kong Government’s CorpID Project, Building the Foundation for Digital Signing Infrastructure in Hong Kong
-
Coin Market3 days agoCZ says crypto exchange rivals opposed his pardon bid
-
Coin Market5 days ago
Bitcoin bulls target $115K by December: Does data back the expectation?
