As Official Title Sponsor, TECNO joins hands with SAFF to inspire the next generation through football, innovation, and meaningful fan experiences.
DHAKA, Bangladesh, July 25, 2026 /PRNewswire/ — TECNO, an AI-driven innovative technology brand, officially announced its title sponsorship of the SAFF Championship Bangladesh 2026, South Asia’s premier international football tournament, during the tournament’s official launch ceremony in Dhaka.
Scheduled to take place from 4–17 November 2026, the championship will bring together South Asia’s leading national teams, celebrating the region’s passion for football while strengthening friendship, sporting excellence, and regional unity.
The partnership marks another milestone in TECNO’s global football journey while reinforcing the brand’s long-term commitment to South Asia—one of its most important strategic markets. Guided by its brand spirit, “Stop At Nothing,” TECNO believes football embodies the same values that define the brand: ambition, resilience, innovation, and the courage to pursue every dream.
A New Chapter for South Asian Football
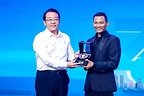
The title sponsorship was officially announced during the SAFF Championship Bangladesh 2026 Official Launch Press Conference held in Dhaka. The event brought together representatives from the South Asian Football Federation (SAFF), the Bangladesh Football Federation (BFF), TECNO’s global and Bangladesh leadership teams, SAFF Member Associations, national team representatives, members of the diplomatic community, media, and digital creators to celebrate the official launch of the championship and TECNO’s role as its Title Sponsor.
Mr. Purushottam Kattel, General Secretary of SAFF, said: “The SAFF Championship represents the highest stage of football in South Asia, bringing together our Member Associations through competition, friendship, and a shared passion for the game. Today, as we unveil the identity of the SAFF Championship Bangladesh 2026, we are delighted to welcome TECNO as our Title Sponsor. This partnership reflects a shared commitment to elevating football across the region, and together we look forward to delivering a championship that inspires millions of supporters and creates lasting memories for South Asian football.”
Following the official logo unveiling ceremony, SAFF and TECNO exchanged the Title Sponsorship Agreement, formally launching their collaboration for the SAFF Championship Bangladesh 2026 and reaffirming their shared commitment to delivering an outstanding football experience for fans across South Asia.
A Shared Vision for Football
Delivering a recorded message during the ceremony, Guo Lei, General Manager of TECNO, reaffirmed the brand’s belief that football is a powerful platform for inspiring young people, connecting communities, and bringing innovation closer to fans.
“South Asia is home to one of the world’s youngest and most passionate football communities. Football has the unique power to bring people together beyond borders and cultures. We are proud to continue TECNO’s football journey through the SAFF Championship Bangladesh 2026 and look forward to working with SAFF to create unforgettable experiences for millions of football fans across the region.”
Speaking on behalf of TECNO Bangladesh, Rezwanul Hoque, CEO of Ismartu Technology BD Limited, said: “Football has become an important part of TECNO’s global journey because it reflects the values we believe in: passion, resilience, and the courage to dream bigger. Following our partnership with the Bangladesh Football Federation during the AFC Asian Cup Qualifiers, we are honoured to continue that journey as the Title Sponsor of the SAFF Championship Bangladesh 2026. Guided by our brand spirit, ‘Stop At Nothing,’ we look forward to working with SAFF and BFF to create a championship that inspires players, unites communities, and leaves a lasting legacy for football across South Asia.”
Welcoming the championship to Bangladesh, Mr. Fahad Karim, Vice President of the Bangladesh Football Federation (BFF), highlighted Bangladesh’s role as the host nation and officially marked the beginning of the journey toward the championship this November.
“Hosting the SAFF Championship 2026 is a proud moment for Bangladesh and an important milestone for football in our country. Today marks the beginning of our journey toward November, and we look forward to welcoming our fellow South Asian nations to Bangladesh for a championship that celebrates football, friendship, and regional unity. We are delighted to welcome TECNO as the Title Sponsor, and together with SAFF, our Member Associations, and our partners, we look forward to making this a memorable tournament for players, supporters, and the entire South Asian football community.”
TECNO’s Global Football Journey Continues
Football has been at the heart of TECNO’s global brand journey for nearly a decade. Through partnerships with Manchester City Football Club, the CAF Africa Cup of Nations, and the AFC Club Competitions, TECNO has consistently used football as a platform to inspire young people, connect communities, and celebrate the power of sport.
In Bangladesh, TECNO strengthened that commitment through its title sponsorship of the AFC Asian Cup Qualifiers in partnership with the Bangladesh Football Federation. The overwhelming passion shown by Bangladeshi supporters reaffirmed the country’s vibrant football culture and inspired TECNO to deepen its engagement with the sport.
The SAFF Championship Bangladesh 2026 represents the next chapter in TECNO’s football journey, reinforcing the brand’s commitment to South Asia and its rapidly growing community of young football fans.
Growing Together with Bangladesh
Bangladesh continues to be one of TECNO’s most important strategic markets. Alongside its growing smartphone business, the brand is expanding its AI ecosystem and strengthening long-term investments in retail, innovation, and local partnerships—reflecting its confidence in the country’s digital future and youthful consumer base.
Beyond technology, TECNO remains committed to empowering the next generation by supporting platforms that encourage ambition, creativity, and meaningful human connection.
Football Meets AI Innovation
Throughout the championship, TECNO plans to showcase AI-powered experiences designed to bring fans closer to the game. Powered by Ella, TECNO’s AI assistant, these experiences are intended to demonstrate how intelligent technology can enrich football engagement through interactive match information, smarter fan interactions, and immersive digital experiences.
By combining the emotional power of football with accessible AI innovation, TECNO and SAFF share a common vision of inspiring young people, strengthening communities, and creating richer experiences for football fans across South Asia.
As the countdown to November 2026 begins, TECNO, SAFF, and the Bangladesh Football Federation share a common ambition—to deliver a championship that celebrates the passion of South Asian football while inspiring the next generation through innovation, partnership, and the enduring spirit of “Stop At Nothing.”
Photo – https://mma.prnewswire.com/media/3007765/image1.jpg
Photo – https://mma.prnewswire.com/media/3007766/image2.jpg
Logo – https://mma.prnewswire.com/media/2724870/TECNO_Logo.jpg
View original content:https://www.prnewswire.com/in/news-releases/tecno-unveiled-as-title-sponsor-of-the-saff-championship-bangladesh-2026-bringing-ai-innovation-to-south-asian-football-302834662.html


 Near Videos4 days ago

 Technology5 days ago
 Coin Market5 days ago
 Technology4 days ago
 Coin Market5 days ago
 Technology5 days ago
 Technology5 days ago