
Technology
Galaxy Announces Third Quarter 2024 Financial Results
Published
2 years agoon
By
Subsequent to quarter-end, Galaxy executed a non-binding term sheet with a U.S.-based hyperscaler to host high-performance computing at its Helios campus in West Texas.
NEW YORK, Nov. 7, 2024 /CNW/ – Galaxy Digital Holdings Ltd. (TSX: GLXY) (the “Company” or “GDH Ltd.”) today released financial results for the three months and nine months ended September 30, 2024, for both itself and Galaxy Digital Holdings LP (the “Partnership” or “GDH LP”). In this press release, a reference to “Galaxy”, “we”, “our” and similar words refer to GDH Ltd., its subsidiaries and affiliates including GDH LP, or any one of them, as the context requires.
Corporate and Business Updates
Financial Highlights: In the third quarter, Galaxy reported a net loss of $54 million, representing a significant narrowing of our net loss from the second quarter. We generated operating revenue growth of over 30% quarter-over-quarter (“QoQ”), despite industry spot trading volumes declining 15% and ether declining 24% in the quarter. For the nine months ended September 30, 2024, Galaxy reported net income of $191 million, driven by strong operating performance and positive digital asset markets. Galaxy’s equity capital was $2.1 billion as of September 30, 2024.
Helios: Subsequent to quarter-end, Galaxy executed a non-binding term sheet with a U.S.-based hyperscaler to host high-performance computing at its Helios campus in West Texas. The term sheet includes options to allocate all of Helios’ 800 megawatts of currently approved power capacity to HPC hosting and support. The consummation of the transaction is subject to execution of definitive documents, customary due diligence and approvals of the parties.
US Listing and Reorganization: Galaxy continues to work on completing its proposed reorganization and domestication to become a Delaware-incorporated company and subsequently list on the Nasdaq, upon completion of ongoing SEC review and subject to stock exchange, shareholder and applicable regulatory approvals of such transactions. On July 26, 2024, Galaxy filed an amendment to its registration statement responding to SEC comments, which is under review.
Select GDH LP Financial Metrics
Q3 2024
Q2 2024
Q/Q % Change
Q3 YTD
Equity Capital
$2,081M
$2,129M
(2) %
—
Liquidity
$1,506M
$1,312M
15 %
—
Cash & Net Stablecoins1
$475M
$409M
16 %
—
Net Digital Assets Excluding Stablecoins2
$562M
$485M
16 %
—
Spot Bitcoin and Ethereum ETFs
$469M
$418M
12 %
—
Net Income (loss)
($54M)
($177M)
N.M.3
$191M
Book Value Per Share in CAD4
$8.24 CAD
$8.45 CAD
(2) %
—
Note: Throughout this document, totals may not sum due to rounding. Quarter-over-quarter and year-over-year percentage change calculations are based on unrounded results.
(1)
Includes Cash Equivalents.
(2)
Refer to page 16 of this release for a breakout of our net digital assets position; Excludes non-current net digital assets.
(3)
Abbreviation for “Not Meaningful”.
(4)
Calculated as equity capital divided by outstanding Class A and Class B Units multiplied by the end of period foreign exchange rate.
Galaxy Global Markets
Galaxy Global Markets (“GGM”) offers institutional-grade expertise and access to a broad range of digital asset products, including digital asset spot and derivatives trading, financing, M&A advisory, and equity and debt capital markets services. GGM operates in two discrete business units – Trading and Investment Banking.
Trading reported counterparty trading revenue of $54 million in the third quarter, a 117% increase quarter-over-quarter (“QoQ”), despite a 20% decrease in trading volumes, primarily driven by increased revenue from derivatives and lending activity. Galaxy’s average loan book size expanded to $863 million, a 23% increase QoQ driven by increased demand from both new and existing counterparties, who relied on our lending desk to provide them with margin-based financing. Galaxy continues to onboard new counterparties, including large traditional asset managers and hedge funds, and ended the third quarter with 1,280 total trading counterparties.
Investment Banking successfully closed one deal subsequent to quarter-end, serving as the exclusive financial advisor to an existing client on a small buyside acquisition. Galaxy is executing against a pipeline of mandates representing $2.4 billion in potential deal value.
Key Performance Indicators
Q3 2024
Q2 2024
Q/Q % Change
Q3 YTD
Counterparty Trading Revenue
$54M
$25M
117 %
$146M
Loan Book Size (Average)
$863M
$699M
23 %
$742M
Total Trading Counterparties
1,280
1,212
6 %
—
Active Trading Counterparties
296
294
1 %
—
Investment Banking Deals Closed
0
2
(100) %
3
Pipeline
21
19
11 %
—
Deal Value of Pipeline
$2.4B
$2.1B
14 %
—
____
KEY TERMS
Counterparty Trading Revenue: revenue from counterparty-facing activities from our Derivatives, Credit, Over-the-Counter Trading, and Quantitative Trading businesses, net of associated funding charges.
Loan Book Size (Average): average market value of all open loans, unfunded arrangements to finance delayed trading/settlement (for example over weekends), and uncommitted credit facilities in the period. As of September 30, 2024, unfunded, uncommitted facilities accounted for approximately $156M of total Loan Book Size (Average).
Active Trading Counterparties: counterparties with whom we have traded within the past 12 months and who are still onboarded with Galaxy’s trading business.
Pipeline: the number of open engagements and transactions the Investment Banking team has in market.
Deal Value of Pipeline: the theoretical aggregate deal value associated with the Investment Banking pipeline.
Galaxy Asset Management
Galaxy Asset Management (“GAM”) provides investors access to the digital asset ecosystem via a diverse suite of institutional-grade investment vehicles that span passive, active, and venture strategies.
GAM management and performance fees were $8.1 million in the third quarter, representing a 44% decrease QoQ, primarily driven by the nearing completion of an opportunistic mandate to unwind portfolios on behalf of the FTX estate. GAM reported assets under management (“AUM”) of approximately $4.6 billion, a 2% increase QoQ, driven primarily by net inflows into GAM’s passive and active ETF strategies, which were offset by net market depreciation. In the quarter, GAM, in partnership with State Street Global Advisors, announced the launch of three actively managed digital asset and disruptive technology focused ETFs that offer investors exposure to digital asset and disruptive technology equities, spot cryptocurrencies, derivatives, cash, and cash-like instruments (tickers: DECO, HECO, TEKX).
Key Performance Indicators
Q3 2024
Q2 2024
Q/Q % Change
Q3 YTD
Management and Performance Fees
$8.1M
$14.5M
(44) %
$40.5M
Total AUM1
$4,608M
$4,503M
2 %
—
Passive AUM
$2,466M
$2,392M
3 %
—
Active AUM2
$647M
$629M
3 %
—
Venture AUM
$1,495M
$1,482M
1 %
—
(1) In Galaxy’s monthly AUM disclosures, the “funds” line item consists of AUM held in GAM’s Passive, Active, and Venture funds, excluding opportunistic assets. Total AUM for Q2 2024 was updated from what was previously reported as AUM for quarterly close vehicles are reported as of the most recent information available for the applicable period.
(2) Includes opportunistic AUM. “Opportunistic” AUM are near-term or mid-term engagements to unwind portfolios managed by GAM. Opportunistic AUM was $429M as of September 30, 2024 and $520M as of June 30, 2024.
____
KEY TERMS
Assets Under Management: all figures are unaudited. AUM is inclusive of sub-advised funds, committed capital closed-end vehicles, seed investments by affiliates, affiliated and unaffiliated separately managed accounts, engagements to unwind portfolios, and fund of fund products. Changes in AUM are generally the result of performance, contributions, withdrawals, liquidations and opportunistic mandate wins.
AUM for committed capital closed-end vehicles that have completed their investment period is reported as NAV (Net Asset Value) plus unfunded commitment.AUM for quarterly close vehicles is reported as of the most recent quarter available for the applicable period.AUM for affiliated separately managed accounts is reported as NAV as of the most recently available estimate for the applicable period.
Passive Strategies: single- and multi-asset private funds, as well as a suite of regulated spot digital asset exchange-traded funds offered through partnerships with asset managers globally.
Active Strategies: Galaxy’s Liquid Crypto Fund, the management of certain opportunistic mandates, and a suite of actively managed and regulated digital asset and disruptive technology exchange-traded funds offered through a partnership with State Street Global Advisors.
Venture Strategies: organized around two investment themes: Interactive Ventures and Crypto Ventures. Galaxy Interactive invests at the intersection of content, technology, and social commerce, managing client capital across three funds. GAM’s Crypto Ventures sleeve includes Galaxy’s inaugural crypto venture fund, which is focused on investing in early-stage companies across crypto protocols, software infrastructure, and financialized applications, as well as two global, multi-manager venture funds and a subset of Galaxy’s balance sheet venture investments.
Galaxy Digital Infrastructure Solutions
Galaxy Digital Infrastructure Solutions (“GDIS”) consists of proprietary and hosted bitcoin mining services, GK8 self-custody technology solutions, and blockchain infrastructure.
Subsequent to quarter-end, Galaxy executed a non-binding term sheet with a U.S.-based hyperscaler to host high-performance computing at its Helios campus in West Texas. The term sheet includes options to allocate all of Helios’ 800 megawatts of currently approved power capacity to HPC hosting and support. The consummation of the transaction is subject to execution of definitive documents, customary due diligence and approvals of the parties.
Mining
Mining revenue was $18.5 million for the third quarter, relative to expenses, net of curtailment credits, of $10.0 million, resulting in a 46% direct mining profit margin. Mining revenue and cost to mine were impacted by the Bitcoin halving, elevated mining difficulty and seasonal curtailment. Galaxy initiated fiber construction at Helios and, beyond the current approved capacity of 800MW, expects approval on a portion of the 1.7 gigawatts currently under study in the first half of 2025.
Key Performance Indicators
Q3 2024
Q2 2024
Q/Q % Change
Q3 YTD
Mining Revenue
$18.5M
$24.1M
(23) %
$72.8M
Proprietary Mining Revenue
$11.4M
$16.3M
(30) %
$47.9M
Hosted Revenue
$7.0M
$7.8M
(10) %
$24.9M
Total Hashrate Under Management
6.2 EH/s
5.6 EH/s
11 %
—
Proprietary Mining Hashrate
3.5 EH/s
2.9 EH/s
21 %
—
Hosted Mining Hashrate
2.7 EH/s
2.6 EH/s
4 %
—
Number of Proprietary BTC Mined
176
242
(27) %
790
Average Marginal Cost to Mine
<$38.0K
<$22.5K
N.M.
<$23.0K
Blockchain Infrastructure and GK8
Blockchain Infrastructure and GK8 continue to build and invest in the technology that powers the digital assets ecosystem. Blockchain Infrastructure expanded its Assets Under Stake by 58% QoQ to $3.4 billion as of September 30th, with Galaxy maintaining its position as one of the largest validators globally on the Solana network. Blockchain rewards, net of staking costs, were $10.7 million in the third quarter, up 26% QoQ. GK8 added one new client in the quarter.
Key Performance Indicators
Q3 2024
Q2 2024
Q/Q % Change
Q3 YTD
Assets Under Stake
$3,394M
$2,144M
58 %
$3,394M
GK8 Total Client Count
23
22
5 %
—
____
KEY TERMS
Hashrate Under Management: the total combined hashrate of active proprietary and hosted mining capacity managed by Galaxy.
Proprietary Mining Hashrate: the hashrate attributed to Galaxy owned and operated mining machines.
Hosted Mining Hashrate: the hashrate attributed to third-party machines operated by Galaxy for a client.
Number of Proprietary BTC Mined: the total amount of bitcoin mined from proprietary mining operations.
Average Marginal Cost to Mine: the average marginal cost of production for each bitcoin generated during the period. The calculation excludes depreciation, mark-to-market on power contracts, and corporate overhead.
Assets Under Stake: all figures are unaudited. AUS reflects the total notional value of assets bonded to Galaxy validators, based on prices as of the end of the specified period. This includes certain Galaxy balance sheet assets, Galaxy affiliate assets, and third-party assets.
GK8 Total Client Count: the total number of clients contracted to use GK8’s technology solutions.
Summary of Operating Expenses
Operating expenses
Q3 2024
Q2 2024
Q/Q % Change
Q3 YTD
Compensation and compensation related
$40M
$43M
(7) %
$125M
Equity based compensation
$13M
$12M
8 %
$42M
General and administrative
$48M
$45M
7 %
$143M
Mining costs
$10M
$10M
— %
$36M
Trading, commission and custody expenses
$6M
$6M
— %
$19M
Technology
$8M
$7M
14 %
$21M
Depreciation and amortization
$16M
$14M
14 %
$40M
Other
$8M
$9M
(11) %
$27M
Professional fees
$11M
$14M
(21) %
$38M
Staking costs
$39M
$30M
30 %
$70M
Interest
$29M
$21M
38 %
$70M
Notes interest expense
$7M
$7M
— %
$21M
Note: Quarter-over-quarter percentage change calculations are based on unrounded results.
Overview of Third Quarter Operating Expenses:
Compensation and compensation related expenses of $40 million decreased by approximately $3 million QoQ, primarily driven by adjustments to cash bonus accrual.Equity based compensation of $13 million was roughly flat QoQ.General and administrative expenses increased by approximately $3 million from the second quarter of 2024, driven primarily by $2 million of higher depreciation and amortization costs, reflecting the additional depreciation from new mining machines and electrical infrastructure that were energized during the prior quarter.Professional fees of $11 million decreased by approximately $3 million QoQ, primarily driven by $2 million of lower legal expense.Staking costs increased by approximately $9 million QoQ, reflecting the continued expansion of Galaxy’s validation services including the acquisition of the assets of CryptoManufaktur in July 2024. Despite the increase in staking costs, Galaxy’s blockchain rewards, net of staking costs, increased by 26% QoQ.Interest expense increased approximately $8 million QoQ, reflecting our ability to source non-dilutive wholesale financing to help fund our counterparty trading business, where our revenue increased by approximately $29 million QoQ.
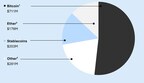
Net Digital Assets Position Summary
Net digital assets includes all digital assets categorized as assets, less all digital assets categorized as liabilities on the statement of financial position and is included in the Company’s liquidity measure. Net digital assets as of September 30, 2024 is as follows:
(1) Includes associated tokens such as wBTC. In addition to digital assets, net, the Partnership also held interests in investment vehicles designed to hold BTC, including bitcoin futures ETFs, Galaxy sponsored BTC funds, Mt. Gox Investment Fund LP, and Xapo Holdings Limited, net of associated investment liabilities.
(2) Includes associated tokens such as wETH and stETH. In addition to digital assets, net, the Partnership also held interests in investment vehicles designed to hold ETH, including spot ETFs and Galaxy sponsored ETH funds.
(3) Includes $8.2 million net SOL and $45.9 million net TIA digital assets, net. In addition to digital assets, net, the Partnership also held interests in investment vehicles designed to hold digital assets, including the Galaxy sponsored Galaxy Digital Crypto Vol Fund LLC (includes $93.0 million SOL and $23.1 million of AVAX) and Ripple Lab Inc.
GDH Ltd.’s Financial Highlights
As the only significant asset of GDH Ltd. is its minority interest in GDH LP, its results are driven by the results of GDH LP. GDH Ltd. accounts for its investment in this associate (GDH LP) using the equity method. The investment, initially recorded at cost, is increased or decreased to recognize GDH Ltd.’s share of the earnings and losses of GDH LP. The net comprehensive income (loss) of GDH Ltd. was $(16.4) million for the three months ended September 30, 2024 and $44.1 million for the nine months ended September 30, 2024.
Earnings Conference Call
An investor conference call will be held today, November 7, 2024, at 8:30 AM Eastern Time. A live webcast with the ability to ask questions will be available at: https://investor.galaxy.com/. The conference call can also be accessed by investors in the United States or Canada by dialing 1-800-715-9871, or 1-646-307-1963 (outside the U.S. and Canada) using the Conference ID: 9649375. A replay of the webcast will be available and can be accessed in the same manner as the live webcast on the Company’s Investor Relations website.
About Galaxy Digital Holdings Ltd. (TSX: GLXY) (“GDH Ltd.”) and Galaxy Digital Holdings LP (“GDH LP”)
Galaxy (TSX: GLXY) is a digital asset and blockchain leader providing access to the growing digital economy. We serve a diversified client base, including institutions, startups, and qualified individuals. Since 2018, Galaxy has been building a holistic financial platform spanning three complementary operating businesses: Global Markets, Asset Management, and Digital Infrastructure Solutions. Our offerings include, amongst others, trading, lending, strategic advisory services, institutional-grade investment solutions, proprietary bitcoin mining and hosting services, network validator services, and the development of enterprise self-custodial technology. The company is headquartered in New York City, with global offices across North America, Europe, and Asia. Additional information about Galaxy’s businesses and products is available on www.galaxy.com.
This press release should be read in conjunction with (i) GDH LP’s Management Discussion and Analysis and Consolidated Financial Statements for the three and nine months ended September 30, 2024 and (ii) GDH Ltd.’s Management Discussion and Analysis and Consolidated Financial Statements for the three and nine months ended September 30, 2024 (together, the “Consolidated Financial Statements” and “MD&As”), which have been filed on SEDAR at www.sedarplus.ca.
Disclaimers and Additional Information
The TSX has not approved or disapproved of the information contained herein. The Ontario Securities Commission has not passed upon the merits of the disclosure record of Galaxy.
This press release is not an offer to buy or sell, nor is it a solicitation of an offer to buy or sell, interests in any Galaxy sponsored fund or any advisory services or any other security or to participate in any advisory services or trading strategy. If any offer and sale of securities in a Galaxy sponsored fund is made, it will be pursuant to the confidential offering memorandum of the fund (the Offering Memorandum or fund prospectus (“Prospectus”)). Any decision to make an investment in any Galaxy sponsored fund should be made after reviewing such Offering Memorandum or Prospectus, conducting such investigations as the investor deems necessary and consulting the investor’s own investment, legal, accounting and tax advisors in order to make an independent determination of the suitability and consequences of an investment.
The finalization of the transactions contemplated by the non-binding term sheet with Helios are contingent upon the successful negotiation and execution of definitive agreements, satisfactory completion of due diligence, and receipt of all necessary consents and approvals. There can be no assurance that a definitive agreement will be entered into or that the proposed transaction will be consummated.
No Offer or Solicitation
As previously announced, the Company intends to complete its proposed reorganization and domestication to become a Delaware-based company, and subsequently list on the Nasdaq, upon completion of the SEC’s ongoing review and subject to stock exchange approval of such listing. The proposed reorganization and domestication is subject to approval by shareholders the Company and applicable regulatory authorities, including the Toronto Stock Exchange. In connection with the proposed reorganization and domestication, the Company has filed a registration statement, including a management information circular/prospectus, with the SEC, which has not yet become effective. SHAREHOLDERS ARE ADVISED TO READ THE FINAL VERSIONS OF SUCH DOCUMENTS, WHEN AVAILABLE, BECAUSE THEY WILL CONTAIN IMPORTANT INFORMATION. Shareholders may obtain a free copy of the registration statement (including the management information circular/prospectus) and any other relevant documents from the SEC’s website at http://www.sec.gov. Copies of the final versions of such documents can also be obtained, when available, without charge, via Galaxy’s investor relations website: https://investor.galaxy.com/ The Company anticipates holding a shareholder meeting to seek approval following the effectiveness of the registration statement, and further details will be included in the management information circular to be mailed to shareholders and posted on the Company’s SEDAR profile at www.sedarplus.ca.
This document shall not constitute a solicitation of a proxy, consent or authorization with respect to any securities or in respect of the domestication or any of the other proposed reorganization transactions. This document does not constitute an offer to sell or the solicitation of an offer to buy any securities or a solicitation of any vote of approval, nor shall there be any sale of securities in any jurisdiction in which such offer, solicitation or sale would be unlawful prior to the registration or qualification under the securities laws of any such jurisdiction.
CAUTION ABOUT FORWARD-LOOKING STATEMENTS
The information in this document may contain “forward-looking statements” within the meaning of Section 27A of the Securities Act of 1933, as amended (the “Securities Act”), Section 21E of the Securities Exchange Act of 1934, as amended and “forward-looking information” under Canadian securities laws (collectively, “forward-looking statements”). Our forward-looking statements include, but are not limited to, statements regarding our or our management team’s expectations, hopes, beliefs, intentions or strategies regarding the future. Statements that are not historical facts, including statements about Galaxy’s business pipelines for banking, expectations for increased load capacity at the Helios site, mining goals and our ability to capture adjacent opportunities, including in high-performance computing and the Helios transaction, focus on self-custody and validator solutions and our commitment to the future of decentralized networks and the pending domestication and the related transactions (the “transactions”), and the parties, perspectives and expectations, are forward-looking statements. In addition, any statements that refer to estimates, projections, forecasts or other characterizations of future events or circumstances, including any underlying assumptions, are forward-looking statements. The words “anticipate,” “believe,” “continue,” “could,” “estimate,” “expect,” “forecast,” “intend,” “may,” “might,” “plan,” “possible,” “potential,” “predict,” “project,” “should,” “would” and similar expressions may identify forward-looking statements, but the absence of these words does not mean that a statement is not forward-looking. The forward-looking statements contained in this document are based on our current expectations and beliefs concerning future developments and their potential effects on us taking into account information currently available to us. There can be no assurance that future developments affecting us will be those that we have anticipated. These forward-looking statements involve a number of risks, uncertainties (some of which are beyond our control) or other assumptions that may cause actual results or performance to be materially different from those expressed or implied by these forward-looking statements. These risks include, but are not limited to: (1) the inability to complete the proposed domestication and reorganization transactions, due to the failure to obtain shareholder and stock exchange approvals, or otherwise; (2) changes to the proposed structure of the transactions that may be required or appropriate as a result of applicable laws or regulations or as a condition to obtaining shareholder or stock exchange approval of the transactions; (3) the ability to meet and maintain listing standards following the consummation of the transactions; (4) the risk that the transactions disrupt current plans and operations; (5) costs related to the transactions, operations and strategy; (6) changes in applicable laws or regulations; (7) the possibility that the Company may be adversely affected by other economic, business, and/or competitive factors; (8) changes or events that impact the cryptocurrency industry, including potential regulation, that are out of our control; (9) the risk that our business will not grow in line with our expectations or continue on its current trajectory; (10) the possibility that our addressable market is smaller than we have anticipated and/or that we may not gain share of it; and (11) the possibility that there is a disruption in mining impacting our ability to achieve expected results or change in power dynamics impacting our results or our ability to increase load capacity, (12) any delay or failure to consummate the business mandates or achieve its pipeline goals in banking and Gk8, (13) liquidity or economic conditions impacting our business, (14) regulatory concerns, technological challenges, cyber incidents or exploits on decentralized networks (15) the failure to enter into definitive agreements or otherwise complete the anticipated transactions with respect to the non-binding term sheet for Helios, (16) those other risks contained in the Annual Information Form for the year ended December 31, 2023 available on the Company’s profile at www.sedarplus.ca and its Management’s Discussion and Analysis, filed on November 7, 2024. Factors that could cause actual results to differ materially from those described in such forward-looking statements include, but are not limited to, a decline in the digital asset market or general economic conditions; the possibility that our addressable market is smaller than we have anticipated and/or that we may not gain share of the stated addressable market; the failure or delay in the adoption of digital assets and the blockchain ecosystem; a delay or failure in developing infrastructure for our business or our businesses achieving our banking and Gk8 mandates; delays or other challenges in the mining business related to hosting, power or our mining infrastructure, or our ability to capture adjacent opportunities; any challenges faced with respect to decentralized networks, considerations with respect to liquidity and capital planning and changes in applicable law or regulation and adverse regulatory developments. Should one or more of these risks or uncertainties materialize, they could cause our actual results to differ materially from the forward-looking statements. We are not undertaking any obligation to update or revise any forward looking statements whether as a result of new information, future events or otherwise. You should not take any statement regarding past trends or activities as a representation that the trends or activities will continue in the future. Accordingly, you should not put undue reliance on these statements.
©Copyright Galaxy Digital 2024. All rights reserved.
Galaxy Digital Holdings LP’s Consolidated Statements of Financial Position (unaudited)
(in thousands)
September 30, 2024
December 31, 2023
Assets
Current assets
Cash and cash equivalent
$ 271,977
$ 316,610
Digital assets
2,490,335
1,078,587
Receivable for digital asset trades
986
41,339
Digital assets loans receivable, net of allowance
305,276
104,504
Digital assets receivables
43,118
14,686
Investments (includes $57.0 million and $0 of equity method
investments, respectively)
594,564
—
Assets posted as collateral
227,050
318,195
Receivables
23,629
15,983
Derivative assets
141,961
173,209
Prepaid expenses and other assets
31,078
37,910
Loans receivable, net of allowance
398,510
377,105
Due from related party
7,420
5,007
Total current assets
4,535,904
2,483,135
Digital assets receivables
7,015
6,174
Investments (includes $393.7 million and $290.4 million of equity method
investments, respectively)
704,542
735,103
Restricted digital assets
26,989
41,356
Digital asset loans receivable, non-current
18,376
—
Loans receivable, non-current
—
10,259
Property and equipment
259,899
259,965
Other non-current assets
115,279
95,000
Goodwill
49,450
44,257
Total non-current assets
1,181,550
1,192,114
Total assets
$ 5,717,454
$ 3,675,249
Liabilities and equity
Current liabilities
Investments sold short
160,146
25,295
Derivative liabilities
112,136
160,642
Accounts payable and accrued liabilities
81,884
69,212
Payable to customers
96,864
3,503
Taxes payable
5,176
25,936
Payable for digital asset trades
23,269
4,176
Digital assets loans payable
1,163,768
398,277
Loans payable
248,818
93,069
Collateral payable
1,154,471
581,362
Due to related party
92,722
67,953
Lease liability
3,772
3,860
Total current liabilities
3,143,026
1,433,285
Notes payable
434,306
408,053
Deferred tax liability
51,841
33,894
Lease liability
7,524
10,236
Total non-current liabilities
493,671
452,183
Total liabilities
3,636,697
1,885,468
Equity
Partners’ capital
2,080,757
1,789,781
Total equity
2,080,757
1,789,781
Total liabilities and equity
$ 5,717,454
$ 3,675,249
Galaxy Digital Holdings LP’s Consolidated Statements of Income (Loss) and Comprehensive Income (Loss) (unaudited)
(in thousands)
Three months ended
Nine months ended
September 30,
2024
September 30,
2023
September 30,
2024
September 30,
2023
Income
Fee revenue
$ 20,693
$ 9,525
$ 75,303
$ 34,207
Net realized gain (loss) on digital assets
(53,623)
(67,617)
55,038
18,681
Net realized gain (loss) on investments
73,819
22,355
(86,189)
68,711
Lending and staking revenue
73,673
14,005
157,984
35,323
Net derivative gain
16,340
15,737
205,302
80,462
Revenue from proprietary mining
11,435
8,848
47,875
20,672
Other income
686
127
1,159
333
143,023
2,980
456,472
258,389
Operating expenses
Compensation and compensation related
39,673
30,995
125,037
96,247
Equity based compensation
12,517
18,769
42,107
57,694
General and administrative
47,678
30,461
142,732
60,108
Mining costs
10,013
3,886
35,734
9,840
Trading and commission expense
5,990
2,811
18,912
6,097
Technology
7,576
4,948
21,424
13,942
Depreciation and amortization
15,552
8,130
40,484
19,895
Impairment reversal
—
—
—
(12,489)
Other
8,547
10,686
26,178
22,823
Professional fees
10,927
7,911
38,247
26,514
Staking costs
39,330
287
69,538
826
Interest
28,935
5,797
69,710
15,670
Notes interest expense
7,105
6,851
21,121
20,372
(186,165)
(101,071)
(508,492)
(277,431)
Other
Net unrealized gain (loss) on digital assets
44,334
26,196
184,047
24,451
Net unrealized gain (loss) on investments
(60,515)
(25,380)
61,023
(8,517)
Net loss on notes payable – derivative
(2,858)
1,082
(15,144)
(1,022)
Foreign currency gain (loss)
95
(768)
1,448
(843)
(18,944)
1,130
231,374
14,069
Income before income taxes
(62,086)
(96,961)
179,354
(4,973)
Income taxes expense (benefit)
(8,446)
(3,240)
(11,661)
586
Net income for the period
$ (53,640)
$ (93,721)
$ 191,015
$ (5,559)
Other comprehensive income
Foreign currency translation adjustment
(118)
$ 419
972
3
Comprehensive income for the period
$ (53,758)
$ (93,302)
$ 191,987
$ (5,556)
Three months ended
Nine months ended
September 30,
2024
September 30,
2023
September 30,
2024
September 30,
2023
GDH LP Net income (loss) per unit:
Basic
$ (0.16)
$ (0.29)
$ 0.57
$ (0.02)
Diluted
(0.16)
(0.29)
0.54
(0.02)
Weighted average units:
Basic
341,208,229
322,656,584
334,883,094
321,154,802
Diluted
341,208,229
322,656,584
352,126,364
323,154,802
Reportable segments (unaudited)
Income and expenses by each reportable segment of GDH LP for the three months ended September 30, 2024 are as follows:
(in thousands)
Global
Markets
Asset
Management
Digital
Infrastructure
Solutions
Corporate
and Other
Totals
Income (loss)
Fee revenue(1)
Mining hosting fees
$ —
$ —
$ 7,024
$ —
$ 7,024
Licensing fees
—
1
801
(121)
681
Management and performance fees
5,526
8,094
—
(708)
12,912
Advisory fees
76
—
—
—
76
Total fee revenue
5,602
8,095
7,825
(829)
20,693
Lending and staking revenue
Lending income
22,429
95
1,111
7
23,642
Blockchain rewards
4,001
1,859
49,432
(5,261)
50,031
Total lending and staking revenue
26,430
1,954
50,543
(5,254)
73,673
Net realized gain on digital assets
(55,660)
2,037
—
—
(53,623)
Net realized gain (loss) on investments
72,503
(1,107)
2,423
—
73,819
Net derivative gain
16,414
—
(74)
—
16,340
Revenue from proprietary mining
—
—
11,435
—
11,435
Other income
654
27
5
—
686
Total revenues and gain (loss) from operations
65,943
11,006
72,157
(6,083)
143,023
Operating expenses
81,269
11,025
82,189
11,682
186,165
Net unrealized gain on digital assets
18,257
25,916
161
—
44,334
Net unrealized gain (loss) on investments
(35,029)
(24,701)
(785)
—
(60,515)
Net loss on notes payable – derivative
—
—
—
(2,858)
(2,858)
Foreign currency loss
95
—
—
—
95
(16,677)
1,215
(624)
(2,858)
(18,944)
Income (loss) before income taxes
$ (32,003)
$ 1,196
$ (10,656)
$ (20,623)
$ (62,086)
Income tax expense
—
—
—
(8,446)
(8,446)
Net income (loss)
$ (32,003)
$ 1,196
$ (10,656)
$ (12,177)
$ (53,640)
Foreign currency translation adjustment
—
—
—
(118)
(118)
Comprehensive income (loss)
$ (32,003)
$ 1,196
$ (10,656)
$ (12,295)
$ (53,758)
(1)Asset Management fee revenue includes management fees generated off the Partnership’s balance sheet venture investments. Licensing fees are attributable to GK8, and include license fees paid by the Partnership for the use of GK8’s technology. All intercompany transactions are eliminated in the Corporate & Other segment.
Income and expenses by each reportable segment of GDH LP for the nine months ended September 30, 2024 are as follows:
(in thousands)
Global
Markets
Asset
Management
Digital
Infrastructure
Solutions
Corporate
and Other(1)
Totals
Income (loss)
Fee revenue (1)
Mining hosting fees
$ —
$ —
$ 24,940
$ —
24,940
Licensing fees
1
1
2,219
(360)
1,861
Management and performance fees
9,220
40,466
—
(2,190)
47,496
Advisory fees
1,006
—
—
—
1,006
Total fee revenue
10,227
40,467
27,159
(2,550)
75,303
Lending and staking revenue
Lending income
55,185
101
1,112
19
56,417
Blockchain rewards
9,663
12,904
93,008
(14,008)
101,567
Total lending and staking revenue
64,848
13,005
94,120
(13,989)
157,984
Net realized gain on digital assets
35,838
18,404
796
—
55,038
Net realized gain (loss) on investments
(100,820)
12,208
2,423
—
(86,189)
Net derivative gain
204,509
—
793
—
205,302
Revenue from proprietary mining
—
—
47,875
—
47,875
Other income
805
60
294
—
1,159
215,407
84,144
173,460
(16,539)
456,472
Operating expenses
214,302
40,610
192,299
61,281
508,492
Net unrealized gain on digital assets
202,839
(15,442)
(3,350)
—
184,047
Net unrealized gain (loss) on investments
63,451
(1,593)
(835)
—
61,023
Net loss on notes payable – derivative
—
—
—
(15,144)
(15,144)
Foreign currency loss
1,448
—
—
—
1,448
267,738
(17,035)
(4,185)
(15,144)
231,374
Income (loss) before income taxes
$ 268,843
$ 26,499
$ (23,024)
$ (92,964)
$ 179,354
Income tax expense
—
—
—
(11,661)
(11,661)
Net income (loss)
$ 268,843
$ 26,499
$ (23,024)
$ (81,303)
$ 191,015
Foreign currency translation adjustment
—
—
—
972
972
Comprehensive income (loss)
$ 268,843
$ 26,499
$ (23,024)
$ (80,331)
$ 191,987
(1)Asset Management fee revenue includes management fees generated off the Partnership’s balance sheet venture investments. Licensing fees are attributable to GK8, and include license fees paid by the Partnership for the use of GK8’s technology. All intercompany transactions are eliminated in the Corporate & Other segment.
Income and expenses by each reportable segment of GDH LP for the three months ended September 30, 2023 are as follows:
(in thousands)
Global
Markets
Asset
Management
Digital
Infrastructure
Solutions
Corporate
and Other
Totals
Income (loss)
Fee revenue (1)
Mining hosting fees
—
—
5,173
—
$ 5,173
Licensing fees
—
—
416
(90)
326
Management and performance fees
—
4,686
—
(711)
3,975
Advisory fees
51
—
—
—
51
Other fee revenues
—
—
—
—
—
Total fee revenue
51
4,686
5,589
(801)
9,525
Lending and staking revenue
Lending income
13,431
7
—
—
13,438
Blockchain rewards
390
177
—
—
567
Total lending and staking revenue
13,821
184
—
—
14,005
Net realized gain on digital assets
(67,232)
(385)
—
—
(67,617)
Net realized gain (loss) on investments
22,001
354
—
—
22,355
Net derivative gain
15,667
—
70
—
15,737
Revenue from proprietary mining
—
—
8,848
—
8,848
Other income (expense)
75
32
199
(179)
127
Total revenues and gain (loss) from operations
(15,617)
4,871
14,706
(980)
2,980
Operating expenses
43,510
12,131
21,933
23,497
101,071
Net unrealized gain (loss) on digital assets
26,919
(723)
—
—
26,196
Net unrealized gain on investments
(4,052)
(20,949)
(379)
—
(25,380)
Net loss on notes payable – derivative
—
—
—
1,082
1,082
Foreign currency loss
(768)
—
—
—
(768)
22,099
(21,672)
(379)
1,082
1,130
Income (loss) before income taxes
$ (37,028)
$ (28,932)
$ (7,606)
$ (23,395)
$ (96,961)
Income tax expense
—
—
—
(3,240)
(3,240)
Net income (loss)
$ (37,028)
$ (28,932)
$ (7,606)
$ (20,155)
$ (93,721)
Foreign currency translation adjustment
—
—
—
419
419
Comprehensive income (loss)
$ (37,028)
$ (28,932)
$ (7,606)
$ (19,736)
$ (93,302)
(1)Asset Management fee revenue includes management fees generated off the Partnership’s balance sheet venture investments, which are eliminated in the Corporate & Other segment.
Income and expenses by each reportable segment of GDH LP for the nine months ended September 30, 2023 are as follows:
(in thousands)
Global
Markets
Asset
Management
Digital
Infrastructure
Solutions
Corporate
and Other
Totals
Income (loss)
Fee revenue (1)
Mining hosting fees
$ —
$ —
$ 17,990
$ —
$ 17,990
Licensing fees
—
—
1,234
(118)
1,116
Management and performance fees
—
13,833
—
(2,093)
11,740
Advisory fees
2,316
—
—
—
2,316
Other fee revenues
(54)
—
1,099
—
1,045
Total fee revenue
2,262
13,833
20,323
(2,211)
34,207
Lending and staking revenue
Lending income
32,509
24
—
—
32,533
Blockchain rewards
1,344
1,446
—
—
2,790
Total lending and staking revenue
33,853
1,470
—
—
35,323
Net realized gain on digital assets
14,261
4,420
—
—
18,681
Net realized gain (loss) on investments
46,100
22,611
—
—
68,711
Net derivative gain
78,985
1,542
(65)
—
80,462
Revenue from proprietary mining
—
—
20,672
—
20,672
Other income (expense)
210
(131)
254
—
333
Total revenues and gain (loss) from operations
175,671
43,745
41,184
(2,211)
258,389
Operating expenses
126,613
42,109
38,995
69,714
277,431
Net unrealized gain (loss) on digital assets
25,476
(1,025)
—
—
24,451
Net unrealized gain on investments
13,079
(27,868)
6,272
—
(8,517)
Net loss on notes payable – derivative
—
—
—
(1,022)
(1,022)
Foreign currency loss
(843)
—
—
—
(843)
37,712
(28,893)
6,272
(1,022)
14,069
Income (loss) before income taxes
$ 86,770
$ (27,257)
$ 8,461
$ (72,947)
$ (4,973)
Income tax expense
—
—
—
586
586
Net income (loss)
$ 86,770
$ (27,257)
$ 8,461
$ (73,533)
$ (5,559)
Foreign currency translation adjustment
—
—
—
3
3
Comprehensive income (loss)
$ 86,770
$ (27,257)
$ 8,461
$ (73,530)
$ (5,556)
(1)Asset Management fee revenue includes management fees generated off the Partnership’s balance sheet venture investments, which are eliminated in the Corporate & Other segment.
Assets and liabilities by reportable segment of GDH LP as of September 30, 2024 are as follows:
(in thousands)
Global
Markets
Asset
Management
Digital
Infrastructure
Solutions
Corporate and
Other
Totals
Total assets
$ 4,610,799
$ 619,779
$ 348,283
$ 138,593
$ 5,717,454
Total liabilities
$ 2,975,526
$ 389
$ 14,577
$ 646,205
$ 3,636,697
Assets and liabilities by reportable segment of GDH LP as of December 31, 2023 are as follows:
(in thousands)
Global
Markets
Asset
Management
Digital
Infrastructure
Solutions
Corporate and
Other
Totals
Total assets
$ 2,726,950
$ 575,056
$ 321,322
$ 51,921
$ 3,675,249
Total liabilities
$ 1,289,792
$ 10,968
$ 9,817
$ 574,891
$ 1,885,468
Select statement of financial position information
Select assets by reporting segment of GDH LP as of September 30, 2024 is as follows:
(in thousands)
Global
Markets
Asset
Management
Digital
Infrastructure
Solutions
Corporate and
Other
Totals
Digital assets
$ 2,454,030
$ 63,294
$ —
$ —
$ 2,517,324
Digital assets receivables
8,240
40,798
1,095
—
50,133
Assets posted as collateral
227,050
—
—
—
227,050
Loans receivable
722,162
—
—
—
722,162
Investments
790,695
497,458
10,953
—
1,299,106
Property and equipment
—
—
254,445
5,454
259,899
$ 4,202,177
$ 601,550
$ 266,493
$ 5,454
$ 5,075,674
Select assets by reporting segment of GDH LP as of December 31, 2023 is as follows:
(in thousands)
Global
Markets
Asset
Management
Digital
Infrastructure
Solutions
Corporate
and Other
Totals
Digital assets
$ 1,052,013
$ 67,930
$ —
$ —
$ 1,119,943
Digital assets receivables
6,506
13,135
1,219
—
20,860
Assets posted as collateral
318,195
—
—
—
318,195
Loans receivable
491,868
—
—
—
491,868
Investments
244,807
476,262
14,034
—
735,103
Property and equipment
109
—
252,552
7,304
259,965
$ 2,113,498
$ 557,327
$ 267,805
$ 7,304
$ 2,945,934
Net Digital Assets Position
Net digital assets includes all digital assets categorized as assets, less all digital assets categorized as liabilities on the statement of financial position and is included in the Company’s liquidity measure. Net digital assets as of September 30, 2024 and December 31, 2023 is as follows:
(in thousands)
BTC (3)
ETH (4)
Stablecoin
Other (5)
As of
September 30,
2024(6)
Assets
Digital assets
$ 1,656,466
$ 369,032
$ 210,864
$ 253,973
$ 2,490,335
Digital asset loans receivable, net of
allowance
634
18,684
280,258
24,076
323,652
Digital assets receivable, current
—
—
—
43,118
43,118
Digital assets receivable, non-current
—
—
—
7,015
7,015
Assets posted as collateral – Digital
assets(1)
189,353
26,814
452
216,619
Restricted digital assets, non-current(2)
—
—
—
26,989
26,989
1,846,453
414,530
491,122
355,623
3,107,728
Liabilities
Digital asset loans payable
657,964
97,039
270,577
138,188
1,163,768
Collateral payable(1)
798,452
164,418
17,967
83,653
1,064,490
Payables to customers
61,785
—
—
—
61,785
1,518,201
261,457
288,544
221,841
2,290,043
Digital assets, net
$ 328,252
$ 153,073
$ 202,578
$ 133,782
817,685
Stablecoins, net
$ —
$ —
$ 202,578
$ —
202,578
Digital assets, net excl. stablecoins
$ 328,252
$ 153,073
$ —
$ 133,782
$ 615,107
Digital asset investment vehicles
included in investments
$ 382,861
$ 24,893
$ —
$ 147,287
555,041
(1) Excludes cash portion of balance on the Partnership’s statement of financial position.
(2) Represents TIA and SOL tokens that are subject to a sale restriction of greater than one year.
(3) Includes associated tokens such as wBTC. In addition to digital assets, net, the Partnership also held interests in investment vehicles designed to hold BTC, including spot ETFs, Galaxy sponsored BTC funds, Mt. Gox Investment Fund LP, and Xapo Holdings Limited, net against associated investment liabilities, reflected in the last row of this table.
(4) Includes associated tokens such as wETH and stETH. In addition to digital assets, net, the Partnership also held interests in investment vehicles designed to hold ETH, including spot ETFs and Galaxy sponsored ETH funds, reflected in the last row of this table.
(5) Includes $8.2 million net SOL and $45.9 million net TIA digital assets, net. In addition to digital assets, net, the Partnership also held interests in investment vehicles designed to hold digital assets, including the Galaxy sponsored Galaxy Digital Crypto Vol Fund LLC (includes $93.0 million SOL and $23.1 million of AVAX) and Ripple Lab Inc., reflected in the last row of this table.
(6) The Partnership also held digital asset derivative positions not reflected in this table.
(in thousands)
BTC (4)
ETH (5)
Stablecoin
Other (5)
As of
December 31,
2023(6)
Assets
Digital assets
$ 589,011
$ 174,978
$ 179,222
$ 135,376
$ 1,078,587
Digital asset loans receivable, net of allowance
3,044
87,252
12,000
2,208
104,504
Digital assets receivable, current
—
—
—
14,686
14,686
Digital assets receivable, non-current
—
—
—
6,174
6,174
Assets posted as collateral – Digital assets(1)
197,092
119,012
—
—
316,104
Restricted digital assets, non-current(2)
—
—
—
41,356
41,356
789,147
381,242
191,222
199,800
1,561,411
Liabilities
Digital asset loans payable
48,202
14,603
297,762
37,710
398,277
Collateral payable(1)
437,889
116,723
9,457
5,926
569,995
486,091
131,326
307,219
43,636
968,272
Digital assets, net
$ 303,056
$ 249,916
$ (115,997)
$ 156,164
593,139
Stablecoins, net(3)
$ —
$ —
$ (115,997)
$ —
(115,997)
Digital assets, net excl. stablecoins
$ 303,056
$ 249,916
$ —
$ 156,164
$ 709,136
Bitcoin spot ETFs included in Investments
$ —
$ —
$ —
$ —
$ —
(1) Excludes cash portion of balance on the Partnership’s statement of financial position.
(2) Represents TIA tokens that are subject to a sale restriction of greater than one year.
(3) As of December 31, 2023, stablecoin liabilities were greater than stablecoin assets.
(4) Includes associated tokens such as wBTC. In addition to digital assets, net, the Partnership also held interests in investment vehicles designed to hold BTC, including bitcoin futures ETFs, Galaxy sponsored BTC funds, Mt. Gox Investment Fund LP, and Xapo Holdings Limited, net of associated investment liabilities, reflected in the last row of this table.
(5) Includes associated tokens such as wETH and stETH. In addition to Digital assets, net, the Partnership also held interests in investment vehicles designed to hold ETH, including Galaxy sponsored ETH funds, reflected in the last row of this table.
(6) Includes $12.0 million net SOL and $68.5 million net TIA. In addition to digital assets, net, the Partnership also held interests in investment vehicles designed to hold digital assets, including Ripple Lab Inc., reflected in the last row of this table.
(7) The Partnership also held digital asset derivative positions not reflected in this table.
All figures are in U.S. Dollars unless otherwise noted.
SOURCE Galaxy Digital Holdings Ltd.

You may like
Technology
HydraForce, Elevāt, and Bosch Rexroth Announce Enhanced Remote OTA Update Capabilities for Off-Highway Equipment
Published
45 minutes agoon
July 23, 2026By
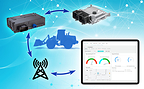
SEATTLE, July 23, 2026 /PRNewswire/ — Building on their strategic collaboration, HydraForce, a global leader in motion control systems and Elevāt, an industrial IoT and applied AI platform provider, announced a significant advancement in remote machine management.
The HydraForce Connected Control Unit (CCU) from Bosch, integrated with Elevāt software, is now capable of providing remote access and performing over-the-air (OTA) updates on Bosch Rexroth BODAS controllers.
This enhanced capability empowers HydraForce and Elevāt customers to streamline operations, reduce downtime, and significantly improve machine performance and serviceability. By leveraging the integrated solution, OEMs can use the Elevāt platform to remotely diagnose issues and deploy critical software updates to the BODAS controllers on their equipment without requiring on-site service personnel.
“The ability to remotely access and update Bosch Rexroth BODAS controllers using the Elevāt platform takes our collaborative vision of bridging hydraulics, electronics, and digital services to the next level,” said Russ Schneidewind, director of business developmentat at HydraForce. “The cooperation between Elevāt and Bosch Rexroth is directly addressing the industry’s need for complete, future-ready solutions.”
Adam Livesay, co-founder and CEO of Elevāt, commented, “At Elevāt, we believe the future of equipment service is connected, intelligent, and proactive. This collaboration helps OEMs deliver the next generation of service by accelerating software deployment and enabling faster issue resolution in the field. The addition of remote BODAS controller updates is another key milestone toward a fully integrated ecosystem that simplifies the connection between hardware, software, and digital services—helping manufacturers bring intelligent equipment to market faster while creating new opportunities for recurring customer value.”
HydraForce and Elevāt plan to further their collaboration with additional remote machine management capabilities to be announced in the future.
About HydraForce HydraForce is a global designer and manufacturer of motion control systems, encompassing hydraulic cartridge valves, manifolds and electronic controls for a variety of off-highway industries, including farming, construction, marine, material handling, mining, and forestry. HydraForce was acquired by Bosch Rexroth, becoming a significant part of the Compact Hydraulics Business Unit. Bosch Rexroth and HydraForce combine their presence in complementary regions to provide comprehensive coverage in Europe and North America, while enabling growth in Asia.
About Bosch Rexroth As one of the world’s leading suppliers of drive and control technologies, Bosch Rexroth ensures efficient, powerful and safe movement in machines and systems of any size. The company bundles global application experience in the market segments of Mobile and Industrial Applications as well as Factory Automation. With its intelligent components, customized system solutions, engineering and services, Bosch Rexroth is creating the necessary environment for fully connected applications. Bosch Rexroth offers its customers hydraulics, electric drive and control technology, gear technology and linear motion and assembly technology, including software and interfaces to the Internet of Things. With locations in over 80 countries, around 31,900 associates generated sales revenue of 6.5 billion euros in 2025. To learn more, please visit www.boschrexroth.com.
About Bosch Having established a presence in North America in 1906, today the Bosch Group employs around 38,000 associates in more than 100 locations in the North American region (as of Dec. 31, 2024). According to preliminary figures, Bosch generated consolidated sales of $18.7 billion in the U.S., Mexico and Canada in 2025. For more information visit www.bosch.us, www.bosch.mx and www.bosch.ca. The Bosch Group is a leading global supplier of technology and services. It employs roughly 412,000 associates worldwide (as of December 31, 2025). According to preliminary figures, the company generated sales of 91 billion euros in 2025. Its operations are divided into four business sectors: Mobility, Industrial Technology, Consumer Goods, and Energy and Building Technology. With its business activities, the company aims to use technology to help shape universal trends such as automation, electrification, digitalization, connectivity, and an orientation to sustainability. In this context, Bosch’s broad diversification across regions and industries strengthens its innovativeness and robustness. Bosch uses its proven expertise in sensor technology, software, and services to offer customers cross-domain solutions from a single source. It also applies its expertise in connectivity and artificial intelligence in order to develop and manufacture user-friendly, sustainable products. With technology that is “Invented for life,” Bosch wants to help improve quality of life and conserve natural resources. The Bosch Group comprises Robert Bosch GmbH and its roughly 490 subsidiary and regional companies in over 60 countries. Including sales and service partners, Bosch’s global manufacturing, engineering, and sales network covers nearly every country in the world. Bosch’s innovative strength is key to the company’s further development. At 136 locations across the globe, Bosch employs some 82,000 associates in research and development. The company was set up in Stuttgart in 1886 by Robert Bosch (1861-1942) as “Workshop for Precision Mechanics and Electrical Engineering.” The special ownership structure of Robert Bosch GmbH guarantees the entrepreneurial freedom of the Bosch Group, making it possible for the company to plan over the long term and to undertake significant upfront investments in the safeguarding of its future. Ninety-four percent of the share capital of Robert Bosch GmbH is held by Robert Bosch Stiftung GmbH, a limited liability company with a charitable purpose. The remaining shares are held by Robert Bosch GmbH and by a company owned by the Bosch family. The majority of voting rights are held by Robert Bosch Industrietreuhand KG. It is entrusted with the task of safeguarding the company’s long-term existence and in particular its financial independence – in line with the mission handed down in the will of the company’s founder, Robert Bosch. Additional information is available online at www.bosch-press.com, www.bosch.com.
About Elevāt Elevāt is a leading industrial IoT and applied AI platform purpose-built for off-highway OEMs. Elevāt enables manufacturers to connect machines, unlock actionable intelligence, and deliver next-generation digital services across the entire equipment lifecycle. Additional information is available online at www.getelevat.com
View original content to download multimedia:https://www.prnewswire.com/news-releases/hydraforce-elevt-and-bosch-rexroth-announce-enhanced-remote-ota-update-capabilities-for-off-highway-equipment-302833060.html
SOURCE Elevat, Inc
Technology
FutureSports launches as new index provider transforming sports statistics into tradable financial instruments
Published
45 minutes agoon
July 23, 2026By
Backed by leading financial and sports institutions, firm will leverage partnerships to bring critical new hedging vehicles to sports ecosystem
CHICAGO, July 23, 2026 /PRNewswire/ — FutureSports, the new independent index administrator transforming professional and college sports statistics into rules-based, benchmark financial indexes, today announced its emergence from stealth. Backed by a broad range of leading financial and sports institutions, FutureSports in the coming months will announce a series of partnerships, collaborations and products that will bring significant new risk management and trading opportunities to the massive ecosystem supporting the most popular sports.
FutureSports previously raised a seed investment round co-led by Marquee Ventures, spun out of the ownership group of the Chicago Cubs. Major financial industry leaders joined the round, including CME Ventures (the corporate venture capital division of CME Group), Robinhood Markets, Inc., WEDBUSH and DRW Special Investments (an investment arm of DRW). Other investors include Motivate VC, Phoenix Capital Ventures, and John and Linda Henry (Fenway Sports Group).
The company also announced the addition of industry experts to its board of directors, including Chairman Mark Wassersug, longtime Chief Operating & Information Officer of Intercontinental Exchange (ICE); Tim McCourt, Senior Managing Director, Global Head of Equity, FX, and Alternative Products at CME Group, and Erik Hammer, Managing Partner at Marquee Ventures.
The firm will soon unveil its first series of exclusive partnerships with major sports leagues, paving the way for institutional investors and companies in and around the sports industry to manage their risk in an unprecedented fashion and participate in regulated, tradable, broad-based index futures contracts based on team and athlete statistical performance. FutureSports creates rules-based financial indexes, known as FutureSports Performance Indexes (FSPI), that accurately represent the performance of teams and athletes in prominent sports leagues. By utilizing transparent, rules-based methodologies based on officially reported statistical outcomes, the company creates continuous values designed to underpin tradable financial products, such as listed derivatives, exchange-traded funds (ETFs) and over-the-counter (OTC) swaps.
Potential market participants will include league broadcasting partners, team and athlete sponsors and endorsers, insurers, stadium owners and operators, private equity investors, lenders, and apparel manufacturers. Asset managers, pension funds and professional trading firms are expected to participate in the contracts and contribute to liquidity in this new uncorrelated asset class. Retail investors will also be able to participate in the first-of-their-kind trading vehicles, which the company expects to capture the interest of sophisticated traders looking for more traditional financial trading instruments
Leigh Taylforth, FutureSports Co-Founder, said: “The global sporting industry generates $650 billion a year, yet there has been no liquid, robust opportunity to hedge the extensive and varied industry risks that range from weather events, to injuries, to unanticipated behavior issues and more. That is about to change. We’ve been truly gratified to see the interest our business has generated within the sports and sports-adjacent industries and the quality of investors we have attracted already.”
Rhett Dinsdale, FutureSports Co-Founder, said: “Up until today, we have been operating in stealth mode while developing our products and establishing key relationships that we expect to be fundamental to our success as we move forward. The recent rise in popularity of prediction markets has only reinforced the concept we created several years ago, that sports as an asset class has huge utility within the sports and entertainment industries, with indexes serving as key institutional instruments to manage risk. What is sorely needed is the type of reliable data and financial instruments that institutional investors have leveraged for so long within the regulated derivatives industry, and we’re excited to bring these to market.”
The Executive team includes Co-Founders Taylforth and Dinsdale, who each have more than 20 years of experience in derivatives trading for market makers, investment banks and hedge funds, along with:
Dave Abbott, Chief Technology Officer – formerly Managing Director at Sportradar;Steve Byrd, Head of Partnerships – formerly Chief Operating Officer (COO) at STATS LLC & Chief Commercial Officer at Sportradar US;Jodie Gunzberg, Head of Index Services – formerly Managing Director at S&P Dow Jones Indices, Morgan Stanley & CoinDesk;Tom Jenkins, Head of Business Development – formerly Head of Index Partnerships & Strategy at FTSE Russell;Josh Kravitt, Head of Operations – formerly Director at CME Ventures;Sunny Modi, Head of Product – formerly Head of BI at Ardent Leisure Group;Mike Philipp, Chief Legal & Strategy Officer – formerly partner at Morgan, Lewis & Bockius LLP;Charlie Thornton, Chief Regulatory Affairs Officer – formerly Chief of Staff and COO at the U.S. Commodity Futures Trading Commission (CFTC).
About FutureSports
Under development since 2022 and launched in 2026, Chicago-based FutureSports has created a proprietary index methodology for measuring on-field, on-ice and on-court performance for a range of professional sporting teams and athletes. Partnering with many of the most recognizable sports leagues and financial market participants, FutureSports transforms live, play-by-play statistical data into rules-based, benchmark indexes that may be referenced by exchange-listed financial products. The indexes are designed to serve the same benchmarking function as the leading equity, commodity and fixed income indexes utilized every day across major global exchanges to track performance and hedge risk in the financial markets. For more information, visit www.futuresports.com.
View original content to download multimedia:https://www.prnewswire.com/news-releases/futuresports-launches-as-new-index-provider-transforming-sports-statistics-into-tradable-financial-instruments-302832829.html
SOURCE FutureSports
Technology
Capital Group Canada Launches Three Active Equity ETFs on TSX
Published
45 minutes agoon
July 23, 2026By
The ETF suite now includes five active equity ETFs and two active fixed income ETFs designed to sit at the core of investment portfolios
TORONTO, July 23, 2026 /CNW/ — Capital International Asset Management (Canada), Inc. (“Capital Group Canada”) has launched three new active exchange-traded funds (ETFs) that begin trading on the Toronto Stock Exchange (TSX) today. The three equity strategies are designed to give options for investors looking to diversify their portfolios with non-domestic exposures including U.S., international and developed market securities.
The new active ETFs are:
CAPU – Capital Group U.S. Equity Select ETF (Canada): Seeks long-term growth of capital and income through investments primarily in common stocks of U.S. issuers.CAPN – Capital Group International Developed Equity Select ETF (Canada): Seeks to provide prudent growth of capital through investments primarily in equity securities of issuers in developed markets outside North America. CAPQ – Capital Group Global Developed Equity Select ETF (Canada): Seeks to provide prudent growth of capital through investments primarily in equity securities of issuers in developed markets.
“As demand for ETFs continues to grow, our expanded lineup gives investors more ways to access Capital Group’s distinctive active investment approach, including our deep research capabilities and multiple portfolio manager system,” said Rick Headrick, president of Capital Group Canada. “As one of the world’s largest active investment managers with over 90 years of experience, we are able to share the benefits of our global scale and offer competitively priced active ETFs designed to sit at the core of an investor’s portfolio.”
“Clients tell us they are looking beyond borders for opportunities to build diversified portfolios,” said Angela Shim, head of product and development at Capital Group Canada. “The three equity strategies expand Capital Group Canada’s core offerings in U.S., international, and global equities, giving investors flexible solutions that can help them navigate global markets and stay focused on their long-term investment goals.”
The three ETFs closed their initial offering of units on July 22, 2026.
The additions expand Capital Group Canada’s ETF lineup to seven, building on a prior launch of two equity and two fixed income ETFs. Details of Capital Group Canada’s full suite of active ETFs can be found here.
About Capital Group
Capital International Asset Management (Canada), Inc. is part of Capital Group, a global investment management firm originating in Los Angeles, California. As Capital Group approaches its 100th anniversary in 2031, its long-term strategy remains firmly rooted in its mission to improve people’s lives through successful investing. With over 9,000 associates and 34 offices around the world, Capital Group manages US$3.6 trillion in assets for millions of wealth management and institutional clients around the world*.
*As of June 30, 2026.
For more information, visit: www.capitalgroup.com/ca/en
SOURCE Capital Group Canada


HydraForce, Elevāt, and Bosch Rexroth Announce Enhanced Remote OTA Update Capabilities for Off-Highway Equipment
FutureSports launches as new index provider transforming sports statistics into tradable financial instruments

Capital Group Canada Launches Three Active Equity ETFs on TSX
Send Rakhi to UK swiftly with UK Gifts Portal

Whiteboard Series with NEAR | Ep: 45 Joel Thorstensson from ceramic.network

New Gooseneck Omni Antennas Offer Enhanced Signals in a Durable Package

Why You Should Build on #NEAR – Co-founder Illia Polosukhin at CV Labs
Whiteboard Series with NEAR | Ep: 45 Joel Thorstensson from ceramic.network

NEAR End of Year Town Hall 2021: The Open Web World, MetaBUILD 2 Hackathon and 2021 recap
Trending
-

 Technology4 days ago
Emdoor Launches “Ailyn” AI Hub at WAIC 2026: Unifying Intelligence Across Every Device
-

 Technology5 days ago
Laifen Expands U.S. Retail Footprint with Costco Launch of Best-Selling SE Hair Dryer
-

 Technology5 days ago
AI-Powered Connectivity: APAC Charts a Path to a Smarter Digital Future
-

 Coin Market4 days ago
Saylor turns up heat with ‘110 reasons’ why BIP-110 is a bad idea
-

 Technology4 days ago
Penetron Strengthens Global Research Collaboration at ICSHM 2026
-

 Coin Market3 days ago
Will the US get CLARITY this week? Bitcoin’s new $80K target: Hodler’s Digest, July 19
-

 Technology3 days ago
“Every Day CO₂ Challenge”: More Than a Game, A New Way of Learning
-

 Technology3 days ago
Powering ASEAN’s Manufacturing Transformation: IME 2026 Connects Technology, Industry and Opportunity