
Technology
Jack Henry & Associates, Inc. Reports Second Quarter Fiscal 2025 Results
Published
1 year agoon
By
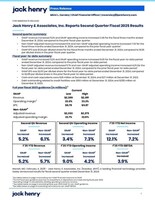
Second quarter summary:
GAAP revenue increased 5.2% and GAAP operating income increased 3.4% for the fiscal three months ended December 31, 2024, compared to the prior fiscal year quarter.Non-GAAP adjusted revenue increased 6.1% and non-GAAP adjusted operating income increased 7.3% for the fiscal three months ended December 31, 2024, compared to the prior fiscal year quarter.1GAAP EPS was $1.34 per diluted share for the fiscal three months ended December 31, 2024, compared to $1.26 per diluted share in the prior fiscal year quarter.
Fiscal year-to-date summary:
GAAP revenue increased 5.2% and GAAP operating income increased 9.0% for the fiscal year-to-date period ended December 31, 2024, compared to the prior fiscal year-to-date period.Non-GAAP adjusted revenue increased 5.7% and non-GAAP adjusted operating income increased 4.2% for the fiscal year-to-date period ended December 31, 2024, compared to the prior fiscal year-to-date period.1GAAP EPS was $2.97 per diluted share for the fiscal year-to-date period ended December 31, 2024, compared to $2.65 per diluted share in the prior fiscal year-to-date period.Cash and cash equivalents were $26 million at December 31, 2024, and $27 million at December 31, 2023.Debt outstanding related to credit facilities was $150 million at December 31, 2024, and $255 million at December 31, 2023.
Full year fiscal 2025 guidance (In millions):2
Current
GAAP
Low
High
Revenue
$2,369
$2,391
Operating margin3
23.0 %
23.2 %
EPS
$5.78
$5.87
Non-GAAP4
Adjusted revenue
$2,353
$2,375
Adjusted operating margin
22.7 %
22.8 %
MONETT, Mo., Feb. 4, 2025 /PRNewswire/ — Jack Henry & Associates, Inc. (Nasdaq: JKHY), a leading financial technology provider, today announced results for fiscal second quarter ended December 31, 2024.
1 See tables below on page 4 reconciling non-GAAP financial measures to GAAP.
2 The full fiscal year guidance assumes no acquisitions or dispositions are made during fiscal year 2025.
3 Operating margin is calculated by dividing operating income by revenue.
4 See tables below on page 9 reconciling fiscal year 2025 GAAP to non-GAAP guidance.
5 See table below on page 14 reconciling net income to non-GAAP EBITDA.
According to Greg Adelson, President and CEO, “We are pleased to report solid performance in the second quarter of our fiscal year. We continued our positive sales momentum with record sales attainment in Q2 for the second consecutive year while maintaining a robust sales pipeline for future opportunities. We are seeing strong demand for our products from both new and existing clients and are making substantial progress with our technology modernization strategy. Our focus on a people-first culture, service excellence, technology innovation, and a well-executed strategy continues to differentiate us in the market.”
Operating Results
Revenue, operating expenses, operating income, and net income for the three and six months ended December 31, 2024, compared to the three and six months ended December 31, 2023, were as follows:
Revenue
(Unaudited, in thousands)
Three Months Ended
December 31,
%
Change
Six Months Ended
December 31,
%
Change
2024
2023
2024
2023
Revenue
Services and Support
$ 323,027
$ 311,992
3.5 %
$ 679,706
$ 654,197
3.9 %
Percentage of Total Revenue
56.3 %
57.2 %
57.9 %
58.6 %
Processing
250,821
233,709
7.3 %
495,123
462,872
7.0 %
Percentage of Total Revenue
43.7 %
42.8 %
42.1 %
41.4 %
REVENUE
$ 573,848
$ 545,701
5.2 %
$ 1,174,829
$ 1,117,069
5.2 %
Services and support revenue increased for the three months ended December 31, 2024, primarily driven by growth in data processing and hosting revenue of 11.8%, partially offset by a decrease in deconversion revenue of $4,813. Processing revenue increased for the three months ended December 31, 2024, primarily driven by growth in card revenue of 6.5%, transaction and digital revenue of 10.0%, and payment processing revenue of 10.1%.Services and support revenue increased for the six months ended December 31, 2024, primarily driven by growth in data processing and hosting revenue of 12.2%, partially offset by a decrease in hardware and deconversion revenues of 31.1% and 58.2%, respectively. Processing revenue increased for the six months ended December 31, 2024, primarily driven by growth in card revenue of 5.8% and transaction and digital revenue of 10.4%. Another driver was an increase in payment processing revenues.For the three months ended December 31, 2024, core segment revenue increased 4.6%, payments segment revenue increased 5.4%, complementary segment revenue increased 5.6%, and corporate and other segment revenue increased 4.7%. For the three months ended December 31, 2024, core segment non-GAAP adjusted revenue increased 5.8%, payments segment non-GAAP adjusted revenue increased 6.2%, complementary segment non-GAAP adjusted revenue increased 6.5%, and corporate and other non-GAAP adjusted segment revenue increased 4.9% (see revenue lines of segment break-out tables on pages 5 and 6 below for a reconciliation of segment non-GAAP adjusted revenue to GAAP segment revenue).For the six months ended December 31, 2024, core segment revenue increased 4.8%, payments segment revenue increased 5.8%, complementary segment revenue increased 6.0%, and corporate and other segment revenue decreased 2.8%. For the six months ended December 31, 2024, core segment non-GAAP adjusted revenue increased 5.5%, payments segment non-GAAP adjusted revenue increased 6.0%, complementary segment non-GAAP adjusted revenue increased 6.8%, and corporate and other non-GAAP adjusted segment revenue decreased 2.8% (see revenue lines of segment break-out tables on pages 7 and 8 below for a reconciliation of segment non-GAAP adjusted revenue to GAAP segment revenue).
Operating Expenses and Operating Income
(Unaudited, in thousands)
Three Months Ended
December 31,
%
Change
Six Months Ended
December 31,
%
Change
2024
2023
2024
2023
Cost of Revenue
$ 332,850
$ 320,979
3.7 %
$ 676,282
$ 643,981
5.0 %
Percentage of Total Revenue6
58.0 %
58.8 %
57.6 %
57.6 %
Research and Development
41,095
35,478
15.8 %
80,780
72,370
11.6 %
Percentage of Total Revenue6
7.2 %
6.5 %
6.9 %
6.5 %
Selling, General, and Administrative
76,901
70,277
9.4 %
143,489
149,051
(3.7) %
Percentage of Total Revenue6
13.4 %
12.9 %
12.2 %
13.3 %
OPERATING EXPENSES
450,846
426,734
5.7 %
900,551
865,402
4.1 %
OPERATING INCOME
$ 123,002
$ 118,967
3.4 %
$ 274,278
$ 251,667
9.0 %
Operating Margin6
21.4 %
21.8 %
23.3 %
22.5 %
Cost of revenue increased for the three months ended December 31, 2024, primarily due to higher direct costs generally consistent with increases in the related lines of revenue and higher personnel costs including benefits expenses from an increase in employee headcount in the trailing twelve months. Cost of revenue increased for the six months ended December 31, 2024, primarily due to higher direct costs generally consistent with increases in the related lines of revenue, higher personnel costs including benefits expenses from an increase in employee headcount in the trailing twelve months, higher internal licenses and fees from increased deployments and prices, and a rise in amortization from capital development projects placed into service in the trailing twelve months.Research and development expense increased for the three and six months ended December 31, 2024, primarily due to higher personnel costs (net of capitalization) including benefits expenses from an increase in employee headcount in the trailing twelve months.Selling, general, and administrative expense increased for the three months ended December 31, 2024, primarily due to higher personnel costs including benefits expenses from an increase in employee headcount in the trailing twelve months. Selling, general, and administrative expense decreased for the six months ended December 31, 2024, primarily due to the decrease in non-recurring personnel costs when compared to the prior fiscal year period.
Net Income
(Unaudited, in thousands,
except per share data)
Three Months Ended
December 31,
%
Change
Six Months Ended
December 31,
%
Change
2024
2023
2024
2023
Income Before Income Taxes
$ 127,381
$ 120,223
6.0 %
$ 284,179
$ 253,471
12.1 %
Provision for Income Taxes
29,536
28,258
4.5 %
67,143
59,827
12.2 %
NET INCOME
$ 97,845
$ 91,965
6.4 %
$ 217,036
$ 193,644
12.1 %
Diluted earnings per share
$ 1.34
$ 1.26
6.2 %
$ 2.97
$ 2.65
12.0 %
Effective tax rates for the three months ended December 31, 2024, and 2023, were 23.2% and 23.5%, respectively. Effective tax rates for the six months ended December 31, 2024, and 2023, were 23.6% and 23.6%, respectively.
According to Mimi Carsley, CFO and Treasurer, “Our second quarter results included non-GAAP revenue growth of over 6%, led by our key revenue areas of public and private cloud and processing, which combined to grow by nearly 9%. That strong revenue growth and the leverage provided by our SaaS business model led to non-GAAP operating income growth of over 7%.”
6Operating margin is calculated by dividing operating income by revenue. Operating margin plus operating expense components as a percentage of total revenue may not equal 100% due to rounding.
Impact of Non-GAAP Adjustments
The tables below show our revenue, operating income, and net income for the three and six months ended December 31, 2024, compared to the three and six months ended December 31, 2023, excluding the impacts of deconversions and the VEDIP program expense.*
(Unaudited, in thousands)
Three Months Ended
December 31,
%
Change
Six Months Ended
December 31,
%
Change
2024
2023
2024
2023
GAAP Revenue**
$ 573,848
$ 545,701
5.2 %
$ 1,174,829
$ 1,117,069
5.2 %
Adjustments:
Deconversion revenue
(69)
(4,882)
(3,766)
(9,018)
NON-GAAP ADJUSTED REVENUE**
$ 573,779
$ 540,819
6.1 %
$ 1,171,063
$ 1,108,051
5.7 %
GAAP Operating Income
$ 123,002
$ 118,967
3.4 %
$ 274,278
$ 251,667
9.0 %
Adjustments:
Operating (income) loss from deconversions
622
(3,803)
(2,873)
(7,558)
VEDIP program expense*
—
—
—
16,443
NON-GAAP ADJUSTED OPERATING INCOME
$ 123,624
$ 115,164
7.3 %
$ 271,405
$ 260,552
4.2 %
Non-GAAP Adjusted Operating Margin***
21.5 %
21.3 %
23.2 %
23.5 %
GAAP Net Income
$ 97,845
$ 91,965
6.4 %
$ 217,036
$ 193,644
12.1 %
Adjustments:
Net (income) loss from deconversions
622
(3,803)
(2,874)
(7,558)
VEDIP program expense*
—
—
—
16,443
Tax impact of adjustments****
(149)
913
690
(2,132)
NON-GAAP ADJUSTED NET INCOME
$ 98,318
$ 89,075
10.4 %
$ 214,852
$ 200,397
7.2 %
*The VEDIP program expense for the fiscal six months ended December 31, 2023, was related to a Company voluntary separation program offered to certain eligible employees beginning in July 2023.
**GAAP revenue is comprised of services and support and processing revenues (see page 2). Reducing services and support revenue by deconversion revenue for the three months ended December 31, 2024, and 2023 which was $69 for the current fiscal year quarter and $4,882 for the prior fiscal year quarter, results in non-GAAP adjusted services and support revenue growth of 5.2% quarter over quarter. There were no non-GAAP adjustments to processing revenue for the three months ended December 31, 2024, or 2023.
Reducing services and support revenue by deconversion revenue for the six months ended December 31, 2024, and 2023, which was $3,766 for the current fiscal year period and $9,018 for the prior fiscal year period, results in non-GAAP adjusted services and support revenue growth of 4.8% period over period. There were no non-GAAP adjustments to processing revenue for the six months ended December 31, 2024, or 2023.
***Non-GAAP adjusted operating margin is calculated by dividing non-GAAP adjusted operating income by non-GAAP adjusted revenue.
****The tax impact of adjustments is calculated using a tax rate of 24% for the three and six months ended December 31, 2024, and 2023. The tax rate for non-GAAP adjustment items takes a broad look at our recurring tax adjustments and applies them to non-GAAP revenue that does not have its own specific tax impacts.
The tables below show the segment break-out of revenue and cost of revenue for each period presented, as adjusted for the items above, and include a reconciliation to non-GAAP adjusted operating income presented above.
Three Months Ended December 31, 2024
(Unaudited, in thousands)
Core
Payments
Complementary
Corporate
and Other
Total
GAAP REVENUE
$ 173,173
$ 214,836
$ 160,937
$ 24,902
$ 573,848
Non-GAAP adjustments*
20
(34)
(60)
5
(69)
NON-GAAP ADJUSTED REVENUE
173,193
214,802
160,877
24,907
573,779
GAAP COST OF REVENUE
70,739
114,738
63,384
83,989
332,850
Non-GAAP adjustments*
(88)
(53)
(99)
—
(240)
NON-GAAP ADJUSTED COST OF REVENUE
70,651
114,685
63,285
83,989
332,610
GAAP SEGMENT INCOME
$ 102,434
$ 100,098
$ 97,553
$ (59,087)
Segment Income Margin**
59.2 %
46.6 %
60.6 %
(237.3) %
NON-GAAP ADJUSTED SEGMENT INCOME
$ 102,542
$ 100,117
$ 97,592
$ (59,082)
Non-GAAP Adjusted Segment Income Margin**
59.2 %
46.6 %
60.7 %
(237.2) %
Research and Development
41,095
Selling, General, and Administrative
76,901
Non-GAAP adjustments unassigned to a segment***
(451)
NON-GAAP TOTAL ADJUSTED OPERATING EXPENSES
450,155
NON-GAAP ADJUSTED OPERATING INCOME
$ 123,624
*Revenue non-GAAP adjustments for all segments were deconversion revenue. Cost of revenue non-GAAP adjustments for all segments were deconversion costs.
**Segment income margin is calculated by dividing segment income by revenue for each segment. Non-GAAP adjusted segment income margin is calculated by dividing non-GAAP adjusted segment income by non-GAAP adjusted revenue for each segment.
***Non-GAAP adjustments unassigned to a segment were selling, general, and administrative deconversion costs.
Three Months Ended December 31, 2023
(Unaudited, in thousands)
Core
Payments
Complementary
Corporate
and Other
Total
GAAP REVENUE
$ 165,601
$ 203,839
$ 152,466
$ 23,795
$ 545,701
Non-GAAP adjustments*
(1,929)
(1,555)
(1,355)
(43)
(4,882)
NON-GAAP ADJUSTED REVENUE
163,672
202,284
151,111
23,752
540,819
GAAP COST OF REVENUE
69,370
111,623
62,825
77,161
320,979
Non-GAAP adjustments*
(321)
(51)
(249)
—
(621)
NON-GAAP ADJUSTED COST OF REVENUE
69,049
111,572
62,576
77,161
320,358
GAAP SEGMENT INCOME
$ 96,231
$ 92,216
$ 89,641
$ (53,366)
Segment Income Margin**
58.1 %
45.2 %
58.8 %
(224.3) %
NON-GAAP ADJUSTED SEGMENT INCOME
$ 94,623
$ 90,712
$ 88,535
$ (53,409)
Non-GAAP Adjusted Segment Income Margin
57.8 %
44.8 %
58.6 %
(224.9) %
Research and Development
35,478
Selling, General, and Administrative
70,277
Non-GAAP adjustments unassigned to a segment***
(458)
NON-GAAP TOTAL ADJUSTED OPERATING EXPENSES
425,655
NON-GAAP ADJUSTED OPERATING INCOME
$ 115,164
*Revenue non-GAAP adjustments for all segments were deconversion revenues. Cost of revenue non-GAAP adjustments for the Core, Payments, and Complementary segments were deconversion costs.
**Segment income margin is calculated by dividing segment income by revenue for each segment. Non-GAAP adjusted segment income margin is calculated by dividing non-GAAP adjusted segment income by non-GAAP adjusted revenue for each segment.
***Non-GAAP adjustments unassigned to a segment were selling, general, and administrative deconversion costs.
Six Months Ended December 31, 2024
(Unaudited, in thousands)
Core
Payments
Complementary
Corporate
and Other
Total
GAAP REVENUE
$ 368,797
$ 426,758
$ 332,639
$ 46,635
$ 1,174,829
Non-GAAP adjustments*
(1,267)
(1,948)
(533)
(18)
(3,766)
NON-GAAP ADJUSTED REVENUE
367,530
424,810
332,106
46,617
1,171,063
GAAP COST OF REVENUE
152,159
227,757
129,352
167,014
676,282
Non-GAAP adjustments*
(125)
(71)
(159)
—
(355)
NON-GAAP ADJUSTED COST OF REVENUE
152,034
227,686
129,193
167,014
675,927
GAAP SEGMENT INCOME
$ 216,638
$ 199,001
$ 203,287
$ (120,379)
Segment Income Margin**
58.7 %
46.6 %
61.1 %
(258.1) %
NON-GAAP ADJUSTED SEGMENT INCOME
$ 215,496
$ 197,124
$ 202,913
$ (120,397)
Non-GAAP Adjusted Segment Income Margin
58.6 %
46.4 %
61.1 %
(258.3) %
Research and Development
80,780
Selling, General, and Administrative
143,489
Non-GAAP adjustments unassigned to a segment***
(538)
NON-GAAP TOTAL ADJUSTED OPERATING EXPENSES
899,658
NON-GAAP ADJUSTED OPERATING INCOME
$ 271,405
*Revenue non-GAAP adjustments for all segments were deconversion revenue. Cost of revenue non-GAAP adjustments for the Core, Payments, and Complementary segments were deconversion costs.
**Segment income margin is calculated by dividing segment income by revenue for each segment. Non-GAAP adjusted segment income margin is calculated by dividing non-GAAP adjusted segment income by non-GAAP adjusted revenue for each segment.
***Non-GAAP adjustments unassigned to a segment were selling, general, and administrative deconversion costs.
Six Months Ended December 31, 2023
(Unaudited, in thousands)
Core
Payments
Complementary
Corporate
and Other
Total
GAAP REVENUE
$ 352,041
$ 403,195
$ 313,833
$ 48,000
$ 1,117,069
Non-GAAP adjustments*
(3,595)
(2,560)
(2,806)
(57)
(9,018)
NON-GAAP ADJUSTED REVENUE
348,446
400,635
311,027
47,943
1,108,051
GAAP COST OF REVENUE
145,296
220,449
123,783
154,453
643,981
Non-GAAP adjustments*
(425)
(98)
(367)
(1)
(891)
NON-GAAP ADJUSTED COST OF REVENUE
144,871
220,351
123,416
154,452
643,090
GAAP SEGMENT INCOME
$ 206,745
$ 182,746
$ 190,050
$ (106,453)
Segment Income Margin**
58.7 %
45.3 %
60.6 %
(221.8) %
NON-GAAP ADJUSTED SEGMENT INCOME
$ 203,575
$ 180,284
$ 187,611
$ (106,509)
Non-GAAP Adjusted Segment Income Margin
58.4 %
45.0 %
60.3 %
(222.2) %
Research and Development
72,370
Selling, General, and Administrative
149,051
Non-GAAP adjustments unassigned to a segment***
(17,012)
NON-GAAP TOTAL ADJUSTED OPERATING EXPENSES
847,499
NON-GAAP ADJUSTED OPERATING INCOME
$ 260,552
*Revenue non-GAAP adjustments for all segments were deconversion revenues. Cost of revenue non-GAAP adjustments for all segments were deconversion costs.
**Segment income margin is calculated by dividing segment income by revenue for each segment. Non-GAAP adjusted segment income margin is calculated by dividing non-GAAP adjusted segment income by non-GAAP adjusted revenue for each segment.
***Non-GAAP adjustments unassigned to a segment were VEDIP expenses of $16,443 and selling, general, and administrative deconversion costs of $569. The VEDIP program expense for the fiscal six months ended December 31, 2023, was related to a Company voluntary separation program offered to certain eligible employees beginning in July 2023.
The table below shows our GAAP to non-GAAP guidance for the fiscal year ending June 30, 2025. Fiscal year 2025 non-GAAP guidance excludes the impacts of deconversion revenue and related operating expenses and assumes no acquisitions or dispositions are made during the fiscal year.
GAAP to Non-GAAP GUIDANCE (In millions, except per share data)
Annual FY25
Low
High
GAAP REVENUE
$ 2,369
$ 2,391
Growth
6.9 %
7.9 %
Deconversions*
$ 16
$ 16
NON-GAAP ADJUSTED REVENUE**
$ 2,353
$ 2,375
Non-GAAP Adjusted Growth
7.0 %
8.0 %
GAAP OPERATING EXPENSES
$ 1,823
$ 1,836
Growth
5.6 %
6.4 %
Deconversion costs*
$ 3
$ 3
NON-GAAP ADJUSTED OPERATING EXPENSES**
$ 1,820
$ 1,833
Non-GAAP Adjusted Growth
6.7 %
7.4 %
GAAP OPERATING INCOME
$ 546
$ 555
Growth
11.6 %
13.3 %
GAAP OPERATING MARGIN
23.0 %
23.2 %
NON-GAAP ADJUSTED OPERATING INCOME**
$ 533
$ 542
Non-GAAP Adjusted Growth
8.2 %
9.9 %
NON-GAAP ADJUSTED OPERATING MARGIN
22.7 %
22.8 %
GAAP EPS***
$ 5.78
$ 5.87
Growth
10.6 %
12.3 %
Non-GAAP EPS***
$ 5.65
$ 5.74
Growth
7.3 %
9.0 %
*Deconversion revenue and related operating expenses are based on actual results for the six months ended December 31, 2024, and estimates for the remainder of fiscal year 2025, based on the lowest actual recent historical results. See the Company’s Form 8-K filed with the Securities and Exchange Commission on January 27, 2025.
**GAAP to Non-GAAP revenue, operating expenses, and operating income may not foot due to rounding.
***The GAAP to Non-GAAP EPS reconciliation table is below on page 15.
Balance Sheet and Cash Flow Review (In millions)
Cash and cash equivalents were $26 million at December 31, 2024, and $27 million at December 31, 2023.Trade receivables were $283 million at December 31, 2024, compared to $271 million at December 31, 2023.The Company had $150 million of borrowings at December 31, 2024 compared to $255 million of borrowings at December 31, 2023.Deferred revenue remained consistent at $269 million at December 31, 2024, and 2023.Stockholders’ equity increased to $1,976 million at December 31, 2024, compared to $1,724 million at December 31, 2023.
*See table below for Net Cash Provided by Operating Activities and on page 14 for Return on Average Shareholders’ Equity. Tables reconciling the non-GAAP measures Free Cash Flow and Return on Invested Capital (ROIC) to GAAP measures are also on page 14. See the Use of Non-GAAP Financial Information section below for the definitions of Free Cash Flow and ROIC.
The following table summarizes net cash from operating activities:
(Unaudited, in thousands)
Six Months Ended December 31,
2024
2023
Net income
$ 217,036
$ 193,644
Depreciation
22,731
23,765
Amortization
79,517
75,366
Change in deferred income taxes
(8,745)
(16,532)
Other non-cash expenses
15,535
15,693
Change in receivables
49,811
90,702
Change in deferred revenue
(119,463)
(130,529)
Change in other assets and liabilities*
(49,879)
(13,437)
NET CASH FROM OPERATING ACTIVITIES
$ 206,543
$ 238,672
*For the six months ended December 31, 2024, includes the change in prepaid cost of product and other of $(34,384), accrued expenses of $(19,450), and income taxes of $9,538. For the six months ended December 31, 2023, includes the change in prepaid cost of product and other of $(52,969), income taxes of $23,792, and the change in accrued expenses of $15,463.
The following table summarizes net cash from investing activities:
(Unaudited, in thousands)
Six Months Ended December 31,
2024
2023
Capital expenditures
(29,469)
(24,458)
Proceeds from dispositions
—
878
Purchased software
(3,528)
(2,971)
Computer software developed
(85,803)
(83,408)
Purchase of investments
(2,000)
(1,000)
Proceeds from investments
1,000
—
NET CASH FROM INVESTING ACTIVITIES
$ (119,800)
$ (110,959)
The following table summarizes net cash from financing activities:
(Unaudited, in thousands)
Six Months Ended December 31,
2024
2023
Borrowings on credit facilities
$ 165,000
$ 220,000
Repayments on credit facilities and financing leases
(165,000)
(240,000)
Purchase of treasury stock
(17,050)
(20,000)
Dividends paid
(80,193)
(75,722)
Net cash from issuance of stock and tax related to stock-based compensation
(2,131)
2,475
NET CASH FROM FINANCING ACTIVITIES
$ (99,374)
$ (113,247)
Use of Non-GAAP Financial Information
Generally Accepted Accounting Principles (GAAP) is the term used to refer to the standard framework of guidelines for financial accounting in the United States. GAAP includes the standards, conventions, and rules accountants follow in recording and summarizing transactions in the preparation of financial statements. In addition to reporting financial results in accordance with GAAP, we have provided certain non-GAAP financial measures, including adjusted revenue, adjusted operating income, adjusted segment income, adjusted cost of revenue, adjusted operating expenses, adjusted operating margin, adjusted segment income margin, non-GAAP earnings before interest, taxes, depreciation, and amortization (non-GAAP EBITDA), free cash flow, return on invested capital (ROIC), non-GAAP adjusted net income, and non-GAAP earnings per share (EPS).
We believe non-GAAP financial measures help investors better understand the underlying fundamentals and true operations of our business. Adjusted revenue, adjusted operating income, adjusted operating margin, adjusted segment income, adjusted segment income margin, adjusted cost of revenue, adjusted operating expenses, adjusted net income, and non-GAAP EPS eliminate one-time deconversion revenue and associated costs and the effects of the VEDIP program expense related to a Company voluntary separation program offered to certain eligible employees beginning in July 2023, which management believes are not indicative of the Company’s operating performance. Such adjustments give investors further insight into our performance. Non-GAAP EBITDA is defined as net income attributable to the Company before the effect of interest expense, taxes, depreciation, and amortization, adjusted for net income before the effect of interest expense, taxes, depreciation, and amortization attributable to eliminated one-time deconversions and the VEDIP program expense. Free cash flow is defined as net cash from operating activities, less capitalized expenditures, internal use software, and capitalized software, plus proceeds from the sale of assets. ROIC is defined as net income divided by average invested capital, which is the average of beginning and ending long-term debt and stockholders’ equity for a given period. Management believes that non-GAAP EBITDA is an important measure of the Company’s overall operating performance and excludes certain costs and other transactions that management deems one time or non-operational in nature; free cash flow is useful to measure the funds generated in a given period that are available for debt service requirements and strategic capital decisions; and ROIC is a measure of the Company’s allocation efficiency and effectiveness of its invested capital. For these reasons, management also uses these non-GAAP financial measures in its assessment and management of the Company’s performance.
Non-GAAP financial measures used by the Company may not be comparable to similarly titled non-GAAP measures used by other companies. Non-GAAP financial measures have no standardized meaning prescribed by GAAP and therefore, are unlikely to be comparable with calculations of similar measures for other companies.
Any non-GAAP financial measures should be considered in context with the GAAP financial presentation and should not be considered in isolation or as a substitute for GAAP measures. Reconciliations of the non-GAAP financial measures to related GAAP measures are included.
Quarterly Conference Call
The Company will hold a conference call on February 5, 2025, at 7:45 a.m. Central Time, and investors are invited to listen at www.jackhenry.com. A webcast replay will be available approximately one hour after the event at ir.jackhenry.com/corporate-events-and-presentations and will remain available for one year.
About Jack Henry & Associates, Inc.®
Jack Henry™ (Nasdaq: JKHY) is a well-rounded financial technology company that strengthens connections between financial institutions and the people and businesses they serve. We are an S&P 500 company that prioritizes openness, collaboration, and user centricity — offering banks and credit unions a vibrant ecosystem of internally developed modern capabilities as well as the ability to integrate with leading fintechs. For more than 48 years, Jack Henry has provided technology solutions to enable clients to innovate faster, strategically differentiate, and successfully compete while serving the evolving needs of their accountholders. We empower approximately 7,500 clients with people-inspired innovation, personal service, and insight-driven solutions that help reduce the barriers to financial health. Additional information is available at www.jackhenry.com.
Statements made in this news release that are not historical facts are “forward-looking statements” within the meaning of the Private Securities Litigation Reform Act of 1995, Section 27A of the Securities Act of 1933 and Section 21E of the Securities Exchange Act of 1934. Because forward-looking statements relate to the future, they are subject to inherent risks and uncertainties that could cause actual results to differ materially from those expressed or implied by such statements. Such risks and uncertainties include, but are not limited to, those discussed in the Company’s Securities and Exchange Commission filings, including the Company’s most recent reports on Form 10-K and Form 10-Q, particularly under the heading Risk Factors. Any forward-looking statement made in this news release speaks only as of the date of the news release, and the Company expressly disclaims any obligation to publicly update or revise any forward-looking statement, whether because of new information, future events or otherwise.
Condensed Consolidated Statements of Income (Unaudited)
(In thousands, except per share data)
Three Months Ended
December 31,
%
Change
Six Months Ended
December 31,
%
Change
2024
2023
2024
2023
REVENUE
$ 573,848
$ 545,701
5.2 %
$ 1,174,829
$ 1,117,069
5.2 %
Cost of Revenue
332,850
320,979
3.7 %
676,282
643,981
5.0 %
Research and Development
41,095
35,478
15.8 %
80,780
72,370
11.6 %
Selling, General, and Administrative
76,901
70,277
9.4 %
143,489
149,051
(3.7) %
EXPENSES
450,846
426,734
5.7 %
900,551
865,402
4.1 %
OPERATING INCOME
123,002
118,967
3.4 %
274,278
251,667
9.0 %
Interest income
7,159
5,121
39.8 %
15,506
9,866
57.2 %
Interest expense
(2,780)
(3,865)
(28.1) %
(5,605)
(8,062)
(30.5) %
Interest Income (Expense), net
4,379
1,256
248.6 %
9,901
1,804
448.8 %
INCOME BEFORE INCOME TAXES
127,381
120,223
6.0 %
284,179
253,471
12.1 %
Provision for Income Taxes
29,536
28,258
4.5 %
67,143
59,827
12.2 %
NET INCOME
$ 97,845
$ 91,965
6.4 %
$ 217,036
$ 193,644
12.1 %
Diluted net income per share
$ 1.34
$ 1.26
$ 2.97
$ 2.65
Diluted weighted average shares outstanding
73,082
72,984
73,080
72,999
Consolidated Balance Sheet Highlights (Unaudited)
(In thousands)
December 31,
%
Change
2024
2023
Cash and cash equivalents
$ 25,653
$ 26,709
(4.0) %
Receivables
283,223
270,551
4.7 %
Total assets
2,911,770
2,753,976
5.7 %
Accounts payable and accrued expenses
$ 209,926
$ 207,230
1.3 %
Current and long-term debt
150,000
255,000
(41.2) %
Deferred revenue
269,469
269,200
0.1 %
Stockholders’ equity
1,975,565
1,724,387
14.6 %
Calculation of Non-GAAP Earnings Before Income Taxes, Depreciation and Amortization (Non-GAAP EBITDA)
Three Months Ended
December 31,
%
Change
Six Months Ended
December 31,
%
Change
(In thousands)
2024
2023
2024
2023
Net income
$ 97,845
$ 91,965
$ 217,036
$ 193,644
Net interest
(4,379)
(1,256)
(9,901)
(1,804)
Taxes
29,536
28,258
67,143
59,827
Depreciation and amortization
51,754
49,896
102,248
99,131
Less: Net income before interest expense, taxes, depreciation and amortization attributable to eliminated one-time adjustments*
622
(3,802)
(2,873)
8,886
NON-GAAP EBITDA
$ 175,378
$ 165,061
6.3 %
$ 373,653
$ 359,684
3.9 %
*The fiscal second quarter 2025 and 2024 adjustments for net income before interest expense, taxes, depreciation and amortization were for deconversions. The fiscal year-to-date 2025 and 2024 adjustments were for deconversions in 2025 and deconversions and the VEDIP program expense in 2024 and were $(7,557) and $16,443, respectively. The VEDIP program expense for the fiscal six months ended December 31, 2023, was related to a Company voluntary separation program offered to certain eligible employees beginning in July 2023.
Calculation of Free Cash Flow (Non-GAAP)
Six Months Ended
December 31,
(In thousands)
2024
2023
Net cash from operating activities
$ 206,543
$ 238,672
Capitalized expenditures
(29,469)
(24,458)
Internal use software
(3,528)
(2,971)
Proceeds from sale of assets
—
878
Capitalized software
(85,803)
(83,408)
FREE CASH FLOW
$ 87,743
$ 128,713
Calculation of the Return on Average Shareholders’ Equity
December 31,
(In thousands)
2024
2023
Net income (trailing four quarters)
$ 405,208
$ 372,966
Average stockholder’s equity (period beginning and ending balances)
1,849,976
1,617,689
RETURN ON AVERAGE SHAREHOLDERS’ EQUITY
21.9 %
23.1 %
Calculation of Return on Invested Capital (ROIC) (Non-GAAP)
December 31,
(In thousands)
2024
2023
Net income (trailing four quarters)
$ 405,208
$ 372,966
Average stockholder’s equity (period beginning and ending balances)
1,849,976
1,617,689
Average current maturities of long-term debt and financing leases (period beginning and ending balances)
45,000
11
Average long-term debt (period beginning and ending balances)
157,500
265,000
Average invested capital
$ 2,052,476
$ 1,882,700
ROIC
19.7 %
19.8 %
GAAP to Non-GAAP EPS Reconciliation Table
FY25 Guidance
GAAP EPS
$5.78-$5.87
Excluded Activity, net of Tax:
Deconversion*
$0.13
Non-GAAP EPS
$5.65-$5.74
*We are not aware of any other discreet adjustments at this time. Deconversion revenue and related operating expenses are based on actual results for fiscal second quarter 2025 and estimates for the remainder of fiscal year 2025, based on the lowest actual recent historical results. See the Company’s Form 8-K filed with the Securities and Exchange Commission on January 27, 2025.
View original content to download multimedia:https://www.prnewswire.com/news-releases/jack-henry–associates-inc-reports-second-quarter-fiscal-2025-results-302368003.html
SOURCE Jack Henry & Associates, Inc.

You may like
Technology
Emdoor Launches “Ailyn” AI Hub at WAIC 2026: Unifying Intelligence Across Every Device
Published
14 minutes agoon
July 19, 2026By

SHANGHAI, July 18, 2026 /PRNewswire/ — Emdoor, a leading provider of intelligent computing devices, unveiled its latest innovation — Ailyn, an integrated software-hardware AI hub — at the World Artificial Intelligence Conference (WAIC) 2026. Under the theme “Intelligence in All Things, Boundless Edge Intelligence”, Emdoor’s Booth X1B-804 showcases four immersive scenarios spanning personal, home, enterprise, and industrial use cases, demonstrating how AI can flow seamlessly across devices.
With decades of experience across cloud, edge, device, and wearable form factors, Emdoor has established one of the industry’s most comprehensive intelligent hardware portfolios. Yet the company recognized a critical gap: while individual devices grow smarter, they often operate in isolation.
Ailyn is Emdoor’s answer to this challenge. Introduced on the WAIC Magic Box stage, Ailyn serves as a unified intelligence layer that orchestrates storage, computing power, AI models, and data across PCs, NAS systems, computing boxes, and IoT devices. The result is a scalable, centrally managed intelligence platform that delivers seamless cross-device collaboration, data privacy, and AI capabilities that improve with use.
At its core, Ailyn follows a device-first, multi-device connected philosophy. By prioritizing on-device model deployment, it reduces costs while preserving privacy, minimizing latency, and enabling offline functionality. Key capabilities include unified data access, uninterrupted task handoff between devices, intelligent multi-model routing, and dynamic compute scaling — plus built-in features for knowledge accumulation, skill expansion, persona customization, and automated task execution.
Four Scenarios, One Intelligent Ecosystem
The enterprise lineup features high-performance AI workstations, AI servers, AI NAS, Mini PCs, and motherboards. Workstations support up to 96-core processors and four double-width GPUs with integrated BMC remote management. AI servers run dual Intel Xeon scalable processors with up to eight mainstream AI accelerators. The single-GPU workstation series offers dual-platform compatibility with both Intel and AMD, featuring a PCIe 5.0 ×16 slot and up to 128GB DDR5 memory. Available in two form factors — a 23.9L tower chassis and a 15.3L compact chassis with tempered glass side panel — it delivers balanced performance for both creative workloads and local AI inference. The AI NAS unifies storage and AI computing power in one device, with192GB of octa-channel LPDDR5X memory to support local large model deployment. Ailyn unifies these resources into a private computing backbone, intelligently offloading heavy workloads so users get instant on-device responsiveness with datacenter-grade power on demand.
For individual users, the showcase includes Mini PCs, AI PCs, AI tablets, and multimodal wearables. The AP16, powered by Intel’s 3rd Generation Core™ Ultra processor, delivers 180 TOPS of AI performance with sustained 54W output — capable of running large models locally. Multimodal wearable solutions built on Qualcomm and BES chips offer faster time-to-market for brand partners. Within the Ailyn ecosystem, PCs handle heavy computing while wearables provide continuous environmental awareness, each device strengthening the whole.
Industrial visitors will find AI BOX units, rugged AI notebooks, handheld terminals, and industrial PCs. AI BOX devices come preloaded with industry-specific models for production line visual inspection. Rugged notebooks deliver reliable performance for mobile field operations. Industrial PCs feature industrial-grade architecture for 24/7 uptime. Through Ailyn, these connected devices break down traditional data silos, enabling intelligent resource orchestration and a closed-loop perception-decision-execution system that accelerates industrial digital transformation.
At the center of the home scenario are AI tablets and home NAS, connected to a full-house AIoT network. The NAS acts as the family’s private data and computing hub, while the tablet serves as the primary interface for senior health reminders and children’s learning support. Ailyn weaves these devices into a cohesive system covering family memories, health care, companionship, and home security — bringing intelligence into daily life without intruding on it.
The launch of Ailyn marks a significant evolution for Emdoor — shifting from a hardware manufacturer to a builder of intelligent infrastructure. It represents the convergence of the company’s deep hardware heritage and its AI innovation roadmap. Moving forward, Emdoor will continue investing in edge AI technology and expanding the Ailyn ecosystem alongside partners, bringing distributed intelligence from the showroom into everyday life.
Company: Emdoor Digital Technology Co.,Ltd.
Contact Person: Yao Zhou
Email: marketing.digi@emdoor.com
Website: http://www.emdoordigi.com/
City: Shenzhen, China
View original content to download multimedia:https://www.prnewswire.com/news-releases/emdoor-launches-ailyn-ai-hub-at-waic-2026-unifying-intelligence-across-every-device-302829098.html
SOURCE Emdoor Digital
Technology
AI-Powered Connectivity: APAC Charts a Path to a Smarter Digital Future
Published
9 hours agoon
July 18, 2026By

Asia-Pacific’s first Broadband Development Summit brings regulators and operators to Bangkok to set the agenda
BANGKOK, July 19, 2026 /PRNewswire/ — Government officials, standards bodies and telecom operators gathered in Bangkok on 14 July for the inaugural Broadband Development Summit APAC 2026, convened by the World Broadband Association (WBBA) to build consensus on AI-era networks.
Participants included the ITU, Thailand’s National Board of the Digital Economy and Society, WBBA, IAB, FNCAP, WAA, NIDA and the IPv6 Council, alongside operators Telkomsel, XLSmart, Surge, Globe, AIS, CMI and HKT and Huawei.
Denny Deng, President of Huawei Asia Pacific Carrier Business, envisions a “faster, smarter, greener” Asia-Pacific.
VOICES FROM THE SUMMIT
“To seize the opportunities of the AI era, we call on the industry to accelerate broadband evolution, advance computing-network synergy, and strengthen the cross-border connectivity. Together, let us build faster, smarter, and greener digital infrastructure for Asia-Pacific.”
— Denny Deng, President of Asia Pacific Carrier Business, Huawei
“High-speed broadband is no longer just about ‘getting online’ — it is the vital infrastructure upon which the entire AI revolution is being built. We view AI not merely as a tool, but as a primary engine for national competitiveness and a catalyst for improving the quality of life for all.”
— Wetang Phuangsup, Ph.D., Secretary-General, the National Board of the Digital Economy and Society, Thailand
“Three initiatives define the road to 2030. We must close the quality divide so the value of broadband reaches everyone. We must build AI-ready networks — 10G access, 800GE cores, intelligence end to end. And we must do it together, through shared standards.”
— Martin Creaner, Director General of WBBA
“Moving towards next-generation networks, network architectures must continue to evolve to deliver broader connectivity, superior quality, enhanced security, and greater intelligence. This evolution is essential for Net5.5G, positioning the network not simply as infrastructure, but as the foundation that enables AI, strengthens resilience and efficiency, and supports digital transformation across industries.”
— Dhruv Dhody, Industry Standardization Expert at Huawei, Chair of the IAB, IETF
“Across Asia-Pacific, fibre is extending beyond homes and offices into rooms, devices, and machines. By working together, we can accelerate fibre innovation and adoption to build truly AI-ready infrastructure.”
— Ilham Nandana, Chair of the Market Intelligence Committee, Fiber Network Council APAC (FNCAP)
“We fixed it before you feel it! AIS is redefining premium home broadband by combining ultra-fast connectivity with AI-driven network intelligence and smart home ecosystem — delivering proactive, invisible service excellence that transforms connectivity into differentiated customer value and sustainable ARPU growth.”
— Thanit Chaiyaboonthanit, Head of Technology Department, Broadband Business, AIS
“Connecting the Unconnected: Affordable Broadband at Scale. Create equal access to global information and empower Indonesia’s digital society.”
— Shannedy Ong, CTO of Surge Indonesia
“Beyond Connectivity: Telkomsel is transforming into a true value creator. By leveraging our FBB market-leading footprint, we power growth through service excellence, customer loyalty, and a next-generation home ecosystem.”
— Stanislaus Susatyo, Director of Sales, Telkomsel Indonesia
“We stopped treating AI as an add-on feature. Instead, our approach at Globe starts with architecture, embedding intelligence into the very core of how we build, how we sell, and how we operate.
AI continuously monitors network health, customer behavior and service quality. Rather than waiting for failures, the system predicts degradation and initiates corrective actions. By maintaining minute-level awareness of network health, our systems automatically resolve 30% of all Wi-Fi issues without any human intervention.”
— Danny Theseira, Head of Broadband Business Group at Globe Telecom
“Huawei is driving the Optics-AI Synergy to foster their collaborative growth. Through AI-ON, operators could build an AI-centric all-optical target network and establish 1-5-20ms latency circles across the Asia Pacific region. AI-ON also supports efficient computing access and usage while delivering an ultimate network experience through gigabit/ultra-gigabit home broadband, accelerating the widespread adoption of AI services.”
— Kim Jin, Vice President & Chief Marketing Officer Optical Business Product Line, Huawei
“Connectivity is not just about technology. It is a lifeline, a platform for opportunity, and a driver of sustainable development. I believe the intersection of connectivity and artificial intelligence will shape the future of smarter, more resilient networks.”
— Dr. Cosmas Zavazava, Director of the Telecommunication Development Bureau, ITU
“Performance and user experience are the essential path to the next-generation WLAN. Based on standards and AI-driven innovation, let’s jointly explore the path to the future autonomous WLAN with all the stakeholders.”
— Dr. Crane H. Yang, Secretary-General, World WLAN Application Alliance (WAA)
“At the summit, NIDA and WBBA signed an MOU to accelerate next-generation network evolution and establish pioneering smart city benchmarks through the co-development of industry standards, the harmonization of global regulations, and the sharing of vertical industry insights.
NIDA focuses on advancing network architecture standards, while WBBA drives global consensus on broadband evolution. This natural strategic complementarity creates vast opportunities for future collaboration.”
— Joey Deng, Secretary-General of NIDA
“ION-2030 develops the global standard for next generation optical networks in the AI era. It provides exceptional AI application and service experience. The WBBA and ITU will jointly accelerate its development, and this is a unique opportunity for Asia-Pacific stakeholders to actively influence the future of optical broadband networks.”
— Dr. Marcus Brunner, Chief Expert Standardization, WBBA WG1 Chair and Vice-Chair of ETSI ISG F5G
“The transition into the AI era demands a high-quality, deterministic digital foundation. By releasing Net5.5G policy guidelines, Malaysia is accelerating the evolution of next-generation network standards based on IPv6, establishing an innovative infrastructure to unleash AI’s value and drive a prosperous digital economy for 2030.”
— Prof. Sureswaran Ramadass, Chair of APAC at IPv6 Council, Industry Partner of WBBA
“The digital economy is thriving across the Asia-Pacific region, with AI emerging as a core catalyst for intelligent transformation. China Mobile International (CMI) is driving regional growth by integrating China’s advanced AI capabilities with comprehensive communications, computing, and AI services. Moving forward, CMI will collaborate closely with industry partners to foster a shared, AI-driven future for the region.”
— Paul Lin, Managing Director of Commercial and Technology, Asia Pacific, China Mobile International
“Next-generation network infrastructure is the oxygen of the intelligent economy. By integrating cutting-edge 800G connectivity with quantum-safe security, HKT is laying the essential foundations to keep Hong Kong’s enterprises highly competitive, secure, and ready for the computing paradigm shifts of tomorrow.”
— Wilson Cheung, Vice President, Broadband Design & Cyber Security, HKT
“The evolution toward Net5.5G AI WAN is an important step in strengthening XLSMART’s transport network for the future. By progressively adopting AI-assisted operations, SRv6, SDN, service differentiation, and higher-capacity transport infrastructure, we are enhancing network intelligence, operational efficiency, and service resilience while supporting long-term sustainability. This transformation is a continuous journey that aligns with the industry’s vision of AI-native broadband networks. Through collaboration with our technology partners and the broader ecosystem, we will continue to develop capabilities that deliver better network performance and support Indonesia’s growing digital connectivity needs.”
— Regie Ginanjar, Head of Transport Autonomy & Orchestration, Transport Network Transformation, XLSMART
“For the AI era, Huawei upgrades the IP bearer network via security resilience, multi-dimensional awareness, and network autonomy. This empowers carriers to guarantee service experience, accelerate monetization, and enhance efficiency, ushering in a new chapter of intelligent connectivity.”
— Arthur Wang, Vice President of Data Communication Product Line, Huawei
A CONVERGING VIEW
Speakers agreed AI is shifting networks from connectivity to intelligent connectivity, as broadband, IP, computing and cross-border infrastructure converge to support innovation and coordination.
WBBA launched the AI-Net Certification, a global benchmark for national policy, industrial ecosystems and network intelligence. XLSmart was named first AI-Net Champion, and Indonesia was among the first with a certified operator, backed by its Net5.5G roadmap.
In another high-profile segment, WBBA Director General Martin Creaner presented the Gigacity Certification to KOMDIGI, SURGE, Telkomsel, AIS, TRUE, HKT and Globe, recognizing regional broadband pioneers.
View original content to download multimedia:https://www.prnewswire.com/apac/news-releases/ai-powered-connectivity-apac-charts-a-path-to-a-smarter-digital-future-302829032.html
SOURCE HUAWEI
Technology
Laifen Expands U.S. Retail Footprint with Costco Launch of Best-Selling SE Hair Dryer
Published
10 hours agoon
July 18, 2026By

Starting July 18, Costco Members Can Shop Laifen’s Award-Winning Hair Dryer in Select Warehouse Locations Across the U.S.
NEW YORK, July 18, 2026 /PRNewswire/ — Laifen, ranked the world’s No.1 high-speed hair dryer brand, today announced the launch of its best-selling SE High-Speed Hair Dryer at select Costco warehouse locations, marking the brand’s largest U.S. retail expansion to date and bringing its award-winning haircare technology to Costco members across select U.S. markets.
The launch brings Laifen’s award-winning haircare technology to Costco, making it easier for consumers to experience the brand through one of the nation’s leading membership retailers. Laifen joins Costco’s growing portfolio of premium beauty and personal care brands. The initial rollout includes select Costco warehouse locations across the United States, with a strong presence across the Western U.S., including California, the Pacific Northwest and the Southwest.
Costco’s reputation for quality and its highly selective merchandising approach make this partnership especially meaningful. The Costco launch reflects Laifen’s continued expansion beyond direct-to-consumer channels as the brand accelerates its U.S. omnichannel retail strategy. “Costco represents an important milestone in our U.S. retail strategy,” said Romeo, General Manager of International Business of Laifen. “As more consumers seek salon-quality performance at an accessible price, we’re excited to make Laifen available through one of America’s most trusted retailers.”
Engineered to deliver professional-level performance in a sleek, lightweight design, the Laifen SE is powered by the brand’s proprietary high-speed brushless motor, delivering fast drying, reduced heat damage and smoother styling. An intelligent temperature control system continuously monitors airflow to help minimize frizz while protecting hair from excessive heat.
The Costco launch represents the next phase of Laifen’s U.S. retail expansion as the brand continues to grow beyond its direct-to-consumer and online channels. By expanding into one of the nation’s most trusted retailers, Laifen aims to broaden access to its category-disrupting haircare solutions while advancing its mission to bring more thoughtful design and everyday excellence into more homes.
The Laifen SE High-Speed Hair Dryer in White will be available at select Costco locations, while Costco.com shoppers will have access to additional color options including Purple and Pink, alongside the White model.
For more information on Laifen, please visit LaifenTech.com.
About Laifen:
Founded in 2019, Laifen is a global personal care technology brand combining high-performance engineering with modern design across hair care, oral care, and grooming categories. Ranked the world’s No. 1 high-speed hair dryer brand by Euromonitor International, Laifen first gained recognition for its self-developed 110,000 RPM high-speed brushless motor, the proprietary technology behind its award-winning hair dryers.
Building on this innovation, Laifen has expanded its portfolio to include electric toothbrushes and shavers, delivering premium technology and elevated everyday experiences to consumers worldwide. Today, Laifen products and accessories are used by over 22 million households across more than 60 countries, supported by more than 600 patents and recognized with over 50 international design and innovation awards. Driven by continuous technological breakthroughs, Laifen is committed to making cutting-edge personal care technology more accessible to consumers around the world.
View original content to download multimedia:https://www.prnewswire.com/news-releases/laifen-expands-us-retail-footprint-with-costco-launch-of-best-selling-se-hair-dryer-302828573.html
SOURCE Laifen


Emdoor Launches “Ailyn” AI Hub at WAIC 2026: Unifying Intelligence Across Every Device

AI-Powered Connectivity: APAC Charts a Path to a Smarter Digital Future

Laifen Expands U.S. Retail Footprint with Costco Launch of Best-Selling SE Hair Dryer
Send Rakhi to UK swiftly with UK Gifts Portal

Whiteboard Series with NEAR | Ep: 45 Joel Thorstensson from ceramic.network

New Gooseneck Omni Antennas Offer Enhanced Signals in a Durable Package

Why You Should Build on #NEAR – Co-founder Illia Polosukhin at CV Labs
Whiteboard Series with NEAR | Ep: 45 Joel Thorstensson from ceramic.network

NEAR End of Year Town Hall 2021: The Open Web World, MetaBUILD 2 Hackathon and 2021 recap
Trending
-

 Coin Market3 days ago
Revolut receives in-principle approval from UAE authorities for crypto services
-

 Technology3 days ago
GPU.ai Named Official Title Sponsor of AGI Summit SF 2026
-

 Coin Market3 days ago
Ostium pauses trading as security firms report multimillion-dollar oracle exploit
-

 Technology3 days ago
InventHelp Inventor Develops Improved Food Delivery Bag (LBT-9719)
-

 Near Videos5 days ago
Confidential Intents is now generally available
-

 Near Videos3 days ago
The best AI agents need your most sensitive data
-

 Coin Market3 days ago
Aave launches V4 on Avalanche, laying groundwork for tokenized credit markets
-

 Coin Market4 days ago
Crypto firms face AML risks during post-MiCA migration, says AMLA chair